TABLE OF CONTENTS
HIGHLIGHTS
INTRODUCTION
HCUP PARTNERS
1. OVERVIEW
2. DIAGNOSES
3. PROCEDURES
4. COSTS
5. WOMEN'S HEALTH
SOURCES/METHODS
DEFINITIONS
FOR MORE INFO
ACKNOWLEDGMENTS
CITATION
FACTS & FIGURES 2009 PDF
|
EXHIBIT 3.1 Most Frequent All-listed Procedures (PDF)
3.1a
Number of Stays, Stays per 10,000 Population, and Growth of the Most Frequent All-listed Procedures for Hospital Stays, 1997 and 2009
| ALL-LISTED CCS PROCEDURES |
NUMBER OF STAYS WITH THE PROCEDURE IN THOUSANDS |
STAYS PER 10,000 POPULATION WITH THE PROCEDURE |
CUMULATIVE GROWTH IN RATE |
| 1997 |
2009 |
1997 |
2009 |
1997-2009 |
| All stays (with and without procedures) |
34,679 |
39,435 |
1,278 |
1,284 |
1%‡ |
| All stays with any procedure |
21,257 |
24,730 |
783 |
806 |
3%‡ |
| Percent of all stays with a procedure |
61% |
63% |
- |
- |
|
| Blood transfusion |
1,097 |
2,829 |
40 |
92 |
128% |
| Prophylactic vaccinations and inoculations |
567 |
1,796 |
21 |
59 |
180% |
| Respiratory intubation and mechanical ventilation |
919 |
1,498 |
34 |
49 |
44% |
| Diagnostic cardiac catheterization, coronary arteriography |
1,461 |
1,476 |
54 |
48 |
-11%‡ |
| Cesarean section |
800 |
1,382 |
29 |
45 |
53% |
| Repair of obstetric laceration |
1,137 |
1,343 |
42 |
44 |
4%‡ |
| Upper gastrointestinal endoscopy |
1,105 |
1,242 |
41 |
40 |
-1%‡ |
| Circumcision |
1,164 |
1,174 |
43 |
38 |
-11% |
| Artificial rupture of membranes to assist delivery |
747 |
932 |
28 |
30 |
10%‡ |
| Fetal monitoring |
1,002 |
860 |
37 |
28 |
-24%‡ |
| Hemodialysis |
473 |
837 |
17 |
27 |
56% |
| Echocardiogram |
632 |
813 |
23 |
26 |
14%‡ |
| Percutaneous transluminal coronary angioplasty (PTCA) |
581 |
693 |
21 |
23 |
5%‡ |
| Knee arthroplasty |
329 |
686 |
12 |
22 |
84% |
| Enteral and parenteral nutrition |
277 |
576 |
10 |
19 |
84% |
| Colonoscopy and biopsy |
531 |
564 |
20 |
18 |
-6%‡ |
| Laminectomy, excision intervertebral disc |
425 |
504 |
16 |
16 |
5%‡ |
| Hysterectomy |
587 |
483 |
22 |
16 |
-27% |
| Incision of pleura, thoracentesis, chest drainage |
349 |
476 |
13 |
16 |
20% |
| Cholecystectomy and common duct exploration |
448 |
460 |
16 |
15 |
-9% |
‡ 2009 stays per 10,000 population are not statistically different from 1997 stays per 10,000 population at p<0.05.
Source: AHRQ, Center for Delivery, Organization, and Markets, Healthcare Cost and Utilization Project, Nationwide Inpatient Sample, 1997 and 2009. |
The rate of stays with procedures remained relatively stable at about 1,300 stays per 10,000 population from 1997 to 2009. About two-thirds of hospital stays involved at least one procedure.
- Blood transfusion occurred in over ten percent of all hospital stays that included a procedure and was the most frequently performed procedure in 2009. The rate of blood transfusion more than doubled from 1997 to 2009.
- Vaccinations were the second most frequent procedure performed in 2009. The rate of stays with vaccinations, typically hepatitis B immunizations for liveborn infants, increased by 180 percent from 1997 to 2009.
- The rate of stays with cardiac catheterization, the fourth most common procedure in 2009, remained relatively stable from 1997 to 2009, at about 50 per 10,000 population.
- Cesarean section was the most frequent major operating room procedure—performed on 1.4 million females in 2009.
- The rate of stays with knee arthroplasty increased 84 percent from 12 per 10,000 population in 1997 to 22 per 10,000 population in 2009. Knee arthroplasty was the fourteenth most common inpatient procedure in 2009.
3.1b
Number of Stays, Stays per 10,000 Population, and Growth of Selected All-listed Procedures for Hospital Stays, 1997 and 2009
| ALL-LISTED CCS PROCEDURES |
NUMBER OF STAYS WITH THE PROCEDURE IN THOUSANDS |
STAYS PER 10,000 POPULATION WITH THE PROCEDURE |
CUMULATIVE GROWTH IN RATE |
| 1997 |
2009 |
1997 |
2009 |
1997-2009 |
| Procedures with most rapid growth in stays per population* |
| Indwelling catheter |
60 |
203 |
2 |
7 |
198% |
| Prophylactic vaccinations and inoculations |
567 |
1,796 |
21 |
59 |
180% |
| Blood transfusion |
1,097 |
2,829 |
40 |
92 |
128% |
| Spinal fusion |
202 |
448 |
7 |
15 |
96% |
| Incision and drainage, skin and subcutaneous tissue |
118 |
248 |
4 |
8 |
85% |
| Knee arthroplasty |
329 |
686 |
12 |
22 |
84% |
| Enteral and parenteral nutrition |
277 |
576 |
10 |
19 |
84% |
| Hemodialysis |
473 |
837 |
17 |
27 |
56% |
| Cesarean section |
800 |
1,382 |
29 |
45 |
53% |
| Respiratory intubation and mechanical ventilation |
919 |
1,498 |
34 |
49 |
44% |
| Hip replacement |
291 |
438 |
11 |
14 |
33% |
* Includes only procedures with at least 100,000 stays in either 2009 or 1997. 2009 stays per 10,000 population are statistically different from 1997 stays per 10,000 population at p<0.05.
Source: AHRQ, Center for Delivery, Organization, and Markets, Healthcare Cost and Utilization Project, Nationwide Inpatient Sample, 1997 and 2009. |
The majority of the top ten most rapidly growing all-listed procedures were also among the most frequent procedures.
- Stays with indwelling catheter approximately tripled from 1997 to 2009, increasing from 2 stays per 10,000 population in 1997 to 7 stays per population in 2009.
- The rate of hospitalizations with spinal fusion doubled from 7 stays per 10,000 population in 1997 to 15 stays per 10,000 population in 2009.
- The rate of stays with hip replacement grew 33 percent, from 11 stays per 10,000 population in 1997 to 14 stays per 10,000 population in 2009.
3.1c
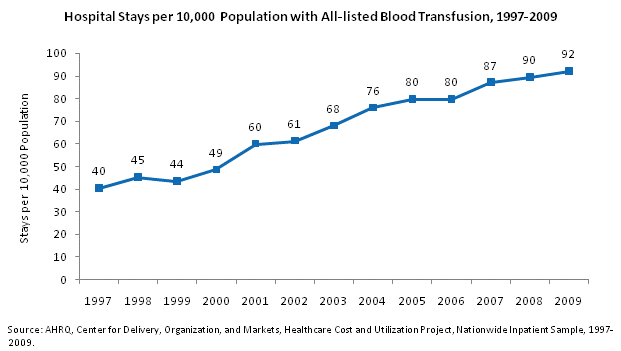
Hospital stays per 10,000 population with all-listed blood transfusion, 1997 through 2009. Line chart. Stays per 10,000 population. 1997: 40; 1998: 45; 1999: 44; 2000: 49; 2001: 60; 2002: 61; 2003: 68; 2004: 76; 2005: 80; 2006: 80; 2007: 87; 2008: 90; 2009: 92. Source: AHRQ, Center for Delivery, Organization, and Markets, Healthcare Cost and Utilization Project, Nationwide Inpatient Sample, 1997-2009.
- The rate of stays with all-listed blood transfusion has increased at a relatively steady rate from 40 stays per 10,000 population in 1997 to 92 stays per 10,000 population in 2009.
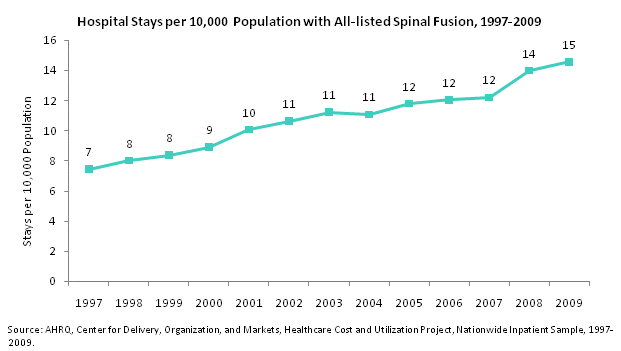
Hospital stays per 10,000 population with all-listed spinal fusion, 1997 through 2009. Line chart. Stays per 10,000 population. 1997: 7; 1998: 8; 1999: 8; 2000: 9; 2001: 10; 2002: 11; 2003: 11; 2004: 11; 2005: 12; 2006: 12; 2007: 12; 2008: 14; 2009: 15. Source: AHRQ, Center for Delivery, Organization, and Markets, Healthcare Cost and Utilization Project, Nationwide Inpatient Sample, 1997-2009.
- The rate of stays with all-listed spinal fusion increased at a relatively steady rate from 7 stays per 10,000 population in 1997 to 15 stays per 10,000 population in 2009.
Previous Next
|
