STATISTICAL BRIEF #157 |
June 2013
Lauren M. Wier, M.P.H., Hao Yu, Ph.D., Pamela L. Owens, Ph.D., and Raynard Washington, Ph.D., M.P.H. Introduction There has been considerable growth in the number of emergency department (ED) visits in the United States over the past two decades, with nearly a quarter of these visits by children.1 Many have expressed concerns about the capability of adult-focused EDs to meet the needs of children, as these EDs may have limited pediatric-focused staff and equipment.2 Given concerns that the problems faced by children in the current ED system are distinct from those of adults, some national experts have called for improving ED care specifically for children.3 Understanding the reasons why children visit EDs may provide insight into additional needs in the community. This information also may assist in improving ED resources for treating pediatric patients. This Statistical Brief presents nationally representative data from the Healthcare Cost and Utilization Project (HCUP) on ED visits for children younger than 18 years (excluding births) in 2010. Information is presented by demographic characteristics and expected payer for pediatric treat-and-release ED visits and for those that result in admission to the hospital. All differences between estimates noted in the text are statistically significant at the .0001 or better probability level. Findings Demographic characteristics During 2010, there were approximately 128.9 million visits to hospital-affiliated EDs in the United States. Children constituted one-fifth of these visits; in 2010, there were over 25.5 million ED visits for children younger than 18 years (Table 1). The vast majority (96 percent) of ED visits resulted in the child being treated and released from the ED rather than being admitted to a hospital for further care. Boys accounted for a slightly larger proportion of pediatric ED visits, regardless of whether the visit resulted in the child being treated and released or being hospitalized. Similar to the distribution in the U.S. population, children from large metropolitan areas disproportionately accounted for more ED visits, whereas children from rural areas disproportionately accounted for fewer visits. Overall, the proportion of ED visits was inversely related to wealth. ED visits for children from the poorest communities accounted for about twice as many visits as children from the wealthiest communities, despite an equal distribution of the children from communities of all incomes. |
|
| Table 1. Demographic characteristics related to ED visits for the pediatric population (excluding births) with comparison to the overall U.S. population, 2010 | ||||
| All pediatric ED visits | Treat-and-release pediatric ED visits* | Pediatric ED visits resulting in hospital admission | U.S. population, 0-17 Years | |
|---|---|---|---|---|
| Number of visits (percent of all ED visits) | 25,511,000 (100.0) | 24,499,000 (96.0) | 1,012,000 (4.0) | 74,195,760 (100.0) |
| Mean child age, years | 7.0 | 7.0 | 6.7 | 8.6† |
| Sex, % | ||||
| Girls | 47.2 | 47.3 | 45.5 | 48.8 |
| Boys | 52.8 | 52.7 | 54.5 | 51.2 |
| Patient residence, % | ||||
| Large metropolitan areas, at least one million residents | 48.3 | 47.8 | 59.1 | 55.1 |
| Small metropolitan areas, less than one million residents | 31.4 | 31.6 | 27.0 | 29.5 |
| Micropolitan | 12.3 | 12.5 | 8.9 | 9.6 |
| Not metropolitan or micropolitan (rural) | 8.0 | 8.1 | 4.9 | 5.8 |
| Median community-level income, % | ||||
| Lowest | 32.9 | 33.0 | 30.1 | 26.2 |
| Low | 29.0 | 29.1 | 26.4 | 24.0 |
| Moderate | 22.0 | 22.0 | 23.3 | 24.4 |
| Highest | 16.1 | 15.9 | 20.3 | 25.5 |
| *Among treat-and-release ED visits, the majority of visits resulted in children being discharged home (97.20%); some left without being treated (0.71%), were transferred to another acute care facility (1.30%), were sent to a long-term care facility (0.46%), were discharged to home healthcare (0.02%), or died (0.03%). Note: Pediatric visits exclude births. Age was calculated as a weighted average. Source: Agency for Healthcare Research and Quality (AHRQ), Center for Delivery, Organization, and Markets, Healthcare Cost and Utilization Project (HCUP), Nationwide Emergency Department Sample (NEDS), 2010 |
||||
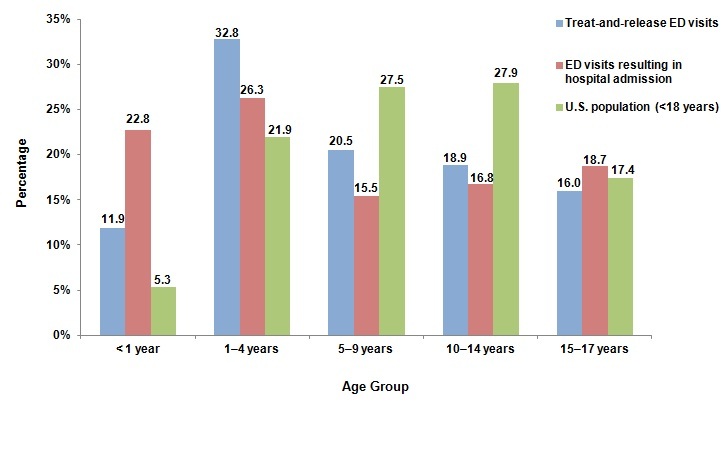
The mean age of children seen in the ED was approximately 7 years; this age was similar for treat-and-release ED visits and those that resulted in hospital admission. Figure 1 shows the percentage of pediatric ED visits and the percentage of the U.S. pediatric population by age group. Infants younger than 1 year accounted for 5.3 percent of the U.S. population aged 17 years and younger, but they had a disproportionate share of pediatric ED visits (11.9 percent of treat-and-release ED visits and 22.8 percent of ED visits resulting in hospital admission). Children aged 1-4 years accounted for nearly one-third (32.8 percent) of all pediatric treat-and-release ED visits and just over one-quarter (26.3 percent) of admitted pediatric ED visits. Children aged 15-17 years accounted for 17.4 percent of the U.S. pediatric population and a similar share of pediatric treat-and-release and admitted visits (16.0 and 18.7 percent, respectively).
|
|
Figure 1. Percentage of pediatric ED visits and pediatric population by age group, 2010
Source: Agency for Healthcare Research and Quality (AHRQ), Center for Delivery, Organization, and Markets, Healthcare Cost and Utilization Project (HCUP), Nationwide Emergency Department Sample (NEDS), 2010 Figure 1 is a bar graph showing the percentage of treat-and-release ED visits and the percentage of ED visits resulting in hospital admission, compared to the percentage of the U.S. population younger than 18 years. Data are divided into age groups. Ages younger than 1 year: Treat-and-release ED visits, 11.9, ED visits resulting in hospital admission, 22.8, U.S. population, 5.3. Ages 1 through 4 years: Treat-and-release ED visits, 32.8, ED visits resulting in hospital admission, 26.3, U.S. population, 21.9. Ages 5 through 9 years: Treat-and-release ED visits, 20.5, ED visits resulting in hospital admission, 15.5, U.S. population, 27.5. Ages 10 through 14 years: Treat-and-release ED visits, 18.9, ED visits resulting in hospital admission, 16.8, U.S. population, 27.9. Ages 15 through 17 years: Treat-and-release ED visits, 16.0, ED visits resulting in hospital admission, 18.7, U.S. population, 17.4. Source: Agency for Healthcare Research and Quality, Center for Delivery, Organization, and Markets, Healthcare Cost and Utilization Project, Nationwide Emergency Department Sample, 2010.
|
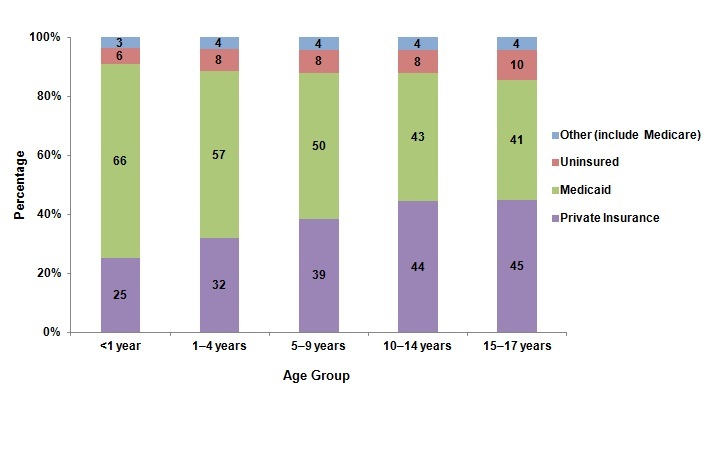
Pediatric ED visits by expected primary payer, 2010 Figure 2 shows that two-thirds of ED visits for infants younger than 1 year were billed to Medicaid, with one-quarter billed to private insurance. Medicaid was also the largest primary expected payer for ED visits among children aged 1-4 and 5-9 years (covering 57 and 50 percent of visits, respectively). The share of visits billed to private insurance increased with age (32 percent for children aged 1-4 years and 39 percent for children aged 5-9 years). Medicaid and private insurance covered a similar proportion of visits among children aged 10-14 and 15-17 years. The proportion of pediatric ED visits that were uninsured was similar across all age groups (6 to 10 percent). |
|
Figure 2. Distribution of primary expected payer for all pediatric ED visits by age group, 2010
Source: Agency for Healthcare Research and Quality (AHRQ), Center for Delivery, Organization, and Markets, Healthcare Cost and Utilization Project (HCUP), Nationwide Emergency Department Sample (NEDS), 2010 Figure 2 is a stacked column chart showing the percentage of pediatric ED visits by four categories of insurance for children younger than 18 years. Data are divided into age groups. Ages younger than 1 year: Private insurance, 25; Medicaid, 66; Uninsured, 6; Other including Medicare, 3. Ages 1 through 4 years: Private insurance, 32; Medicaid, 57; Uninsured, 8; Other including Medicare, 4; Ages 5 through 9 years: Private insurance, 39; Medicaid, 50; Uninsured, 8; Other including Medicare, 4; Ages 10 through 14 years: Private insurance, 44; Medicaid, 43; Uninsured, 8; Other including Medicare,4. Ages 15 through 17 years: Private insurance, 45; Medicaid, 41; Uninsured, 10; Other including Medicare, 4. Other papers include Medicare, Workers' Compensation, TRICARE/CHAMPUS, CHAMPVA, Title V, and other government programs. Source: Agency for Healthcare Research and Quality, Center for Delivery, Organization, and Markets, Healthcare Cost and Utilization Project, Nationwide Emergency Department Sample, 2010.
|
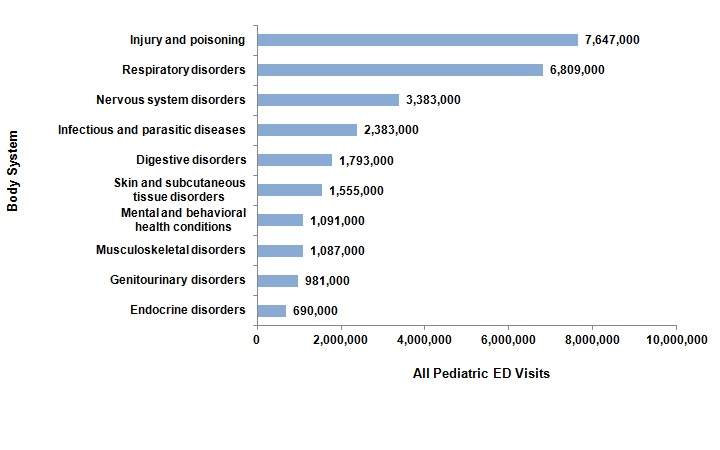
Most common all-listed reasons for pediatric ED visits Figure 3 shows the reasons for all pediatric ED visits by body system, based on all-listed diagnoses. Injuries and poisoning (combined) and respiratory disorders were the most common reasons for all ED visits, followed by nervous system disorders and infectious and parasitic diseases. Other common all-listed conditions included digestive disorders, skin and subcutaneous tissue disorders, mental and behavioral health conditions, musculoskeletal disorders, genitourinary disorders, and endocrine disorders. |
|
Figure 3. Most common reasons for all pediatric ED visits by body system, 2010
Note: Based on all-listed diagnoses. Categories are not mutually exclusive. Figure 3 is a bar graph showing the reason for the ED visit by the number of all pediatric ED visits. Injury and poisoning, 7,647,000; Respiratory disorders, 6,809,000; Nervous system disorders, 3,383,000; Infectious and parasitic diseases, 2,383,000l; Digestive disorders, 1,793,000; Skin and subcutaneous tissue disorders, 1,555,000; Mental health and behavioral health conditions, 1,091,000; Musculoskeletal disorders, 1,087,000; Genitourinary disorders, 981,000; Endocrine disorders, 690,000. Note: Based on all-listed diagnoses. Categories are not mutually exclusive.Source: Agency for Healthcare Research and Quality, Center for Delivery, Organization, and Markets, Healthcare Cost and Utilization Project, Nationwide Emergency Department Sample, 2010.
|
Most common all-listed diagnoses for pediatric ED visits Table 2 provides details on the top five most common reasons for pediatric treat-and-release ED visits for each age group in 2010. Acute symptoms (such as fever, cough, nausea and vomiting, and pain) and acute conditions (such as respiratory and viral infections) constituted the most common reasons for pediatric treat-and-release visits, with a few exceptions. Asthma was a frequent diagnosis among children aged 5-9 and 10-14 years. Injury diagnoses were also common, accounting for two of the top five conditions among children aged 5-9 and 10-14 years and three of the top five conditions among children aged 15-17 years. |
| Table 2. Top five all-listed conditions for pediatric treat-and-release ED visits by age group, 2010 | |||||
| All-listed conditions1 | Number (percent) of treat-and-release ED visits by age | ||||
|---|---|---|---|---|---|
| <1 year | 1-4 years | 5-9 years | 10-14 years | 15-17 years | |
| Other upper respiratory infections2 | 692,700 (23.8) | 1,638,700 (20.4) | 823,000 (16.4) | 442,900 (9.6) | 292,900 (7.5) |
| Fever of unknown origin | 508,100 (17.5) | 1,213,500 (15.1) | 400,100 (8.0) | ||
| Otitis media and related conditions | 400,700 (13.8) | 1,119,400 (13.9) | |||
| Other lower respiratory disease3 | 301,800 (10.4) | ||||
| Viral infection | 287,700 (9.9) | 636,800 (7.9) | |||
| Nausea and vomiting | 600,800 (7.5) | ||||
| Superficial injury; contusion | 480,100 (9.6) | 607,700 (13.2) | 458,800 (11.7) | ||
| Asthma | 452,700 (9.0) | 352,500 (7.6) | |||
| Open wounds of head; neck; and trunk | 348,700 (7.0) | ||||
| Sprains and strains | 517,700 (11.2) | 430,800 (11.0) | |||
| Abdominal pain | 325,400 (7.0) | 342,000 (8.7) | |||
| Other injuries and conditions due to external causes4 | 225,200 (5.7) | ||||
| Total treat-and-release ED visits with at least one of the top five conditions | 1,582,000 (54.4) | 3,842,000 (47.8) | 2,180,000 (43.5) | 2,057,000 (44.5) | 1,610,700 (44.1) |
| Note: The number and percentage of visits are based on all-listed conditions; an ED visit may involve more than one type of condition. Thus, percentages in the columns do not sum to the total. 1 Clinical Classifications Software (CCS) categories based on International Classification of Diseases, Ninth Revision, Clinical Modification (ICD-9-CM) diagnoses. 2 The most frequent non-mutually exclusive ICD-9-CM diagnoses within this CCS category were acute upper respiratory infection not otherwise specified and acute pharyngitis (<1 year: 81.6% and 5.7%; 1-4 years: 57.9% and 18.6%; 5-9 years: 35.5% and 35.4%; 10-14 years: 28.9% and 42.9%; 15-17 years: 25.0% and 47.8%). 3 The most frequent ICD-9-CM diagnosis within this CCS category for infants <1 year was cough (64.0%). 4 The most frequent non-mutually exclusive ICD-9-CM diagnoses within this CCS category for children aged 15-17 years were head injury unspecified (32.8%) and lower leg injury not otherwise specified (13.0%). Source: Agency for Healthcare Research and Quality (AHRQ), Center for Delivery, Organization, and Markets, Healthcare Cost and Utilization Project (HCUP), Nationwide Emergency Department Sample (NEDS), 2010 |
|||||
Table 3 presents the five most common reasons for ED visits resulting in hospital admissions by age group in 2010. Although not a common reason for treat-and-release ED visits, dehydration (fluid and electrolyte disorders) was a common diagnosis across all age groups for admitted ED visits. Similar to treat-and-release ED visits, respiratory conditions were a common reason for ED visits resulting in admission. Asthma, an ambulatory care sensitive condition, accounted for more than one-quarter of admitted ED visits among children aged 1-4 years and 5-9 years; asthma was also a frequent diagnosis among children aged 10-14 years and 15-17 years. Other respiratory conditions—including pneumonia, acute bronchitis, and upper respiratory infections—were also frequent reasons for admission. Pneumonia was common among children younger than 1 year, 1-4 years, and 5-9 years old. Acute bronchitis was the most frequent reason for ED visits resulting in admission for infants younger than 1 year, and upper respiratory infections were common among children aged 1-4 years. Other conditions such as appendicitis and mental and behavioral health conditions warranted admission to the hospital from the ED. Appendicitis was a frequent diagnosis for ED visits resulting in admission among children aged 5-9 years, 10-14 years, and 15-17 years. Mood disorders and attention-deficit, conduct, and disruptive behavioral disorders were frequent reasons for ED visits resulting in admission among older children aged 10-14 and 15-17 years (10-14 years: 14.3 and 12.3 percent; 15-17 years: 20.8 and 9.9 percent, respectively).
|
| Table 3. Most frequent all-listed conditions for pediatric ED visits that resulted in admission to the hospital by age group, 2010 | |||||
| All-listed conditions1 | Number (percent) of ED visits resulting in admission by age | ||||
|---|---|---|---|---|---|
| <1 year | 1-4 years | 5-9 years | 10-14 years | 15-17 years | |
| Acute bronchitis | 60,900 (26.5) | ||||
| Other perinatal conditions2 | 42,100 (18.3) | ||||
| Fluid and electrolyte disorders (dehydration) | 38,400 (16.7) | 58,200 (21.9) | 25,100 (16.1) | 18,700 (11.0) | 21,400 (11.3) |
| Pneumonia (except that caused by tuberculosis or sexually transmitted disease) | 29,200 (12.7) | 58,700 (22.0) | 22,800 (14.6) | ||
| Esophageal disorders | 26,300 (11.4) | ||||
| Asthma | 74,000 (27.8) | 43,500 (27.8) | 30,200 (17.8) | 21,900 (11.6) | |
| Other injuries and conditions due to external causes3 | 36,100 (13.6) | ||||
| Other upper respiratory infections4 | 31,500 (11.8) | ||||
| Other gastrointestinal disorders5 | 16,400 (10.5) | ||||
| Appendicitis and other appendiceal conditions/td> | 16,100 (10.3) | 25,600 (15.1) | 17,400 (9.2) | ||
| Mood disorders | 24,300 (14.3) | 39,400 (20.8) | |||
| Attention-deficit, conduct, and disruptive behavior disorders | 20,900 (12.3) | 18,700 (9.9) | |||
| Total ED visits resulting in admission with at least one of the top five conditions | 146,700 (63.7) | 170,700 (64.2) | 92,700 (59.3) | 94,300 (55.6) | 86,500 (45.6) |
| Note: The number and percentage of visits are based on all-listed conditions; an ED visit may involve more than one type of condition. Thus, percentages in the columns do not sum to the total. 1 Clinical Classifications Software (CCS) categories based on International Classification of Diseases, Ninth Revision, Clinical Modification (ICD-9-CM) diagnoses. 2 The most frequent, non-mutually exclusive ICD-9-CM diagnoses within this CCS category for infants <1 year were other special conditions originating in the perinatal period (15.5%), disturbances of temperature regulation of newborn (9.0%), and neonatal dehydration (7.2%). 3 The most frequent ICD-9 diagnosis within this CCS category for children aged 1-4 years was hypoxemia (79.0%). 4 The most frequent non-mutually exclusive ICD-9-CM diagnoses within this CCS category for children aged 1-4 years were acute upper respiratory infection not otherwise specified (47.5%) and croup (15.9%). 5 The most frequent non-mutually exclusive ICD-9-CM diagnoses within this CCS category for children aged 5-9 years were unspecified constipation (30.1%) and gastrostomy status (27.2%). Source: Agency for Healthcare Research and Quality (AHRQ), Center for Delivery, Organization, and Markets, Healthcare Cost and Utilization Project (HCUP), Nationwide Emergency Department Sample (NEDS), 2010 |
|||||
Data Source
The estimates in this Statistical Brief are based upon data from the Healthcare Cost and Utilization Project (HCUP) 2010 Nationwide Emergency Department Sample (NEDS). Supplemental sources included population denominator data for use with HCUP databases.4 Many hypothesis tests were conducted for this Statistical Brief. Thus, to decrease the number of false-positive results, we reduced the significance level to .0001 for individual tests. Definitions Case definition Pediatric emergency department (ED) visits include information on all visits to hospital-affiliated EDs for patients younger than 18 years, excluding births. Births were identified via diagnosis codes of V3000 to V3901, with the last 2 digits being "00" or "01" in any diagnosis field. Types of hospitals included in HCUP HCUP is based on data from community hospitals, which are defined as short-term, non-Federal, general, and other hospitals, excluding hospital units of other institutions (e.g., prisons). HCUP data include obstetrics and gynecology, otolaryngology, orthopedic, cancer, pediatric, public, and academic medical hospitals. Excluded are long-term care, rehabilitation, psychiatric, and alcoholism and chemical dependency hospitals. Community hospitals included in the Nationwide Emergency Department Sample (NEDS) have hospital-based EDs and no more than 90 percent of their ED visits resulting in admission. Unit of analysis The unit of analysis is the emergency department (ED) encounter, not a person or patient. This means that a person who is seen in the ED multiple times in one year will be counted each time as a separate "encounter" in the ED. Location of patients' residence Place of residence is based on the urban-rural classification scheme for U.S. counties developed by the National Center for Health Statistics (NCHS):
These six categories are aggregated into four groups, including large metropolitan areas with at least one million residents, small metropolitan areas with less than one million residents, micropolitan, and not metropolitan or micropolitan (rural). Median community-level income Median community-level income is the median household income of the patient's ZIP Code of residence. The cut-offs for the quartile designation are determined using ZIP Code demographic data obtained from Nielsen. The income quartile is missing for homeless and foreign patients. Payer Payer is the expected primary payer for the hospital stay. To make coding uniform across all HCUP data sources, payer combines detailed categories into general groups:
Visits billed to the State Children's Health Insurance Program (SCHIP) may be classified as Medicaid, Private Insurance or Other, depending on the structure of the State program. Because most State data do not identify SCHIP patients specifically, it is not possible to present this information separately. When more than one payer is listed for a hospital discharge, the first-listed payer is used. Diagnoses, ICD-9-CM, Clinical Classifications Software (CCS), and body systems The first-listed or principal diagnosis is the diagnosis that appears first on the record. For ED visits that result in hospital admission, this is the principal diagnosis. The principal diagnosis is the condition established after study that was primarily responsible for the admission of the patient to the hospital for care. The principal diagnosis is always the reason for hospital admission. (Definition according to the Uniform Bill [UB-92].) For treat-and-release ED visits, it may not be the principal diagnosis but may simply be the diagnosis that appears first on the record. All-listed diagnoses include the first-listed or principal diagnosis plus additional conditions that coexist at the time of the ED visit or that develop during the stay following the ED visit and have an effect on the treatment or length of stay in the ED or hospital. ICD-9-CM is the International Classification of Diseases, Ninth Revision, Clinical Modification, which assigns numeric codes to diagnoses. There are approximately 14,000 ICD-9-CM diagnosis codes. CCS categorizes ICD-9-CM diagnoses into a manageable number of clinically meaningful categories.5 This "clinical grouper" makes it easier to quickly understand patterns of diagnoses. The single-level CCS aggregates illnesses and conditions into 285 mutually exclusive diagnosis categories. The multi-level CCS is a hierarchical system that is defined using single-level CCS groupings and ICD-9-CM codes. It generates 17 categories, based on body systems (e.g., "Diseases of the Circulatory System"). About HCUP HCUP is a family of powerful healthcare databases, software tools, and products for advancing research. Sponsored by the Agency for Healthcare Research and Quality (AHRQ), HCUP includes the largest all-payer encounter-level collection of longitudinal healthcare data (inpatient, ambulatory surgery, and emergency department) in the United States, beginning in 1988. HCUP is a Federal-State-Industry Partnership that brings together the data collection efforts of many organizations—such as State data organizations, hospital associations, private data organizations, and the Federal government—to create a national information resource. HCUP would not be possible without the contributions of the following data collection Partners from across the United States: Alaska State Hospital and Nursing Home Association Arizona Department of Health Services Arkansas Department of Health California Office of Statewide Health Planning and Development Colorado Hospital Association Connecticut Hospital Association Florida Agency for Health Care Administration Georgia Hospital Association Hawaii Health Information Corporation Illinois Department of Public Health Indiana Hospital Association Iowa Hospital Association Kansas Hospital Association Kentucky Cabinet for Health and Family Services Louisiana Department of Health and Hospitals Maine Health Data Organization Maryland Health Services Cost Review Commission Massachusetts Center for Health Information and Analysis Michigan Health & Hospital Association Minnesota Hospital Association Mississippi Department of Health Missouri Hospital Industry Data Institute Montana MHA - An Association of Montana Health Care Providers Nebraska Hospital Association Nevada Department of Health and Human Services New Hampshire Department of Health & Human Services New Jersey Department of Health New Mexico Department of Health New York State Department of Health North Carolina Department of Health and Human Services North Dakota (data provided by the Minnesota Hospital Association) Ohio Hospital Association Oklahoma State Department of Health Oregon Association of Hospitals and Health Systems Oregon Health Policy and Research Pennsylvania Health Care Cost Containment Council Rhode Island Department of Health South Carolina Budget & Control Board South Dakota Association of Healthcare Organizations Tennessee Hospital Association Texas Department of State Health Services Utah Department of Health Vermont Association of Hospitals and Health Systems Virginia Health Information Washington State Department of Health West Virginia Health Care Authority Wisconsin Department of Health Services Wyoming Hospital Association About the NEDS The HCUP Nationwide Emergency Department Sample (NEDS) is a unique and powerful database that yields national estimates of emergency department (ED) visits. The NEDS was constructed using records from both the HCUP State Emergency Department Databases (SEDD) and the State Inpatient Databases (SID). The SEDD capture information on ED visits that do not result in an admission (i.e., treat-and-release visits and transfers to another hospital); the SID contain information on patients initially seen in the emergency room and then admitted to the same hospital. The NEDS was created to enable analyses of ED utilization patterns and support public health professionals, administrators, policymakers, and clinicians in their decision making regarding this critical source of care. The NEDS is produced annually beginning in 2006. For More Information For more information about HCUP, visit http://www.hcup-us.ahrq.gov/. For additional HCUP statistics, visit HCUPnet, our interactive query system, at https://datatools.ahrq.gov/hcupnet. For information on other hospitalizations in the United States, download HCUP Facts and Figures: Statistics on Hospital-Based Care in the United States in 2009, located at http://www.hcup-us.ahrq.gov/reports.jsp. For a detailed description of HCUP, more information on the design of the Nationwide Emergency Department Sample (NEDS), and methods to calculate estimates, please refer to the following publications: Introduction to the HCUP Nationwide Emergency Department Sample, 2010. Online. November 2012. U.S. Agency for Healthcare Research and Quality. http://hcup-us.ahrq.gov/db/nation/neds/NEDS2010Introductionv3.pdf. Accessed May 21, 2013. Suggested Citation Wier LM (Truven Health Analytics), Hao Y (RAND), Owens P (AHRQ), Washington R (AHRQ). Overview of Children in the Emergency Department, 2010. HCUP Statistical Brief #157. May 2013. Agency for Healthcare Research and Quality, Rockville, MD. http://www.hcup-us.ahrq.gov/reports/statbriefs/sb157.pdf. Acknowledgements The authors would like to acknowledge the contributions of Linda Lee, Nils Nordstrand, and Audrey Weiss of Truven Health Analytics. *** AHRQ welcomes questions and comments from readers of this publication who are interested in obtaining more information about access, cost, use, financing, and quality of healthcare in the United States. We also invite you to tell us how you are using this Statistical Brief and other HCUP data and tools, and to share suggestions on how HCUP products might be enhanced to further meet your needs. Please e-mail us at hcup@ahrq.gov or send a letter to the address below:Irene Fraser, Ph.D., Director Center for Delivery, Organization, and Markets Agency for Healthcare Research and Quality 540 Gaither Road Rockville, MD 20850 1 Tang N, Stein J, Hsia RY, Maselli JH, Gonzales R. Trends and characteristics of US emergency department visits, 1997-2007. Journal of the American Medical Association. 2010;304(6):664-70. 2 Lewis LM, Asplin BR. Pediatric emergency departments are not "little" adult emergency departments. Academic Emergency Medicine. 2010;17(2):202-3. 3 Institute of Medicine. Emergency Care for Children: Growing Pains. Washington, D.C.: The National Academies Press; 2007. 4 Barrett M, Hickey K, Coffey R, Levit K. Population Denominator Data for use with the HCUP Databases (Updated with 2010 Population data). ONLINE April 18, 2012. U.S. Agency for Healthcare Research and Quality. http://www.hcup-us.ahrq.gov/reports/methods/2012_01.pdf. Accessed May 28, 2013. 5 HCUP Clinical Classifications Software (CCS). Healthcare Cost and Utilization Project (HCUP). U.S. Agency for Healthcare Research and Quality, Rockville, MD. http://www.hcup-us.ahrq.gov/toolssoftware/ccs/ccs.jsp. Updated March 2013. Accessed May 28, 2013. |
| Internet Citation: Statistical Brief #157. Healthcare Cost and Utilization Project (HCUP). June 2013. Agency for Healthcare Research and Quality, Rockville, MD. hcup-us.ahrq.gov/reports/statbriefs/sb157.jsp. |
| Are you having problems viewing or printing pages on this website? |
| If you have comments, suggestions, and/or questions, please contact hcup@ahrq.gov. |
| If you are experiencing issues related to Section 508 accessibility of information on this website, please contact hcup@ahrq.gov. |
| Privacy Notice, Viewers & Players |
| Last modified 6/18/13 |