STATISTICAL BRIEF #179 |
September 2014
Halcyon G. Skinner Ph.D., M.P.H., Janice Blanchard M.D., Ph.D., and Anne Elixhauser, Ph.D. Introduction There has been an overall increase in emergency department (ED) visits over the past two decades.1 However, ED visits for specific conditions have shown varying patterns, and visits for some conditions have decreased in recent years. 2 There are a number of factors that may affect both positive and negative trends in growth for condition-specific ED visits. Some of those factors are personal, such as an individual's specific health condition. Other factors are related to the community where the individual lives—for example, the availability of healthcare options. Changes in healthcare are reflected in ED use. For example, with improved care coordination some conditions may now be more effectively managed in the outpatient setting, which reduces the need for the acute care provided by EDs.3,4 Updated information about trends in ED use over time reveals the changing needs of individuals in the community and emerging transformations in healthcare policies. This HCUP Statistical Brief presents data on changes in overall ED visits from 2006 through 2011. ED visit rates are reported by patient demographic characteristics and tracked by patient age. Changes in ED visit rates for the most common conditions and the conditions with the greatest changes also are provided. Changes in rates are considered statistically significant if the p-value is 0.05 or less. Findings Changes in ED visits rates between 2006 and 2011 Table 1 presents ED visit rates in 2006 and 2011 by patient characteristics, along with the percent change over that time period. |
|
| Table 1. Changes in ED visit rates (per 100,000 population) by patient characteristics, 2006 and 2011 | |||
| Characteristic | Rate per 100,000 population | Percent change | |
|---|---|---|---|
| 2006 | 2011 | ||
| Total rate for all ED visits | 40,200 | 42,100 | 4.5 |
| Age group, years | |||
| <1 | 88,900 | 81,600 | -8.3 |
| 1-17 | 32,700 | 33,800 | 3.1 |
| 18-44 | 43,300 | 45,400 | 5.0 |
| 45-64 | 33,000 | 35,800 | 8.3 |
| 65-84 | 48,900 | 49,500 | 1.3 |
| 85+ | 90,900 | 93,500 | 2.8 |
| Sex | |||
| Male | 37,300 | 38,200 | 2.4 |
| Female | 43,000 | 45,800 | 6.3 |
| Median income for ZIP Code | |||
| Low | 49,400 | 51,900 | 5.3 |
| Not low | 36,100 | 37,700 | 4.5 |
| Patient residence | |||
| Large central metro | 31,900 | 39,000 | 22.3 |
| Large fringe metro (suburbs) | 40,600 | 38,400 | -5.5 |
| Medium and small metro | 43,600 | 43,400 | -0.5 |
| Micropolitan and noncore (rural) | 47,300 | 50,200 | 6.2 |
| Region | |||
| Northeast | 43,200 | 45,300 | 4.8 |
| Midwest | 42,200 | 46,000 | 9.2 |
| South | 43,000 | 44,400 | 3.3 |
| West | 31,600 | 32,100 | 1.6 |
| All rates were rounded to the nearest 100. Percent change is reported based on nonrounded rates. Source: Agency for Healthcare Research and Quality (AHRQ), Center for Delivery, Organization, and Markets, Healthcare Cost and Utilization Project (HCUP), Nationwide Emergency Department Sample (NIS), 2006 and 2011 | |||
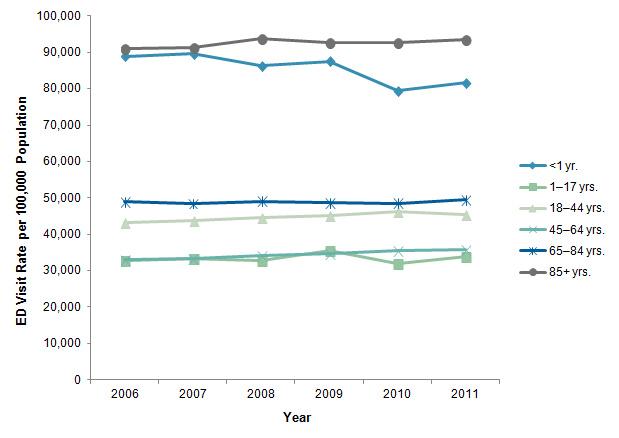
Changes in ED visits rates by patient age, 2006-2011 Figure 1 presents the trend in ED visit rates (per 100,000 population) by patient age group from 2006 through 2011. |
|
Figure 1. Trends in ED visit rates by patient age, 2006-2011
Source: Agency for Healthcare Research and Quality (AHRQ), Center for Delivery, Organization, and Markets, Healthcare Cost and Utilization Project (HCUP), Nationwide Emergency Department Sample (NEDS), 2006-2011 Figure 1 is a line graph showing the changes in ED visit rates per 100,000 population across 6 years for 6 age groups. Visit rates for individuals younger than 1 year began at 88,900 in 2006, reached a low of 79,400 in 2010, and ended at 81,600 in 2011. Visit rates for individuals aged 1-17 years began at 32,700 in 2006 and remained relatively stable, ending at 33,800 in 2011. Visit rates for individuals aged 18-44 years began at 43,300 in 2006 and remained relatively stable, ending at 45,400 in 2011. Visit rates for individuals aged 45-64 years began at 33,000 in 2006 and slowly increased to 35,800 in 2011. Visit rates for individuals aged 65-84 years began at 48,900 in 2006 and remained relatively stable, ending at 49,500 in 2011. Visit rates for individuals aged 85 years or older were consistently the highest. They began at 90,900 in 2006 and ended at 93,500 in 2011. Source: Agency for Healthcare Research and Quality (AHRQ), Center for Delivery, Organization, and Markets, Healthcare Cost and Utilization Project (HCUP), Nationwide Emergency Department Sample (NEDS), 2006-2011. |
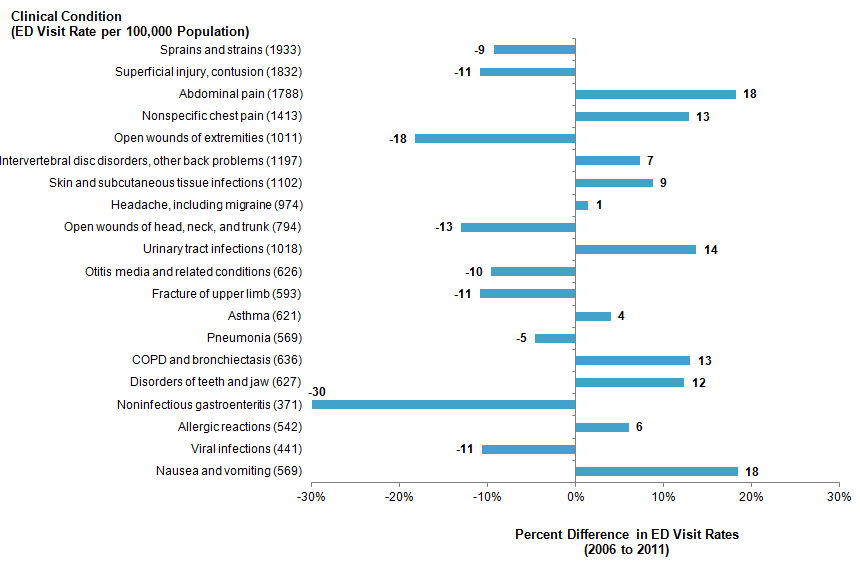
Most frequent conditions seen in the ED and changes in ED visits rates, 2006 through 2011 Figure 2 presents the conditions that were most commonly seen in the ED in 2006 and examines the changes in ED visit rates for those conditions in 2011. |
|
Figure 2. Changes in ED visit rates from 2006 to 2011 for the 20 most common conditions seen in the ED in 2006 and the ED visit rates (per 100,000 population) in 2011
Note: Conditions were identified using AHRQ's Clinical Classifications Software (CCS) based on first-listed diagnosis. The 20 most common conditions were those identified in 2006. Only conditions with at least 100,000 ED visits in 2006 were included. The most common conditions in 2011 are listed first. Rates are for 2011 and rounded to the nearest whole number. Percent differences were computed based on nonrounded rates. All differences were statistically significant at p<0.05. Figure 2 is a bar graph showing the ED visit rate per 100,000 population for 20 clinical conditions and the percent difference in ED visit rates from 2006 to 2011. Note: Conditions were identified using AHRQ's Clinical Classifications Software (CCS) based on first-listed diagnosis. The 20 most common conditions were those identified in 2006. Only conditions with at least 100,000 ED visits in 2006 were included. The most common conditions in 2011 are listed first. Rates are for 2011 and rounded to the nearest whole number. Percent differences were computed based on nonrounded rates. All differences were statistically significant at p<0.05. Sprains and strains visit rate 1,933, -9% difference from 2006 to 2011; superficial injury, contusion visit rate 1,832, -11% difference; abdominal pain visit rate 1,788, 18% difference; nonspecific chest pain visit rate 1,413, 13% difference; open wounds of extremities visit rate 1,011, -18% difference; intervertebral disc disorders, other back problems visit rate 1,197, 7% difference; skin and subcutaneous tissue infections visit rate 1,102, 9% difference; headache, including migraine visit rate 974, 1% difference; open wounds of head, neck, and trunk visit rate 794, -13% difference; urinary tract infections visit rate 1,018, 14% difference; otitis media and related conditions visit rate 626, -10% difference; fracture of upper limb visit rate 593, -11% difference; asthma visit rate 621, 4% difference; pneumonia visit rate 569, -5% difference; COPD and bronchiectasis visit rate 636, 13% difference; disorders of teeth and jaw visit rate 627, 12% difference; noninfectious gastroenteritis visit rate 371, -30% difference; allergic reactions visit rate 542, 6% difference; viral infections visit rate 441, -11% difference; and nausea and vomiting visit rate 569, 18% difference. Source: Agency for Healthcare Research and Quality (AHRQ), Center for Delivery, Organization, and Markets, Healthcare Cost and Utilization Project (HCUP), Nationwide Emergency Department Sample (NEDS), 2006 and 2011. |
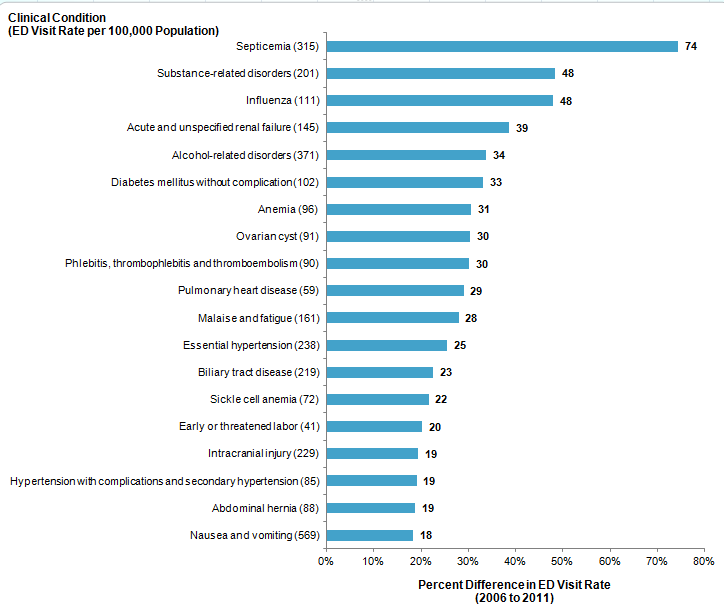
Conditions with the most rapidly increasing ED visit rates, 2006-2011 Figure 3 presents the conditions that had the largest increase in the rates of ED visits from 2006 to 2011 among those conditions with at least 100,000 ED visits in 2006. |
|
Figure 3. Conditions with the largest increases in ED visit rates from 2006 to 2011 and the ED visit rates (per 100,000 population) in 2011
Note: Conditions were identified using AHRQ's Clinical Classifications Software (CCS) based on first-listed diagnosis. Only conditions with at least 100,000 ED visits in 2006 were included. The most common conditions in 2011 are listed first. Rates are for 2011 and rounded to the nearest whole number. Percent differences are computed based on nonrounded rates. All differences were statistically significant at p<0.05. Figure 3 is a bar graph showing the ED visit rate per 100,000 population for 20 clinical conditions and the percent difference in ED visit rates from 2006 to 2011. Note: Conditions were identified using AHRQ's Clinical Classifications Software (CCS) based on first-listed diagnosis. Only conditions with at least 100,000 ED visits in 2006 were included. The most common conditions in 2011 are listed first. Rates are for 2011 and rounded to the nearest whole number. Percent differences are computed based on nonrounded rates. All differences were statistically significant at p<0.05. Septicemia visit rate 315, 74% difference from 2006 to 2011; substance-related disorders visit rate 201, 48% difference; influenza visit rate 111, 48% difference; acute and unspecified renal failure visit rate 145, 39% difference; alcohol-related disorders visit rate 371, 34% difference; diabetes mellitus without complication visit rate 102, 33% difference; anemia visit rate 96, 31% difference; ovarian cyst visit rate 91, 30% difference; phlebitis, thrombophlebitis, and thromboembolism visit rate 90, 30% difference; pulmonary heart disease visit rate 59, 29% difference; malaise and fatigue visit rate 161, 28% difference; essential hypertension visit rate 238, 25% difference; biliary tract disease visit rate 219, 23% difference; sickle cell anemia visit rate 72, 22% difference; early or threatened labor visit rate 41, 20% difference; intracranial injury visit rate 229, 19% difference; hypertension with complications and secondary hypertension visit rate 58, 19% difference; abdominal hernia visit rate 88, 19% difference; and nausea and vomiting visit rate 569, 18% difference. Source: Agency for Healthcare Research and Quality (AHRQ), Center for Delivery, Organization, and Markets, Healthcare Cost and Utilization Project (HCUP), Nationwide Emergency Department Sample (NEDS), 2006 and 2011. |
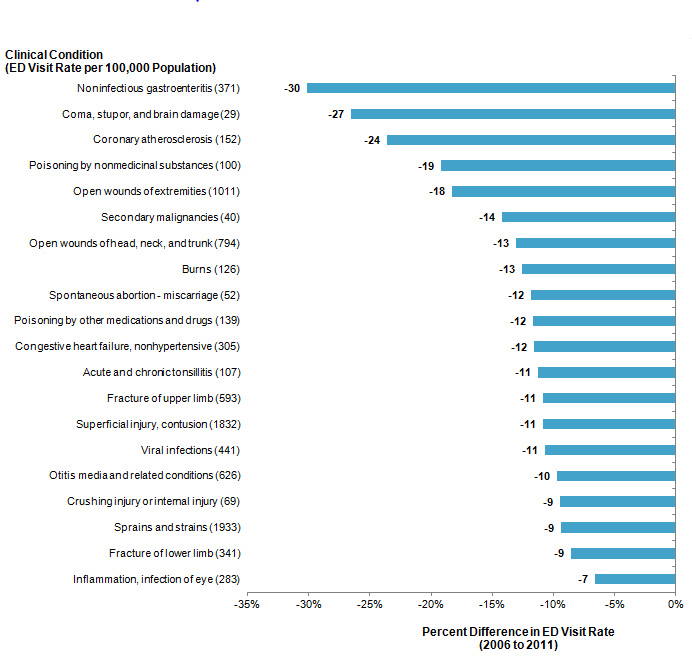
Conditions with the most rapidly decreasing ED visit rates, 2006-2011 Figure 4 presents the conditions with at least 100,000 ED visits in 2006 with the largest decreases in ED visit rates from 2006 to 2011. |
|
Figure 4. Conditions with the largest decreases in ED visit rates from 2006 to 2011 and the ED visit rates (per 100,000 population) in 2011
Note: Conditions were identified using AHRQ's Clinical Classifications Software (CCS). Only first-listed diagnoses were included. Only conditions with at least 100,000 ED visits in 2011 were included. Rates are for 2011 and rounded to the nearest whole number. Percent differences were computed based on nonrounded rates. All differences were statistically significant at p<0.05. Figure 4 is a bar graph showing the ED visit rate per 100,000 population for 20 clinical conditions and the percent difference in ED visit rates from 2011 to 2006. Note: Conditions were identified using AHRQ's Clinical Classifications Software (CCS). Only first-listed diagnoses were included. Only conditions with at least 100,000 ED visits in 2011 were included. Rates are for 2011 and rounded to the nearest whole number. Percent differences were computed based on nonrounded rates. All differences were statistically significant at p<0.05. Noninfectious gastroenteritis visit rate 371, -30% difference from 2011 to 2006; coma, stupor, and brain damage visit rate 29, -27% difference; coronary atherosclerosis visit rate 152, -24% difference; poisoning by non-medicinal substances visit rate 100, -19% difference; open wounds of extremities visit rate 1,011, -18% difference; secondary malignancies visit rate 40, -14% difference; open wounds of head, neck, and trunk visit rate 794, -13% difference; burns visit rate 126, difference -13% difference; spontaneous abortion-miscarriage visit rate 52, -12% difference; poisoning by other medications and drugs visit rate 139, -12% difference; congestive heart failure, nonhypertensive visit rate 305, -12% difference; acute and chronic tonsillitis visit rate 107, -11% difference; fracture of upper limb visit rate 593, -11% difference; superficial injury, contusion visit rate 1,832, -11% difference; viral infections visit rate 441, -11% difference; otitis media and related conditions visit rate 626, -10% difference; crushing injury or internal injury visit rate 69, -9% difference; sprains and strains visit rate 1,933, -9% difference; fracture of lower limb visit rate 341, -9% difference; and Inflammation, infection of eye visit rate 283, -7% difference. Source: Agency for Healthcare Research and Quality (AHRQ), Center for Delivery, Organization, and Markets, Healthcare Cost and Utilization Project (HCUP), Nationwide Emergency Department Sample (NEDS), 2006 and 2011. |
Data Source The estimates in this Statistical Brief are based upon data from the Healthcare Cost and Utilization Project (HCUP) Nationwide Emergency Department Sample (NEDS), 2006 through 2011. The statistics were generated from HCUPnet, a free, online query system that provides users with immediate access to the largest set of publicly available, all-payer national, regional, and State-level hospital care databases from HCUP.6 Supplemental sources included population denominator data for use with HCUP databases.7 P-values were computed using a two-sample z-test. Results were considered nominally significant if the value was 0.05 or less. Definitions Diagnoses, ICD-9-CM, and Clinical Classifications Software (CCS) The principal diagnosis is that condition established after study to be chiefly responsible for the patient's admission to the hospital. Secondary diagnoses are concomitant conditions that coexist at the time of admission or develop during the stay. ICD-9-CM is the International Classification of Diseases, Ninth Revision, Clinical Modification, which assigns numeric codes to diagnoses. There are approximately 14,000 ICD-9-CM diagnosis codes. CCS categorizes ICD-9-CM diagnoses into a manageable number of clinically meaningful categories.8 This "clinical grouper" makes it easier to quickly understand patterns of diagnoses. CCS categories identified as "Other" typically are not reported; these categories include miscellaneous, otherwise unclassifiable diagnoses that may be difficult to interpret as a group. Types of hospitals included in HCUP HCUP is based on data from community hospitals, which are defined as short-term, non-Federal, general, and other hospitals, excluding hospital units of other institutions (e.g., prisons). HCUP data include obstetrics and gynecology, otolaryngology, orthopedic, cancer, pediatric, public, and academic medical hospitals. Excluded are long-term care, rehabilitation, psychiatric, and alcoholism and chemical dependency hospitals. Community hospitals included in the Nationwide Emergency Department Sample (NEDS) have hospital-based emergency departments and no more than 90 percent of their ED visits resulting in admission. Unit of analysis The unit of analysis is the emergency department (ED) encounter, not a person or patient. This means that a person who is seen in the ED multiple times in one year will be counted each time as a separate "encounter" in the ED. Location of patients' residence Place of residence is based on the urban-rural classification scheme for U.S. counties developed by the National Center for Health Statistics (NCHS). Urban:
Rural
Payer Payer is the expected primary payer for the hospital stay. To make coding uniform across all HCUP data sources, payer combines detailed categories into general groups:
Hospital stays billed to the State Children's Health Insurance Program (SCHIP) may be classified as Medicaid, Private Insurance, or Other, depending on the structure of the State program. Because most State data do not identify SCHIP patients specifically, it is not possible to present this information separately. When more than one payer is listed for a hospital discharge, the first-listed payer is used. Region Region is one of the four regions defined by the U.S. Census Bureau:
About HCUP The Healthcare Cost and Utilization Project (HCUP, pronounced "H-Cup") is a family of healthcare databases and related software tools and products developed through a Federal-State-Industry partnership and sponsored by the Agency for Healthcare Research and Quality (AHRQ). HCUP databases bring together the data collection efforts of State data organizations, hospital associations, private data organizations, and the Federal government to create a national information resource of encounter-level healthcare data (HCUP Partners). HCUP includes the largest collection of longitudinal hospital care data in the United States, with all-payer, encounter-level information beginning in 1988. These databases enable research on a broad range of health policy issues, including cost and quality of health services, medical practice patterns, access to healthcare programs, and outcomes of treatments at the national, State, and local market levels. HCUP would not be possible without the contributions of the following data collection Partners from across the United States: Alaska State Hospital and Nursing Home Association Arizona Department of Health Services Arkansas Department of Health California Office of Statewide Health Planning and Development Colorado Hospital Association Connecticut Hospital Association Florida Agency for Health Care Administration Georgia Hospital Association Hawaii Health Information Corporation Illinois Department of Public Health Indiana Hospital Association Iowa Hospital Association Kansas Hospital Association Kentucky Cabinet for Health and Family Services Louisiana Department of Health and Hospitals Maine Health Data Organization Maryland Health Services Cost Review Commission Massachusetts Center for Health Information and Analysis Michigan Health & Hospital Association Minnesota Hospital Association Mississippi Department of Health Missouri Hospital Industry Data Institute Montana MHA - An Association of Montana Health Care Providers Nebraska Hospital Association Nevada Department of Health and Human Services New Hampshire Department of Health & Human Services New Jersey Department of Health New Mexico Department of Health New York State Department of Health North Carolina Department of Health and Human Services North Dakota (data provided by the Minnesota Hospital Association) Ohio Hospital Association Oklahoma State Department of Health Oregon Association of Hospitals and Health Systems Oregon Health Policy and Research Pennsylvania Health Care Cost Containment Council Rhode Island Department of Health South Carolina Revenue and Fiscal Affairs Office South Dakota Association of Healthcare Organizations Tennessee Hospital Association Texas Department of State Health Services Utah Department of Health Vermont Association of Hospitals and Health Systems Virginia Health Information Washington State Department of Health West Virginia Health Care Authority Wisconsin Department of Health Services Wyoming Hospital Association About Statistical Briefs HCUP Statistical Briefs are descriptive summary reports presenting statistics on hospital inpatient and emergency department use and costs, quality of care, access to care, medical conditions, procedures, patient populations, and other topics. The reports use HCUP administrative healthcare data. About the NEDS The HCUP Nationwide Emergency Department Database (NEDS) is a unique and powerful database that yields national estimates of emergency department (ED) visits. The NEDS was constructed using records from both the HCUP State Emergency Department Databases (SEDD) and the State Inpatient Databases (SID). The SEDD capture information on ED visits that do not result in an admission (i.e., treat-and-release visits and transfers to another hospital); the SID contain information on patients initially seen in the emergency room and then admitted to the same hospital. The NEDS was created to enable analyses of ED utilization patterns and support public health professionals, administrators, policymakers, and clinicians in their decision-making regarding this critical source of care. The NEDS is produced annually beginning in 2006. About HCUPnet HCUPnet is an online query system that offers instant access to the largest set of all-payer healthcare databases that are publicly available. HCUPnet has an easy step-by-step query system that creates tables and graphs of national and regional statistics as well as data trends for community hospitals in the United States. HCUPnet generates statistics using data from HCUP's Nationwide Inpatient Sample (NIS), the Kids' Inpatient Database (KID), the Nationwide Emergency Department Sample (NEDS), the State Inpatient Databases (SID), and the State Emergency Department Databases (SEDD). For More Information For more information about HCUP, visit http://www.hcup-us.ahrq.gov/. For additional HCUP statistics, visit HCUPnet, our interactive query system, at https://datatools.ahrq.gov/hcupnet. For information on other hospitalizations in the United States, refer to the following HCUP Statistical Briefs located at http://www.hcup-us.ahrq.gov/reports/statbriefs/statbriefs.jsp:
For a detailed description of HCUP, more information on the design of the Nationwide Emergency Department Sample (NEDS), and methods to calculate estimates, please refer to the following publications: Introduction to the HCUP Nationwide Emergency Department Sample (NEDS) 2011. Online. December 2013. U.S. Agency for Healthcare Research and Quality. http://www.hcup-us.ahrq.gov/db/nation/neds/NEDS2011Introduction01142014.pdf. Accessed September 11, 2014. Suggested Citation Skinner H (Truven Health Analytics), Blanchard J (RAND), Elixhauser A (AHRQ). Trends in Emergency Department Visits, 2006-2011. HCUP Statistical Brief #179. September 2014. Agency for Healthcare Research and Quality, Rockville, MD. http://www.hcup-us.ahrq.gov/reports/statbriefs/sb179-Emergency-Department-Trends.pdf. *** AHRQ welcomes questions and comments from readers of this publication who are interested in obtaining more information about access, cost, use, financing, and quality of healthcare in the United States. We also invite you to tell us how you are using this Statistical Brief and other HCUP data and tools, and to share suggestions on how HCUP products might be enhanced to further meet your needs. Please e-mail us at hcup@ahrq.gov or send a letter to the address below:Irene Fraser, Ph.D., Director Center for Delivery, Organization, and Markets Agency for Healthcare Research and Quality 540 Gaither Road Rockville, MD 20850 1 Weiss AJ, Wier LM, Stocks C, Blanchard J. Overview of Emergency Department Visits in the United States, 2011. HCUP Statistical Brief #174. June 2014. Agency for Healthcare Research and Quality, Rockville, MD. http://www.hcup-us.ahrq.gov/reports/statbriefs/sb174-Emergency-Department-Visits-Overview.pdf. Accessed August 12, 2014. 2 Tang N, Stein J, Hsia RY, Maselli JH, Gonzales R. Trends and characteristics of US emergency department visits, 1997-2007. Journal of the American Medical Association. 2010;304:664-70. 3 Brown RS, Peikes D, Peterson G, Schore J. Six features of Medicare coordinated care demonstration programs that cut hospital admissions of high-risk patients. Health Affairs. 2012;31:1156-66. 4 Foote S. Population-based disease management under fee-for-service Medicare. Health Affairs. 2003;W3-342-56. 5 Centers for Disease Control and Prevention. Past Flu Seasons. Last updated July 2014. www.cdc.gov/flu/season/past-flu-seasons.htm. Accessed October 27, 2021. 6 Agency for Healthcare Research and Quality. HCUPnet website. https://datatools.ahrq.gov/hcupnet. Accessed April 25, 2014. 7 Barrett M, Lopez-Gonzalez L, Coffey R, Levit K. Population Denominator Data for use with the HCUP Databases (Updated with 2012 Population data). HCUP Methods Series Report #2013-01. Online. March 8, 2013. U.S. Agency for Healthcare Research and Quality. http://www.hcup-us.ahrq.gov/reports/methods/2013_01.pdf. Accessed December 13, 2013. 8 HCUP Clinical Classifications Software (CCS). Healthcare Cost and Utilization Project (HCUP). U.S. Agency for Healthcare Research and Quality, Rockville, MD. Updated November 2013. http://www.hcup-us.ahrq.gov/toolssoftware/ccs/ccs.jsp. Accessed December 13, 2013. |