STATISTICAL BRIEF #227 |
September 2017
Brian J. Moore, Ph.D., Carol Stocks, Ph.D., R.N., and Pamela L. Owens, Ph.D. Introduction Over half of the 35.4 million annual inpatient admissions in the United States begin in the emergency department (ED),1 yet more than 5 times as many ED visits are treated and released2 from the ED as are admitted to the same hospital.3 ED visits have outpaced population growth since at least 1993,4 but the trend has not been uniform across conditions or patient characteristics.5 The ED is a healthcare setting where patients receive care for a variety of circumstances, including life-threatening emergencies, acute illness and injury, and complications associated with chronic conditions.6 EDs also provide care for nonurgent situations, serving as an alternative to primary care. The diversity of clinical reasons for presenting to the ED—and their associated urgency— results in variation in the mix of ED visits based on factors such as geographic location and community socioeconomic characteristics.7 ED utilization may also vary over time because of rapid changes in the healthcare system, insurance coverage, and access to care, although evidence has been mixed.8,9 This Healthcare Cost and Utilization Project (HCUP) Statistical Brief presents information on ED visits between 2006 and 2014. Population-based ED visit rates in 2006 and 2014 are provided by patient characteristics, whether the ED visit resulted in admission to the same hospital or resulted in the patient being treated and released, and the type of first-listed diagnosis for the ED visit. The first-listed diagnosis for ED visits was grouped into four categories—injury, medical, mental health/substance abuse, and maternal/neonatal. Trends in ED visits by expected payer from 2006 to 2014 are presented along with changes in the distribution of expected payer by type of first-listed diagnosis of the visit. The number of ED visits for the most frequent first-listed diagnoses seen in the ED and the diagnoses with the greatest percent change between 2006 and 2014 are compared. Relative differences in estimates of 10 percent or greater are noted in the text. Findings Characteristics of ED visits, 2006 and 2014 Table 1 presents the distribution and rate of ED visits in 2006 and 2014, overall and by select characteristics. |
|
| Table 1. ED visits by patient and visit characteristics, 2006 and 2014 | ||||||
| Characteristic | All ED visits, % | ED visit rate per 1,000 population | ||||
|---|---|---|---|---|---|---|
| 2006 | 2014 | Percent change | 2006 | 2014 | Percent change | |
| Total ED visitsa | 100.0 | 100.0 | n/a | 402.3 | 432.2 | 7.4 |
| ED visits resulting in admission to the same hospital | 15.4 | 14.1 | -8.7 | 62.1 | 61.0 | -1.9 |
| Treat-and-release ED visits | 84.6 | 85.9 | 1.6 | 340.1 | 371.2 | 9.1 |
| Age group, years | ||||||
| 0-17 | 22.0 | 19.1 | -13.4 | 358.2 | 357.0 | -0.3 |
| 18-44 | 40.4 | 39.4 | -2.7 | 432.5 | 469.6 | 8.6 |
| 45-64 | 20.7 | 23.5 | 13.6 | 330.4 | 387.9 | 17.4 |
| 65+ | 16.8 | 18.1 | 7.3 | 543.7 | 538.3 | -1.0 |
| Sex | ||||||
| Male | 45.6 | 44.5 | -2.4 | 373.2 | 390.7 | 4.7 |
| Female | 54.4 | 55.5 | 2.0 | 430.3 | 472.3 | 9.8 |
| Median income for patient's ZIP Code | ||||||
| Low (first quartile) | 30.5 | 34.4 | 13.1 | 493.5 | 607.1 | 23.0 |
| Not low (upper three quartiles) | 67.3 | 63.5 | -5.6 | 360.8 | 366.1 | 1.5 |
| Patient residence | ||||||
| Large central metro | 23.5 | 27.8 | 18.5 | 318.9 | 393.4 | 23.3 |
| Large fringe metro (suburbs) | 24.4 | 20.2 | -17.2 | 406.4 | 356.7 | -12.2 |
| Medium and small metro | 31.8 | 34.2 | 7.3 | 436.4 | 493.7 | 13.1 |
| Micropolitan and noncore (rural) | 19.7 | 17.2 | -12.6 | 472.7 | 512.5 | 8.4 |
| Region | ||||||
| Northeast | 19.6 | 18.6 | -5.3 | 431.9 | 456.1 | 5.6 |
| Midwest | 23.2 | 22.7 | -2.3 | 421.6 | 460.8 | 9.3 |
| South | 39.1 | 40.1 | 2.7 | 429.9 | 461.4 | 7.3 |
| West | 18.1 | 18.7 | 2.9 | 316.5 | 342.0 | 8.1 |
| Abbreviations: ED, emergency department; metro, metropolitan Notes: Percent change is reported based on unrounded values. Population-specific denominators are used to calculate the ED visit rate per 100,000 population (i.e., population rates are specific to the year and subcategory of interest). a N=120.0 million in 2006, and N=137.8 million in 2014. Source: Agency for Healthcare Research and Quality (AHRQ), Center for Delivery, Organization, and Markets, Healthcare Cost and Utilization Project (HCUP), Nationwide Emergency Department Sample (NEDS), 2006 and 2014 | ||||||
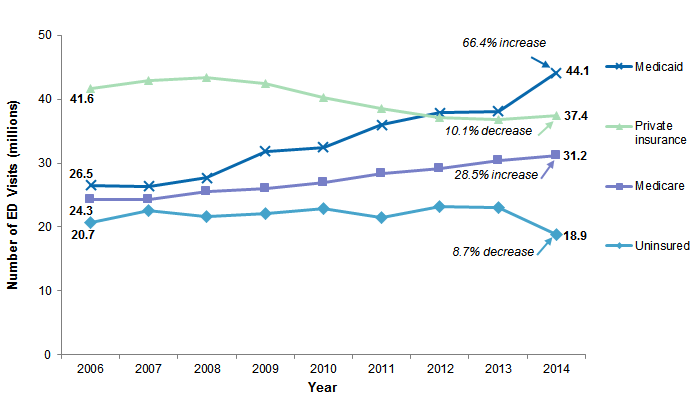
Figure 1 presents the number of ED visits by expected primary payer from 2006 through 2014. |
|
Figure 1. Trends in ED visits by expected primary payer, 2006-2014
Abbreviation: ED, emergency department Line graph showing number of emergency department visits in millions by payer, 2006-2014. Medicaid: 2006, 26.5; 2007, 26.3; 2008, 27.7; 2009, 31.9; 2010, 32.5; 2011, 35.9; 2012, 37.9; 2013, 38.1; 2014, 44.1—cumulative increase 66.4%. Private insurance: 2006, 41.6; 2007, 42.9; 2008, 43.3; 2009, 42.4; 2010, 40.2; 2011, 38.6; 2012, 37.1; 2013, 36.7; 2014, 37.4—cumulative decrease 10.1%. Medicare: 2006, 24.3; 2007, 24.3; 2008, 25.5; 2009, 25.9; 2010, 26.9; 2011, 28.4; 2012, 29.1; 2013, 30.4; 2014, 31.2—cumulative increase 28.5%. Uninsured: 2006, 20.7; 2007, 22.5; 2008, 21.7; 2009, 22.1; 2010, 22.9; 2011, 21.5; 2012, 23.2; 2013, 23.0; 2014, 18.9—cumulative decrease 8.7%.
|
| Table 2. ED visit rates by type of first-listed diagnosis, 2006 and 2014 | |||||||||
| Type of first-listed diagnosis | Rate of ED visits overall per 1,000 population | Rate of ED visits resulting in an admission per 1,000 population | Rate of ED visits that were treated and released per 1,000 population | ||||||
|---|---|---|---|---|---|---|---|---|---|
| 2006 | 2014 | Percent change | 2006 | 2014 | Percent change | 2006 | 2014 | Percent change | |
| Injury | 93.9 | 81.8 | -12.9 | 5.3 | 4.8 | -10.1 | 88.6 | 77.0 | -13.1 |
| Medical | 284.2 | 317.5 | 11.7 | 52.0 | 49.9 | -4.0 | 232.2 | 267.5 | 15.2 |
| Mental health/substance abuse | 14.1 | 20.3 | 44.1 | 3.4 | 4.5 | 31.8 | 10.6 | 15.8 | 48.1 |
| Maternal/neonatal | 10.1 | 12.7 | 25.3 | 1.4 | 1.7 | 23.4 | 8.7 | 11.0 | 25.6 |
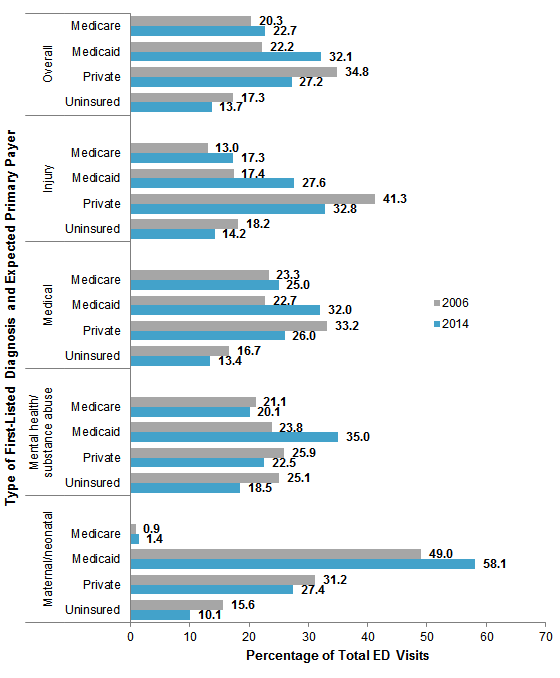
Figure 2 presents the distribution of expected primary payer for ED visits by type of first-listed diagnosis (injury, medical, mental health/substance abuse, and maternal/neonatal) comparing 2006 and 2014. |
|
Figure 2. Distribution of expected primary payer for ED visits by type of first-listed diagnosis, 2006 and 2014
Abbreviation: ED, emergency department Bar chart showing percentage of total emergency department visits by type of first-listed diagnosis and expected primary payer, 2006 and 2014. Overall: Medicare: 2006, 20.3; 2014, 22.7. Medicaid: 2006, 22.2; 2014, 32.1. Private: 2006, 34.8; 2014, 27.2. Uninsured: 2006, 17.3; 2014, 13.7. Injury: Medicare: 2006, 13.0; 2014, 17.3. Medicaid: 2006, 17.4; 2014, 27.6. Private: 2006, 41.3; 2014, 32.8. Uninsured: 2006, 18.2; 2014, 14.2. Medical: Medicare: 2006, 23.3; 2014, 25.0. Medicaid: 2006, 22.7; 2014, 32.0. Private: 2006, 33.2; 2014, 26.0. Uninsured: 2006, 16.7; 2014, 13.4. Mental Health/Substance Abuse: Medicare: 2006, 21.1; 2014, 20.1. Medicaid: 2006, 23.8; 2014, 35.0. Private: 2006, 25.9; 2014, 22.5. Uninsured: 2006, 25.1; 2014, 18.5. Maternal/Neonatal: Medicare: 2006, 0.9; 2014, 1.4. Medicaid: 2006, 49.0; 2014, 58.1. Private: 2006, 31.2; 2014, 27.4. Uninsured: 2006, 15.6; 2014, 10.1.
|
|
| Table 3. Most frequent first-listed diagnoses for ED visits, 2006 and 2014 | ||||
| Rank | Type of first-listed diagnosis (CCS category) | 2006 | 2014 | Percent change |
|---|---|---|---|---|
| Injury | ||||
| 1 | Sprains and strains | 6,363,400 | 5,755,500 | -9.6 |
| 2 | Superficial injury; contusion | 6,134,000 | 5,495,200 | -10.4 |
| 3 | Open wounds of extremities | 3,692,200 | 2,906,900 | -21.3 |
| 4 | Open wounds of head; neck; and trunk | 2,725,300 | 2,223,300 | -18.4 |
| 5 | Fracture of upper limb | 1,977,200 | 1,757,000 | -11.1 |
| Medical | ||||
| 1 | Abdominal pain | 4,515,300 | 5,960,100 | 32.0 |
| 2 | Nonspecific chest pain | 3,736,500 | 4,703,000 | 25.9 |
| 3 | Spondylosis; intervertebral disc disorders; other back problems | 3,331,600 | 4,158,800 | 24.8 |
| 4 | Urinary tract infections | 2,672,400 | 3,455,200 | 29.3 |
| 5 | Skin and subcutaneous tissue infections | 3,024,900 | 3,318,300 | 9.7 |
| Mental health/substance abuse | ||||
| 1 | Alcohol-related disorders | 827,100 | 1,458,100 | 76.3 |
| 2 | Mood disorders | 1,083,900 | 1,447,200 | 33.5 |
| 3 | Anxiety disorders | 769,500 | 1,055,400 | 37.2 |
| 4 | Schizophrenia and other psychotic disorders | 497,500 | 767,100 | 54.2 |
| 5 | Substance-related disorders | 404,600 | 702,700 | 73.7 |
| Maternal/neonatal | ||||
| 1 | Hemorrhage during pregnancy; abruptio placentae; placenta previa | 570,000 | 657,100 | 15.3 |
| 2 | Spontaneous abortion | 176,900 | 169,400 | -4.2 |
| 3 | Early or threatened labor | 102,500 | 167,500 | 63.4 |
| 4 | Normal pregnancy and/or delivery | 66,400 | 104,100 | 56.8 |
| 5 | Hypertension complicating pregnancy; childbirth and the puerperium | 31,700 | 61,700 | 94.9 |
| Abbreviations: CCS, Clinical Classifications Software; ED, emergency department Note: Selection of most frequent first-listed diagnoses was based on 2014 estimates. Source: Agency for Healthcare Research and Quality (AHRQ), Center for Delivery, Organization, and Markets, Healthcare Cost and Utilization Project (HCUP), Nationwide Emergency Department Sample (NEDS), 2006 and 2014 | ||||
|
| Table 4. First-listed ED diagnoses with the greatest percentage increase in frequency, 2006 to 2014 | ||||
| Rank | Type of first-listed diagnosis (CCS category) | 2006 | 2014 | Percent change |
|---|---|---|---|---|
| Injurya | ||||
| 1 | Intracranial injury | 572,800 | 795,000 | 38.8 |
| 2 | Poisoning by psychotropic agents | 166,900 | 177,100 | 6.1 |
| 3 | Skull and face fractures | 292,300 | 307,500 | 5.2 |
| 4 | Fracture of neck of femur (hip) | 311,200 | 321,400 | 3.3 |
| Medical | ||||
| 1 | Acute post-hemorrhagic anemia | 11,100 | 46,100 | 314.5 |
| 2 | Influenza | 223,200 | 782,700 | 250.7 |
| 3 | Septicemia (except in labor) | 538,000 | 1,405,500 | 161.3 |
| 4 | Lung disease due to external agents | 13,700 | 27,100 | 98.3 |
| 5 | Benign neoplasm of uterus | 30,200 | 56,700 | 87.7 |
| Mental health/substance abuse | ||||
| 1 | Suicidal ideation and intentional self-inflicted injury | 43,800 | 225,600 | 414.6 |
| 2 | Personality disorders | 14,000 | 29,700 | 112.3 |
| 3 | Disorders usually diagnosed in infancy, childhood, or adolescence (e.g., infantile autism) | 10,400 | 21,800 | 111.0 |
| 4 | Alcohol-related disorders | 827,100 | 1,458,100 | 76.3 |
| 5 | Substance-related disorders | 404,600 | 702,700 | 73.7 |
| Maternal/neonatal | ||||
| 1 | Prolonged pregnancy | 11,300 | 30,800 | 172.6 |
| 2 | Polyhydramnios and other problems of amniotic cavity | 16,800 | 45,700 | 172.0 |
| 3 | Previous C-section | 11,900 | 31,400 | 163.9 |
| 4 | Fetal distress and abnormal forces of labor | 14,400 | 29,900 | 107.6 |
| 5 | Hypertension complicating pregnancy; childbirth and the puerperium | 31,700 | 61,700 | 94.6 |
| Abbreviations: CCS, Clinical Classifications Software; C-section, caesarean section; ED, emergency department Note: Diagnoses without at least 10,000 ED visits in either 2006 or 2014 were excluded. a Only four injury diagnoses had increasing visit counts in 2014 compared with 2006. Source: Agency for Healthcare Research and Quality (AHRQ), Center for Delivery, Organization, and Markets, Healthcare Cost and Utilization Project (HCUP), Nationwide Emergency Department Sample (NEDS), 2006 and 2014 | ||||
|
| Table 5. First-listed ED diagnoses with the greatest percentage decrease in frequency, 2006 to 2014 | ||||
| Rank | Type of first-listed diagnosis (CCS category) | 2006 | 2014 | Percent change |
|---|---|---|---|---|
| Injury | ||||
| 1 | Open wounds of extremities | 3,692,200 | 2,906,900 | -21.3 |
| 2 | Poisoning by other medications and drugs | 416,300 | 339,200 | -18.5 |
| 3 | Open wounds of head; neck; and trunk | 2,725,300 | 2,223,300 | -18.4 |
| 4 | Fracture of upper limb | 1,977,200 | 1,757,000 | -11.1 |
| 5 | Superficial injury; contusion | 6,134,000 | 5,495,200 | -10.4 |
| Medical | ||||
| 1 | Coronary atherosclerosis and other heart disease | 594,300 | 392,000 | -34.0 |
| 2 | Coma; stupor; and brain damage | 117,500 | 77,500 | -34.0 |
| 3 | Meningitis (except that caused by tuberculosis or sexually transmitted disease) | 49,000 | 33,500 | -31.7 |
| 4 | HIV infection | 75,900 | 53,100 | -30.0 |
| 5 | Otitis media and related conditions | 2,067,700 | 1,593,000 | -23.0 |
| Mental health/substance abuse | ||||
| No diagnoses in this category decreased in 2014 compared with 2006 | ||||
| Maternal/neonatala | ||||
| 1 | Contraceptive and procreative management | 20,600 | 4,400 | -78.6 |
| 2 | Spontaneous abortion | 176,900 | 169,400 | -4.2 |
| Abbreviations: CCS, Clinical Classifications Software; ED, emergency department; HIV, human immunodeficiency virus Note: Diagnoses without at least 10,000 ED visits in either 2006 or 2014 were excluded. a Only two maternal/neonatal diagnoses had decreasing visit counts in 2014 compared with 2006. Source: Agency for Healthcare Research and Quality (AHRQ), Center for Delivery, Organization, and Markets, Healthcare Cost and Utilization Project (HCUP), Nationwide Emergency Department Sample (NEDS), 2006 and 2014 | ||||
HCUP Statistical Briefs provide basic descriptive statistics on a variety of topics using HCUP administrative healthcare data. Topics include hospital inpatient, ambulatory surgery, and emergency department use and costs, quality of care, access to care, medical conditions, procedures, and patient populations, among other topics. The reports are intended to generate hypotheses that can be further explored in other research; the reports are not designed to answer in-depth research questions using multivariate methods. Data Source The estimates in this Statistical Brief are based upon data from the Healthcare Cost and Utilization Project (HCUP) 2014 Nationwide Emergency Department Sample (NEDS). Historical data were drawn from the 2006-2013 Nationwide Emergency Department Sample (NEDS). Supplemental sources included population denominator data for use with HCUP databases, derived from information available from the U.S. Census Bureau.11 Population denominator data from Claritas, a vendor that compiles and adds value to data from the U.S. Census Bureau, was used for the calculation of rates based on location of patients' residence and community-level income, as no denominator was available from the U.S. Census Bureau for these characteristics.12 Definitions Diagnoses, ICD-9-CM, and Clinical Classifications Software (CCS) The first-listed diagnosis is the condition, symptom, or problem identified in the medical record to be chiefly responsible for the emergency department (ED) services provided. For ED visits that result in an inpatient admission to the same hospital, the first-listed diagnosis is the principal diagnosis, the condition established after study to be chiefly responsible for the patient's admission to the hospital. ICD-9-CM is the International Classification of Diseases, Ninth Revision, Clinical Modification, which assigns numeric codes to diagnoses. There are approximately 14,000 ICD-9-CM diagnosis codes. CCS categorizes ICD-9-CM diagnosis codes into a manageable number of clinically meaningful categories.13 This clinical grouper makes it easier to quickly understand patterns of diagnoses. CCS categories identified as Other typically are not reported; these categories include miscellaneous, otherwise unclassifiable diagnoses that may be difficult to interpret as a group. Type of first-listed ED diagnosis First-listed diagnoses were classified into four types based on ICD-9-CM and CCS categories in Table 6.14 Each first-listed diagnosis was assigned to a single category, sequentially, in the following order: maternal/neonatal, mental health/substance abuse, injury, and medical. |
| Table 6. ICD-9-CM and CCS diagnosis codes for defining type of first-listed diagnosis for ED visits | |
| Type | Definition (defined by CCS or ICD-9-CM codes) |
|---|---|
| Maternal/neonatal | CCS 176: Contraceptive and procreative management |
| CCS 177: Spontaneous abortion | |
| CCS 178: Induced abortion | |
| CCS 179: Postabortion complications | |
| CCS 180: Ectopic pregnancy | |
| CCS 181: Other complications of pregnancy | |
| CCS 182: Hemorrhage during pregnancy; abruptio placenta; placenta previa | |
| CCS 183: Hypertension complicating pregnancy; childbirth and the puerperium | |
| CCS 184: Early or threatened labor | |
| CCS 185: Prolonged pregnancy | |
| CCS 186: Diabetes or abnormal glucose tolerance complicating pregnancy; childbirth; or the puerperium | |
| CCS 187: Malposition; malpresentation | |
| CCS 188: Fetopelvic disproportion; obstruction | |
| CCS 189: Previous C-section | |
| CCS 190: Fetal distress and abnormal forces of labor | |
| CCS 191: Polyhydramnios and other problems of amniotic cavity | |
| CCS 192: Umbilical cord complication | |
| CCS 193: OB-related trauma to perineum and vulva | |
| CCS 194: Forceps delivery | |
| CCS 195: Other complications of birth; puerperium affecting management of mother | |
| CCS 196: Normal pregnancy and/or deliver | |
| CCS 218: Liveborn | |
| CCS 219: Short gestation; low birth weight; and fetal growth retardation | |
| CCS 220: Intrauterine hypoxia and birth asphyxia | |
| CCS 221: Respiratory distress syndrome | |
| CCS 222: Hemolytic jaundice and perinatal jaundice | |
| CCS 223: Birth trauma | |
| CCS 224: Other perinatal conditions | |
| Mental health/substance abuse | CCS 650: Adjustment disorders |
| CCS 651: Anxiety disorders | |
| CCS 652: Attention-deficit, conduct, and disruptive behavior disorders | |
| CCS 653: Delirium, dementia, and amnestic and other cognitive disorders | |
| CCS 654: Developmental disorders | |
| CCS 655: Disorders usually diagnoses in infancy, childhood, or adolescence | |
| CCS 656: Impulse control disorders, NEC | |
| CCS 657: Mood disorders | |
| CCS 658: Personality disorders | |
| CCS 659: Schizophrenia and other psychotic disorders | |
| CCS 660: Alcohol-related disorders | |
| CCS 661: Substance-related disorders | |
| CCS 662: Suicidal ideation and intentional self-inflicted injury | |
| CCS 663: Screening and history of mental health and substance abuse codes | |
| CCS 670: Miscellaneous disorders | |
| Injury | Any ICD-9-CM diagnosis code in the range 800-999 used to identify injuries by Safe States Alliance: |
| Included diagnoses: | |
| 800-909.2, 909.4, 909.9: Fractures; dislocations; sprains and strains; intracranial injury; internal injury of thorax, abdomen, and pelvis; open wound of the head, neck, trunk, upper limb, and lower limb; injury to blood vessels; late effects of injury, poisoning, toxic effects, and other external causes, excluding those of complications of surgical and medical care and drugs, medicinal or biological substances | |
| 910-994.9: Superficial injury; contusion; crushing injury; effects of foreign body entering through orifice; burns; injury to nerves and spinal cord; traumatic complications and unspecified injuries; poisoning and toxic effects of substances; other and unspecified effects of external causes | |
| 995.5-995.59: Child maltreatment syndrome. | |
| 995.80-995.85: Adult maltreatment, unspecified; adult physical abuse; adult emotional/ psychological abuse; adult sexual abuse; adult neglect (nutritional); other adult abuse and neglect | |
| Excluded diagnoses: | |
| 909.3, 909.5: Late effect of complications of surgical and medical care and late effects of adverse effects of drug, medicinal, or biological substance | |
| 995.0-995.4, 995.6-995.7, 995.86, 995.89: Other anaphylactic shock; angioneurotic edema; unspecified adverse effect of drug, medicinal and biological substance; allergy, unspecified; shock due to anesthesia; anaphylactic shock due to adverse food reaction; malignant hyperpyrexia or hypothermia due to anesthesia | |
| 996-999: Complications of surgical and medical care, not elsewhere classified | |
| Medical | Any diagnosis not defined as maternal/neonatal, mental health/substance abuse, or injury |
| Abbreviations: CCS, Clinical Classifications Software; ED, emergency department; ICD-9-CM, International Classification of Diseases, Ninth Revision, Clinical Modification; NEC, not elsewhere classified; OB, obstetric Note: The definition of injury includes five diagnosis codes that are also included under two CCS diagnosis categories used for the definition of the mental health/substance abuse category—diagnosis 980.0: toxic effect of ethyl alcohol (CCS 660: Alcohol-related disorders) and diagnoses 965.00: poisoning by opium, 965.01: poisoning by heroin, 965.02: poisoning by methadone, and 965.09: poisoning by other opiate (CCS 661: Substance-related disorders). Because of the hierarchical ordering used to assign ED visits to type of first-listed diagnosis categories, discharges with one of these five principal ICD-9-CM diagnosis codes were assigned to the mental health/substance abuse category and not the injury category. | |
Types of hospitals included in the HCUP Nationwide Emergency Department Sample
The Nationwide Emergency Department Sample (NEDS) is based on data from community hospitals, which are defined as short-term, non-Federal, general, and other hospitals, excluding hospital units of other institutions (e.g., prisons). The NEDS includes specialty, pediatric, public, and academic medical hospitals. Excluded are long-term care facilities such as rehabilitation, psychiatric, and alcoholism and chemical dependency hospitals. Hospitals included in the NEDS have hospital-owned EDs and no more than 90 percent of their ED visits resulting in admission. ED visits ED visits include information on all visits to hospital-owned EDs regardless of whether the patient was treated-and-released from that ED or admitted to the same hospital from the ED. Treat-and-release ED visits Treat-and-release ED visits were defined as those ED visits in which patients were treated and then released from the ED; that is, patients were not admitted to the specific hospital associated with the ED. In 2014, although the majority of patients discharged from the ED were discharged home (94.5 percent), some patients were transferred to another acute care facility (1.7 percent), left against medical advice (1.8 percent), were discharged to another type of long-term or intermediate care facility (nursing home or psychiatric treatment facility; 1.5 percent), were referred to home healthcare (0.2 percent), died (0.2 percent), or were discharged alive but the destination was unknown (< 0.1 percent).15 ED visits resulting in admission to the same hospital ED visits resulting in admission to the same hospital included those patients initially seen in the ED who were then admitted to the specific hospital associated with that ED. Unit of analysis The unit of analysis is the ED encounter, not a person or patient. This means that a person who is seen in the ED multiple times in 1 year will be counted each time as a separate encounter in the ED. Location of patients' residence Place of residence is based on the urban-rural classification scheme for U.S. counties developed by the National Center for Health Statistics (NCHS). For this Statistical Brief, we collapsed the NCHS categories into the following categories:
Community-level income is based on the median household income of the patient's ZIP Code of residence. Quartiles are defined so that the total U.S. population is evenly distributed. Cut-offs for the quartiles are determined annually using ZIP Code demographic data obtained from Claritas, a vendor that adds value to data from the U.S. Census Bureau.16 The value ranges for the income quartiles vary by year. Patients in the first quartile are designated as having low income, and patients in the upper three quartiles are designated as having not low income. The income quartile is missing for patients who are homeless or foreign. Payer Payer is the expected payer for the hospital stay. To make coding uniform across all HCUP data sources, payer combines detailed categories into general groups:
For this Statistical Brief, when more than one payer is listed for an ED visit, the fist-listed payer is used. Region Region is one of the four regions defined by the U.S. Census Bureau:
The majority of comparisons are based on 2 years of data, 2006 and 2014. Trends in the number of ED visits by expected primary payer from 2006 through 2014 are presented with the estimates provided for the intervening years. Percentage change Percentage change was calculated using the following formula:
Percentage change equals open parenthesis, open parenthesis, end value divided by beginning value, close parenthesis, minus 1, close parenthesis, multiplied by 100.
About HCUP The Healthcare Cost and Utilization Project (HCUP, pronounced "H-Cup") is a family of healthcare databases and related software tools and products developed through a Federal-State-Industry partnership and sponsored by the Agency for Healthcare Research and Quality (AHRQ). HCUP databases bring together the data collection efforts of State data organizations, hospital associations, and private data organizations (HCUP Partners) and the Federal government to create a national information resource of encounter-level healthcare data. HCUP includes the largest collection of longitudinal hospital care data in the United States, with all-payer, encounter-level information beginning in 1988. These databases enable research on a broad range of health policy issues, including cost and quality of health services, medical practice patterns, access to healthcare programs, and outcomes of treatments at the national, State, and local market levels. HCUP would not be possible without the contributions of the following data collection Partners from across the United States: Alaska Department of Health and Social Services Alaska State Hospital and Nursing Home Association Arizona Department of Health Services Arkansas Department of Health California Office of Statewide Health Planning and Development Colorado Hospital Association Connecticut Hospital Association District of Columbia Hospital Association Florida Agency for Health Care Administration Georgia Hospital Association Hawaii Health Information Corporation Illinois Department of Public Health Indiana Hospital Association Iowa Hospital Association Kansas Hospital Association Kentucky Cabinet for Health and Family Services Louisiana Department of Health Maine Health Data Organization Maryland Health Services Cost Review Commission Massachusetts Center for Health Information and Analysis Michigan Health & Hospital Association Minnesota Hospital Association Mississippi State Department of Health Missouri Hospital Industry Data Institute Montana Hospital Association Nebraska Hospital Association Nevada Department of Health and Human Services New Hampshire Department of Health & Human Services New Jersey Department of Health New Mexico Department of Health New York State Department of Health North Carolina Department of Health and Human Services North Dakota (data provided by the Minnesota Hospital Association) Ohio Hospital Association Oklahoma State Department of Health Oregon Association of Hospitals and Health Systems Oregon Office of Health Analytics Pennsylvania Health Care Cost Containment Council Rhode Island Department of Health South Carolina Revenue and Fiscal Affairs Office South Dakota Association of Healthcare Organizations Tennessee Hospital Association Texas Department of State Health Services Utah Department of Health Vermont Association of Hospitals and Health Systems Virginia Health Information Washington State Department of Health West Virginia Health Care Authority Wisconsin Department of Health Services Wyoming Hospital Association About the NEDS The HCUP Nationwide Emergency Department Database (NEDS) is a unique and powerful database that yields national estimates of emergency department (ED) visits. The NEDS was constructed using records from both the HCUP State Emergency Department Databases (SEDD) and the State Inpatient Databases (SID). The SEDD capture information on ED visits that do not result in an admission (i.e., patients who were treated in the ED and then released from the ED, or patients who were transferred to another hospital); the SID contain information on patients initially seen in the ED and then admitted to the same hospital. The NEDS was created to enable analyses of ED utilization patterns and support public health professionals, administrators, policymakers, and clinicians in their decision making regarding this critical source of care. The NEDS is produced annually beginning in 2006. Over time, the sampling frame for the NEDS has changed; thus, the number of States contributing to the NEDS varies from year to year. The NEDS is intended for national estimates only; no State-level estimates can be produced. For More Information For other information on emergency department visits, refer to the HCUP Statistical Briefs located at www.hcup-us.ahrq.gov/reports/statbriefs/sb_ed.jsp. For additional HCUP statistics, visit:
For a detailed description of HCUP and more information on the design of the Nationwide Emergency Department Sample (NEDS), please refer to the following database documentation: Agency for Healthcare Research and Quality. Overview of the Nationwide Emergency Department Sample (NEDS). Healthcare Cost and Utilization Project (HCUP). Rockville, MD: Agency for Healthcare Research and Quality. Updated December 2016. www.hcup-us.ahrq.gov/nedsoverview.jsp. Accessed January 5, 2017. Suggested Citation Moore BJ (IBM Watson Health), Stocks C (AHRQ), Owens PL (AHRQ). Trends in Emergency Department Visits, 2006-2014. HCUP Statistical Brief #227. September 2017. Agency for Healthcare Research and Quality, Rockville, MD. www.hcup-us.ahrq.gov/reports/statbriefs/sb227-Emergency-Department-Visit-Trends.pdf. Acknowledgments The authors would like to acknowledge the contributions of Minya Sheng of IBM Watson Health. *** AHRQ welcomes questions and comments from readers of this publication who are interested in obtaining more information about access, cost, use, financing, and quality of healthcare in the United States. We also invite you to tell us how you are using this Statistical Brief and other HCUP data and tools, and to share suggestions on how HCUP products might be enhanced to further meet your needs. Please e-mail us at hcup@ahrq.gov or send a letter to the address below:Sharon B. Arnold, Ph.D., Acting Director Center for Delivery, Organization, and Markets Agency for Healthcare Research and Quality 5600 Fishers Lane Rockville, MD 20857 This Statistical Brief was posted online on September 12, 2017. 1 Calculated from HCUPnet. Healthcare Cost and Utilization Project (HCUP). 2014. Rockville, MD: Agency for Healthcare Research and Quality. datatools.ahrq.gov/hcupnet Accessed March 24, 2017. 2 Includes ED visits in which patients were not admitted to the hospital associated with the ED. Patients may have been discharged home, transferred to another acute care facility, left against medical advice, went to another long-term or immediate care facility (nursing home or psychiatric treatment facility), discharged to home health, or died. 3 Weiss AJ, Wier LM, Stocks C, Blanchard J. Overview of Emergency Department Visits in the United States, 2011. HCUP Statistical Brief #174. June 2014. Agency for Healthcare Research and Quality, Rockville, MD. www.hcup-us.ahrq.gov/reports/statbriefs/sb174-Emergency-Department-Visits-Overview.pdf. 4 National Academies of Sciences, Engineering, and Medicine. 2007. Hospital-Based Emergency Care: At a Breaking Point. Washington, DC: The National Academies Press. 5 Skinner HG, Blanchard J, Elixhauser A. Trends in Emergency Department Visits, 2006-2011. HCUP Statistical Brief #179. September 2014. Agency for Healthcare Research and Quality, Rockville, MD. www.hcup-us.ahrq.gov/reports/statbriefs/sb179-Emergency-Department-Trends.pdf. 6 National Academies of Sciences, Engineering, and Medicine, 2007. Op. cit. 7 Ibid. 8 Miller S. The effect of insurance on emergency room visits: an analysis of the 2006 Massachusetts health reform. Journal of Public Economics. December 2012;96(11-12):893-908. 9 Ginde AA, Lowe RA, Wiler JL. Health insurance status change and emergency department use among US adults. Archives of Internal Medicine. 2012;172(8):642-647. 10 Barrett M, McCarty J, Coffey R, Levit K. Population Denominator Data for Use With the HCUP Databases (Updated with 2015 Population Data). HCUP Methods Series Report #2016-04. September 29, 2016. Rockville, MD: Agency for Healthcare Research and Quality. www.hcup-us.ahrq.gov/reports/methods/2016-04.pdf. Accessed January 31, 2017. 11 Barrett M, McCarty J, Coffey R, Levit K. Population Denominator Data for Use with the HCUP Databases (Updated with 2015 Population Data). HCUP Methods Series Report #2016-04. September 29, 2016. Rockville, MD: Agency for Healthcare Research and Quality. www.hcup-us.ahrq.gov/reports/methods/2016-04.pdf. Accessed January 31, 2017. 12 Claritas. Claritas Demographic Profile. www.claritas.com. Accessed February 14, 2017. 13 Agency for Healthcare Research and Quality. HCUP Clinical Classifications Software (CCS) for ICD-9-CM. Healthcare Cost and Utilization Project (HCUP). Rockville, MD: Agency for Healthcare Research and Quality. Updated October 2016. www.hcup-us.ahrq.gov/toolssoftware/ccs/ccs.jsp. Accessed February 14, 2017. 14 ED visit types were adapted from the hospital service line variable used in the HCUP State Inpatient Databases (SID). Diagnosis-related groups (DRGs), which are used to distinguish surgical and medical stays with inpatient data, are not available with ED visit data; all ED visits that did not fall into one of the other ED visit types (maternal/neonatal, mental health/substance abuse, or injury) were categorized as medical. Agency for Healthcare Research and Quality. Central Distributor SID: Description of Data Elements-SERVICELINE. Healthcare Cost and Utilization Project (HCUP). Rockville, MD: Agency for Healthcare Research and Quality. Updated August 2008. www.hcup-us.ahrq.gov/db/vars/siddistnote.jsp?var=serviceline. Accessed February 14, 2017. 15 Statistics were obtained from an HCUPnet (datatools.ahrq.gov/hcupnet) query of discharge status in the 2014 Nationwide Emergency Department Sample (NEDS) among all discharges. Accessed August 31, 2017. 16 Claritas. Claritas Demographic Profile. www.claritas.com. |
| Internet Citation: Statistical Brief #227. Healthcare Cost and Utilization Project (HCUP). September 2017. Agency for Healthcare Research and Quality, Rockville, MD. hcup-us.ahrq.gov/reports/statbriefs/sb227-Emergency-Department-Visit-Trends.jsp. |
| Are you having problems viewing or printing pages on this website? |
| If you have comments, suggestions, and/or questions, please contact hcup@ahrq.gov. |
| If you are experiencing issues related to Section 508 accessibility of information on this website, please contact hcup@ahrq.gov. |
| Privacy Notice, Viewers & Players |
| Last modified 9/11/17 |