STATISTICAL BRIEF #229 |
October 2017
Ruirui Sun, Ph.D., Zeynal Karaca, Ph.D., and Herbert S. Wong, Ph.D. Introduction Homeless people are more likely than members of the general public to use emergency department (ED) services. Compared with the general population, homeless individuals are 3 times more likely to use an ED at least once in a year.1 Nearly three out of four inpatient stays by homeless individuals began in the ED, compared with half of stays for nonhomeless patients.2 Various factors may contribute to this outcome. Prior research has shown that homeless individuals experience acute physical disorders at 3 to 6 times the rates experienced by nonhomeless individuals.3 It has also been shown that homeless individuals have high rates of mental illness2,4,5,6 and high rates of hospitalization.7 Because of barriers to access to care—such as lack of insurance and transportation—as well as poor continuity of care, homeless people frequently use EDs as their primary or only source of healthcare.8,9 When they do seek medical care, it is usually at teaching hospitals.10 This Healthcare Cost and Utilization Project (HCUP) Statistical Brief presents patient characteristics, insurance coverage, and a clinical profile of ED visits among homeless individuals during 2014 in eight States (Arizona, Florida, Georgia, Maryland, Massachusetts, Missouri, New York, and Wisconsin). Homelessness is directly reported by the hospitals; there is an indicator for each discharge from inpatient hospitals or hospital-affiliated EDs regarding a patient's homelessness status. Data used for this analysis include ED visits that resulted in admission to inpatient care at the same hospital, as well as treat-and-release ED visits that resulted in discharge from the ED, which includes patients who were routinely discharged, who were transferred to another type of healthcare facility, who were discharged against medical advice, or who died in the ED. Homeless individuals' demographic information, expected primary payer, and prevalence of a mental or substance use disorder are summarized for Black, Hispanic, and White individuals by hospital teaching status. Findings Patient characteristics of ED visits among homeless individuals in teaching and nonteaching hospitals, 2014 Table 1 shows variations among ED visits in homeless individuals' age, sex, race/ethnicity, and expected primary payer by type of ED visit and hospital type. |
|
| Table 1. Demographic profile of ED visits by homeless individuals, 2014 | ||||
| Patient characteristic | Treat-and-release ED visits | ED visits resulting in hospital admission | ||
|---|---|---|---|---|
| Teaching hospital | Nonteaching hospital | Teaching hospital | Nonteaching hospital | |
| Total number of ED visitsa | 73,600 | 25,600 | 110,200 | 4,900 |
| Age, % | ||||
| Under 18 | 2.0 | 4.4 | 8.0 | 0.3 |
| 18-29 | 17.5 | 22.3 | 18.4 | 13.8 |
| 30-44 | 28.6 | 27.0 | 22.9 | 23.0 |
| 45-64 | 47.7 | 41.9 | 33.1 | 53.8 |
| 65 and older | 4.2 | 4.4 | 17.6 | 9.1 |
| Sex, % | ||||
| Male | 73.0 | 69.5 | 49.3 | 75.1 |
| Race/ethnicity, % | ||||
| White | 56.0 | 72.1 | 18.1 | 74.5 |
| Black | 24.7 | 12.2 | 35.5 | 14.0 |
| Hispanic | 13.1 | 8.8 | 29.7 | 8.9 |
| Expected primary payer, % | ||||
| Medicare | 15.6 | 11.7 | 21.7 | 21.7 |
| Medicaid | 47.1 | 28.8 | 72.1 | 28.4 |
| Private | 3.9 | 6.7 | 1.7 | 5.6 |
| Uninsured | 28.1 | 49.2 | 3.8 | 41.0 |
| Other | 5.2 | 3.5 | 0.7 | 3.3 |
| Abbreviation: ED, emergency department a Total numbers of ED visits are rounded to the nearest hundred Source: Agency for Healthcare Research and Quality (AHRQ), Center for Delivery, Organization, and Markets, Healthcare Cost and Utilization Project (HCUP), 2014 State Inpatient Databases (SID) and 2014 State Emergency Department Databases (SEDD) from eight States (Arizona, Florida, Georgia, Maryland, Massachusetts, Missouri, New York, and Wisconsin) | ||||
Table 2 presents the clinical profile of ED visits by homeless individuals with a mental or substance use disorder. |
| Table 2. Clinical profile of emergency department visits by homeless individuals with a mental or substance use disorder, 2014 | ||||
| Patient Clinical characteristics | Treat-and-release ED visits | ED visits resulting in hospital admission | ||
|---|---|---|---|---|
| Teaching hospital | Nonteaching hospital | Teaching hospital | Nonteaching hospital | |
| Total number of ED visits with a mental or substance use disorder | 44,700 | 14,900 | 26,100 | 2,100 |
| Subcategories of mental and substance use disorders,a % | ||||
| Adjustment disorders | 0.6 | 0.4 | 1.2 | 1.4 |
| Anxiety disorders | 12.4 | 13.8 | 0.8 | 1.4 |
| Attention deficit, conduct, and disruptive behavior disorders | 1.6 | 1.3 | 0.8 | —b |
| Delirium, dementia, and amnestic and other cognitive disorders | 0.4 | 0.6 | 1.1 | 0.8 |
| Developmental disorders | 1.0 | 0.6 | 0.0 | —b |
| Disorders usually diagnosed in infancy, childhood, or adolescence | 0.2 | 0.1 | 0.2 | —b |
| Impulse control disorders | 0.1 | —b | 0.7 | —b |
| Mood disorders | 25.1 | 22.3 | 25.9 | 38.9 |
| Personality disorders | 0.8 | 0.6 | 0.3 | —b |
| Schizophrenia and other psychotic disorders | 10.1 | 7.0 | 38.4 | 25.7 |
| Alcohol-related disorders | 46.0 | 34.0 | 19.5 | 24.7 |
| Substance-related disorders | 21.9 | 16.8 | 10.3 | 6.1 |
| Suicide and intentional self-inflicted injury | 8.0 | 9.1 | 0.0 | 0.2 |
| Screening and history of mental health and substance abuse | 37.4 | 57.4 | —b | —b |
| Miscellaneous disorders | 0.4 | 0.4 | 0.7 | —b |
| Abbreviation: ED, emergency department Notes: Total numbers of ED visits with a mental or substance use disorder are rounded to the nearest hundred. a Disease categories are based on the Clinical Classification Software (CCS)—a diagnosis and procedure categorization scheme based on the International Classification of Diseases, 9th Revision, Clinical Modification (ICD-9-CM). Percentages in the table are based on principal diagnosis codes at inpatient facilities. The HCUP SEDD do not differentiate between the principal diagnosis codes and other diagnosis codes. Therefore, we used all diagnosis codes reported for each treat-and-release ED visit when creating broader CCS disease categories. b Statistics are not reported whenever there are fewer than 11 observations in a particular cell. Source: Agency for Healthcare Research and Quality (AHRQ), Center for Delivery, Organization, and Markets, Healthcare Cost and Utilization Project (HCUP), 2014 State Inpatient Databases (SID) and 2014 State Emergency Department Databases (SEDD) from eight States (Arizona, Florida, Georgia, Maryland, Massachusetts, Missouri, New York and Wisconsin) | ||||
|
|
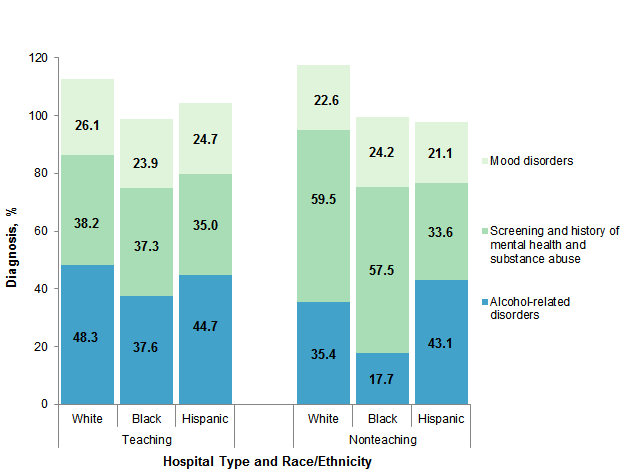
Figure 1. Common mental and substance use disorders among treat-and-release ED visits by homeless individuals, 2014
Note: Disease categories are based on the Clinical Classification Software (CCS)—a diagnosis and procedure categorization scheme based on the International Classification of Diseases, 9th Revision, Clinical Modification. The first-listed diagnosis for treat-and-release ED records may not reflect the principal reason for the visit, as it does for inpatient stays. Therefore, we used all diagnosis codes reported for each treat-and-release ED visit when creating broader CCS disease categories. Thus, the percentages can add to more than 100 percent because a record may have more than one mental health and substance use disorder listed. Bar chart that shows percentage of common mental and substance use disorders among treat-and-release ED visits by homeless individuals in 2014 by race and hospital teaching status. Teaching hospitals: White: alcohol-related disorders 48.3; screening and history of mental health and substance abuse 38.2; mood disorders 26.1; Black: alcohol-related disorders 37.6; screening and history of mental health and substance abuse 37.3; mood disorders 23.9; Hispanic: alcohol-related disorders 44.7; screening and history of mental health and substance abuse 35.0; mood disorders 24.7. Nonteaching hospitals: White: alcohol-related disorders 35.4; screening and history of mental health and substance abuse 59.5; mood disorders 22.6; Black: alcohol-related disorders 17.7; screening and history of mental health and substance abuse 57.5; mood disorders 24.2; Hispanic: alcohol-related disorders 43.1; screening and history of mental health and substance abuse 33.6; mood disorders 21.1.
|
|
|
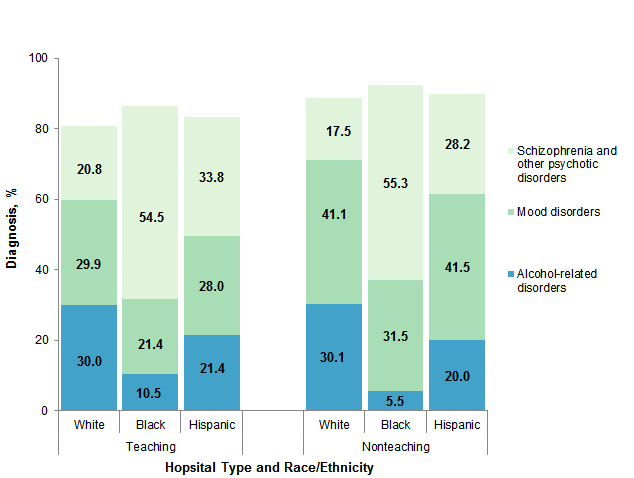
Figure 2. Common mental and substance use disorders among ED visits resulting in hospital admission by homeless individuals, 2014
Note: Disease categories are based on the Clinical Classification Software—a diagnosis and procedure categorization scheme based on the International Classification of Diseases, 9th Revision, Clinical Modification. The percentages are based on principal diagnosis codes on the inpatient record. Bar chart that shows percentage of common mental and substance use disorders among ED visits resulting in hospital admission by homeless individuals in 2014 by race and hospital teaching status. Teaching hospitals: White: alcohol-related disorders 30.0; screening and history of mental health and substance abuse 29.9; mood disorders 20.8; Black: alcohol-related disorders 10.5; screening and history of mental health and substance abuse 21.4; mood disorders 54.5; Hispanic: alcohol-related disorders 21.4; screening and history of mental health and substance abuse 28.0; mood disorders 33.8. Nonteaching hospitals: White: alcohol-related disorders 30.1; screening and history of mental health and substance abuse 41.1; mood disorders 17.5; Black: alcohol-related disorders 5.5; screening and history of mental health and substance abuse 31.5; mood disorders 55.3; Hispanic: alcohol-related disorders 20.0; screening and history of mental health and substance abuse 41.5; mood disorders 28.2.
|
HCUP Statistical Briefs provide basic descriptive statistics on a variety of topics using HCUP administrative healthcare data. Topics include hospital inpatient, ambulatory surgery, and emergency department use and costs, quality of care, access to care, medical conditions, procedures, and patient populations, among other topics. The reports are intended to generate hypotheses that can be further explored in other research; the reports are not designed to answer in-depth research questions using multivariate methods. Data Source The estimates in this Statistical Brief are based upon data from the Healthcare Cost and Utilization Project (HCUP) State Inpatient Databases (SID) and State Emergency Department Databases (SEDD) for 2014. Eight States were included in the analysis: Arizona, Florida, Georgia, Maryland, Massachusetts, Missouri, New York, and Wisconsin. Definitions Diagnoses, ICD-9-CM, and Clinical Classifications Software (CCS) The principal diagnosis is that condition established after study to be chiefly responsible for the patient's admission to the hospital. Secondary diagnoses are concomitant conditions that coexist at the time of admission or develop during the stay. All-listed diagnoses include the principal diagnosis plus these additional secondary conditions. ICD-9-CM is the International Classification of Diseases, Ninth Revision, Clinical Modification, which assigns numeric codes to diagnoses. There are approximately 14,000 ICD-9-CM diagnosis codes. CCS categorizes ICD-9-CM diagnosis codes into a manageable number of clinically meaningful categories.11 This clinical grouper makes it easier to quickly understand patterns of diagnoses. CCS categories identified as Other typically are not reported; these categories include miscellaneous, otherwise unclassifiable diagnoses that may be difficult to interpret as a group. In this analysis, mental and substance use conditions are based on clinical classification of the principal diagnosis for visits that resulted in inpatient stays and are based on all-listed diagnoses for records where the patient was discharged from the emergency department. Case definition Homelessness is directly reported by the hospitals. There is an indicator for each discharge from inpatient hospitals or hospital-affiliated emergency departments regarding the patient's homelessness status. Types of hospitals included in HCUP State Inpatient Databases This analysis used State Inpatient Databases (SID) limited to data from community hospitals, which are defined as short-term, non-Federal, general, and other hospitals, excluding hospital units of other institutions (e.g., prisons). Community hospitals include obstetrics and gynecology, otolaryngology, orthopedic, cancer, pediatric, public, and academic medical hospitals. Excluded for this analysis are long-term care facilities such as rehabilitation, psychiatric, and alcoholism and chemical dependency hospitals. However, if a patient received long-term care, rehabilitation, or treatment for a psychiatric or chemical dependency condition in a community hospital, the discharge record for that stay was included in the analysis. Types of hospitals included in HCUP State Emergency Department Databases This analysis used State Emergency Department Databases (SEDD) limited to data from community hospitals with a hospital-based emergency department. Community hospitals are defined as short-term, non-Federal, general, and other hospitals, excluding hospital units of other institutions (e.g., prisons). Community hospitals include specialty, pediatric, public, and academic medical hospitals. Excluded for this analysis are long-term care facilities such as rehabilitation, psychiatric, and alcoholism and chemical dependency hospitals. Unit of analysis The unit of analysis for inpatient data is the hospital discharge (i.e., the hospital stay), not a person or patient. This means that a person who is admitted to the hospital multiple times in 1 year will be counted each time as a separate discharge from the hospital. Inpatient stays include those admitted through the emergency department (ED). The unit of analysis for ED data is the ED visit, not a person or patient. This means that a person who is seen in the ED multiple times in 1 year will be counted each time as a separate visit in the ED. ED visits exclude those for patients admitted to the hospital, including patients transferred to other hospitals. Payer Payer is the expected payer for the hospital stay. To make coding uniform across all HCUP data sources, payer combines detailed categories into general groups:
Teaching hospitals Teaching hospital status was based on variables provided by American Hospital Association (AHA) Annual Survey, 2014. A hospital is defined as a teaching hospital if one of the following conditions holds:
Data on Hispanic ethnicity are collected differently among the States and also can differ from the census methodology of collecting information on race (White, Black, Asian/Pacific Islander, American Indian/Alaska Native, Other [including mixed race]) separately from ethnicity (Hispanic, non-Hispanic). State data organizations often collect Hispanic ethnicity as one of several categories that include race. Therefore, for multistate analyses, HCUP creates the combined categorization of race and ethnicity for data from States that report ethnicity separately. This Statistical Brief reports race/ethnicity only for the following categories: non-Hispanic White, non-Hispanic Black, and Hispanic. About HCUP The Healthcare Cost and Utilization Project (HCUP, pronounced "H-Cup") is a family of healthcare databases and related software tools and products developed through a Federal-State-Industry partnership and sponsored by the Agency for Healthcare Research and Quality (AHRQ). HCUP databases bring together the data collection efforts of State data organizations, hospital associations, and private data organizations (HCUP Partners) and the Federal government to create a national information resource of encounter-level healthcare data. HCUP includes the largest collection of longitudinal hospital care data in the United States, with all-payer, encounter-level information beginning in 1988. These databases enable research on a broad range of health policy issues, including cost and quality of health services, medical practice patterns, access to healthcare programs, and outcomes of treatments at the national, State, and local market levels. HCUP would not be possible without the contributions of the following data collection Partners from across the United States: Alaska Department of Health and Social Services Alaska State Hospital and Nursing Home Association Arizona Department of Health Services Arkansas Department of Health California Office of Statewide Health Planning and Development Colorado Hospital Association Connecticut Hospital Association District of Columbia Hospital Association Florida Agency for Health Care Administration Georgia Hospital Association Hawaii Health Information Corporation Illinois Department of Public Health Indiana Hospital Association Iowa Hospital Association Kansas Hospital Association Kentucky Cabinet for Health and Family Services Louisiana Department of Health Maine Health Data Organization Maryland Health Services Cost Review Commission Massachusetts Center for Health Information and Analysis Michigan Health & Hospital Association Minnesota Hospital Association Mississippi State Department of Health Missouri Hospital Industry Data Institute Montana Hospital Association Nebraska Hospital Association Nevada Department of Health and Human Services New Hampshire Department of Health & Human Services New Jersey Department of Health New Mexico Department of Health New York State Department of Health North Carolina Department of Health and Human Services North Dakota (data provided by the Minnesota Hospital Association) Ohio Hospital Association Oklahoma State Department of Health Oregon Association of Hospitals and Health Systems Oregon Office of Health Analytics Pennsylvania Health Care Cost Containment Council Rhode Island Department of Health South Carolina Revenue and Fiscal Affairs Office South Dakota Association of Healthcare Organizations Tennessee Hospital Association Texas Department of State Health Services Utah Department of Health Vermont Association of Hospitals and Health Systems Virginia Health Information Washington State Department of Health West Virginia Department of Health and Human Resources, West Virginia Health Care Authority Wisconsin Department of Health Services Wyoming Hospital Association About the SID The HCUP State Inpatient Databases (SID) are hospital inpatient databases from data organizations participating in HCUP. The SID contain the universe of the inpatient discharge abstracts in the participating HCUP States, translated into a uniform format to facilitate multistate comparisons and analyses. Together, the SID encompass more than 95 percent of all U.S. community hospital discharges. The SID can be used to investigate questions unique to one State, to compare data from two or more States, to conduct market-area variation analyses, and to identify State-specific trends in inpatient care utilization, access, charges, and outcomes. About the SEDD The HCUP State Emergency Department Databases (SEDD) include information from hospital-owned emergency departments (EDs) from data organizations participating in HCUP, translated into a uniform format to facilitate multistate comparisons and analyses. The SEDD capture information on ED visits that do not result in an admission to the same hospital (i.e., patients who are treated in the ED and then discharged, transferred to another hospital, left against medical advice, or died). The SEDD contain a core set of clinical and nonclinical information on all patients, including individuals covered by Medicare, Medicaid, or private insurance, as well as those who are uninsured. The SEDD can be used to investigate questions unique to one State, to compare data from two or more States, to conduct market-area variation analyses, and to identify State-specific trends in injury surveillance, emerging infections, and other conditions treated in the ED. About HCUP Fast Stats HCUP Fast Stats (https://datatools.ahrq.gov/hcup-fast-stats) is an interactive, online tool that provides easy access to the quarterly HCUP-based statistics for select State and national health information topics. HCUP Fast Stats uses side-by-side comparisons of visual statistical displays, trend figures, or simple tables to convey complex information at a glance. Topics currently available in HCUP Fast Stats include State Trends in Hospital Use by Payer; National Hospital Utilization and Costs; and Opioid-Related Hospital Use, National and State. HCUP Fast Stats presents statistics using data from HCUP's National (Nationwide) Inpatient Sample (NIS), the Nationwide Emergency Department Sample (NEDS), the State Inpatient Databases (SID), and the State Emergency Department Databases (SEDD). For More Information For more information on hospital utilization among individuals with low income, including homeless individuals, refer to the HCUP Statistical Briefs located at www.hcup-us.ahrq.gov/reports/statbriefs/sb_lowincome.jsp. For additional HCUP statistics, visit:
For a detailed description of HCUP and more information on the design of the State Inpatient Databases (SID) or State Emergency Department Databases (SEDD), please refer to the following database documentation: Agency for Healthcare Research and Quality. Overview of the State Inpatient Databases (SID). Healthcare Cost and Utilization Project (HCUP). Rockville, MD: Agency for Healthcare Research and Quality. Updated June 2016. www.hcup-us.ahrq.gov/sidoverview.jsp. Accessed January 31, 2017. Agency for Healthcare Research and Quality. Overview of the State Emergency Department Databases (SEDD). Healthcare Cost and Utilization Project (HCUP). Rockville, MD: Agency for Healthcare Research and Quality. Updated June 2016. www.hcup-us.ahrq.gov/seddoverview.jsp. Accessed January 31, 2017. Suggested Citation Sun R (AHRQ), Karaca Z (AHRQ), Wong HS (AHRQ). Characteristics of Homeless Individuals Using Emergency Department Services in 2014. HCUP Statistical Brief #229. October 2017. Agency for Healthcare Research and Quality, Rockville, MD. www.hcup-us.ahrq.gov/reports/statbriefs/sb229-Homeless-ED-Visits-2014.pdf. Acknowledgments The authors would like to acknowledge the contributions of Paige Jackson, Katie Fingar, and Audrey Weiss of IBM Watson Health and Chao-Sung Yu and Donna Harradine of Social and Scientific Systems, Inc. *** AHRQ welcomes questions and comments from readers of this publication who are interested in obtaining more information about access, cost, use, financing, and quality of healthcare in the United States. We also invite you to tell us how you are using this Statistical Brief and other HCUP data and tools, and to share suggestions on how HCUP products might be enhanced to further meet your needs. Please e-mail us at hcup@ahrq.gov or send a letter to the address below:Sharon B. Arnold, Ph.D., Acting Director Center for Delivery, Organization, and Markets Agency for Healthcare Research and Quality 5600 Fishers Lane Rockville, MD 20857 This Statistical Brief was posted online on October 17, 2017. 1 Kushel MB, Vittinghoff E, Haas JS. Factors associated with the healthcare utilization of homeless persons. Journal of the American Medical Association. 2001;285(2):200-6. 2 Karaca Z (AHRQ), Wong H (AHRQ), Mutter R (AHRQ). Characteristics of Homeless and Non-Homeless Individuals Using Inpatient and Emergency Department Services, 2008. Statistical Brief #152. March 2013. Agency for Healthcare Research and Quality, Rockville, MD. www.hcup-us.ahrq.gov/reports/statbriefs/sb152.pdf. Accessed August 8, 2017. 3 Wright JD. Poor people, poor health: the health status of the homeless. Journal of Social Issues. 1990;46(4):49-64. 4 Wright NM, Tompkins CN. How can health services effectively meet the health needs of homeless people? British Journal of General Practice. 2006;56(525):286-93. 5 Bassuk EL, Buckner JC, Perloff JN, Bassuk SS. Prevalence of mental health and substance use disorders among homeless and low-income housed mothers. American Journal of Psychiatry. 1998;155(11):1561-4. 6 Sadowski LS, Kee RA, VanderWeele TJ, Buchanan D. Effect of a housing and case management program on emergency department visits and hospitalizations among chronically ill homeless adults: a randomized trial. Journal of the American Medical Association. 2009;301(17):1771-8. 7 Martell JV, Seitz RS, Harada JK, Kobayashi J, Sasaki VK, Wong C. Hospitalization in an urban homeless population: the Honolulu Urban Homeless Project. Annals of Internal Medicine. 1992;116(4):299-303. 8 Kushel MB, Perry S, Bangsberg D, Clark R, Moss AR. Emergency department use among the homeless and marginally housed: results from a community-based study. American Journal of Public Health. 2002 May;92(5):778-84. 9 Morris DM, Gordon JA. The role of the emergency department in the care of homeless and disadvantaged populations. Emergency Medicine Clinics of North America. 2006;24(4):839-48. 10 Bowdler JE, Barrell LM. Health needs of homeless persons. Public Health Nursing. 1987;4(3):135-40. 11 Agency for Healthcare Research and Quality. HCUP Clinical Classifications Software (CCS) for ICD-9-CM. Healthcare Cost and Utilization Project (HCUP). Rockville, MD: Agency for Healthcare Research and Quality. Updated October 2016. www.hcup-us.ahrq.gov/toolssoftware/ccs/ccs.jsp. Accessed January 31, 2017 |
| Internet Citation: Statistical Brief #229. Healthcare Cost and Utilization Project (HCUP). October 2017. Agency for Healthcare Research and Quality, Rockville, MD. hcup-us.ahrq.gov/reports/statbriefs/sb229-Homeless-ED-Visits-2014.jsp. |
| Are you having problems viewing or printing pages on this website? |
| If you have comments, suggestions, and/or questions, please contact hcup@ahrq.gov. |
| If you are experiencing issues related to Section 508 accessibility of information on this website, please contact hcup@ahrq.gov. |
| Privacy Notice, Viewers & Players |
| Last modified 10/13/17 |