STATISTICAL BRIEF #231 |
November 2017
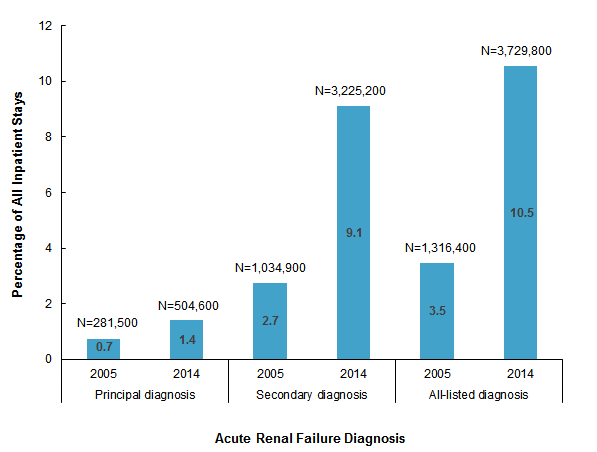
Brian J. Moore, Ph.D., and Celeste M. Torio, Ph.D., M.P.H. Introduction Acute renal failure or acute kidney injury is defined as an abrupt decrease in kidney function to the point that the body accumulates waste products and becomes unable to maintain electrolyte, acid-base, and water balance.1 It can occur when there is impaired blood flow to the kidneys, damage to the kidneys, or urine blockage in the kidneys.2 It is an increasingly common complication among patients hospitalized for acute illness.3 It has been associated with increased long-term risk of poor outcomes, including reduced health-related quality of life, increased incidence of chronic kidney disease, accelerated progression to end-stage renal disease, and mortality.3,4,5 These poor outcomes result in greater utilization of healthcare resources and increased healthcare costs.3,4 In 2014, acute renal failure was in the top 20 most frequent primary reasons for hospitalization.6 Among the most common reasons for inpatient stays, acute renal failure had the largest increase in the population rate of stays (346 percent) between 1997 and 2011.7 In 2013, acute renal failure was one of the 20 most expensive conditions billed to Medicare.8 This Healthcare Cost and Utilization Project (HCUP) Statistical Brief presents data on hospital inpatient stays with a diagnosis of acute renal failure from 2005 to 2014. The 10-year trend in stays involving acute renal failure diagnosis is provided. We also present rates of stays with a diagnosis of acute renal failure per 100,000 population by patient characteristics in both 2005 and 2014. The distribution of stays and costs by payer in 2014 are presented. We present statistics for the most frequent principal diagnoses and all-listed procedures during stays with an all-listed diagnosis of acute renal failure. Finally, we compare the mean cost per stay by principal diagnosis for stays with and without an all-listed acute renal failure diagnosis. Findings Trends in inpatient stays for acute renal failure, 2005-2014 Figure 1 presents the number of inpatient stays with a diagnosis of acute renal failure and the percentage of all inpatient stays in 2005 and 2014. |
|
|
Figure 1. Number and percentage of inpatient stays with a diagnosis of acute renal failure, 2005 and 2014
Notes: Diagnoses were identified using the Clinical Classifications Software (CCS). Number of stays are rounded to the nearest 100. Bar chart that shows the number and percentage of all inpatient stays with a principal, secondary, or all-listed diagnosis of acute renal failure in 2005 and 2014. Principal diagnosis—2005: 0.7%, N=281,500; 2014: 1.4%, N=504,600. Secondary diagnosis—2005: 2.7%; N=1,034,900; 2014: 9.1%, N=3,225,200. All-listed diagnosis—2005: 3.5%, N=1,316,400; 2014: 10.5%, N=3,729,800.
|
|
|
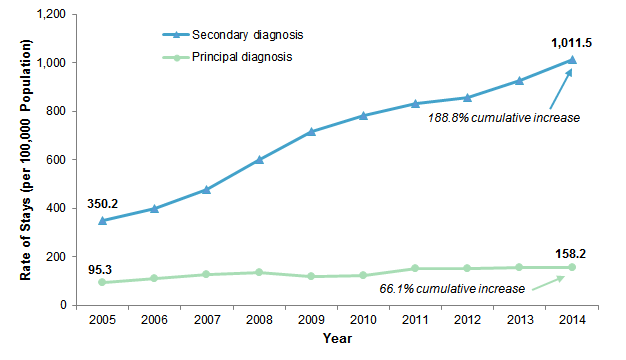
Figure 2. Population rate of inpatient stays with a diagnosis of acute renal failure, 2005-2014
Note: Diagnoses were identified using the Clinical Classifications Software (CCS). Line graph that shows the rate of inpatient stays with a diagnosis of acute renal failure per 100,000 population from 2005 to 2014. Secondary diagnosis of acute renal failure—2005: 350.2; 2006: 399.9; 2007: 475.6; 2008: 599.5; 2009: 715.2; 2010: 781.7; 2011: 831.9; 2012: 856.5; 2013: 927.5; 2014: 1011.5; 188.8% cumulative increase. Principal diagnosis of acute renal failure—2005: 95.3; 2006: 109.9; 2007: 128.1; 2008: 134.0; 2009: 118.8; 2010: 124.8; 2011: 153.3; 2012: 153.5; 2013: 157.2; 2014: 158.2; 66.1% cumulative increase.
|
Table 1 presents the rate of inpatient stays with either a principal diagnosis or an all-listed diagnosis of acute renal failure by select patient characteristics in both 2005 and 2014, along with the percent change in the rate of stays between those years. All-listed diagnoses include records with a principal diagnosis of acute renal failure as well as those in which acute renal failure is listed as a secondary diagnosis. |
| Table 1. Rate of inpatient stays with an acute renal failure diagnosis per 100,000 population, by select characteristics, 2005 and 2014 | ||||||
| Characteristic | Principal diagnosis | All-listed diagnoses | ||||
|---|---|---|---|---|---|---|
| 2005 | 2014 | Percent change | 2005 | 2014 | Percent change | |
| Age group, years | ||||||
| <1 | 3.8 | 4.7 | 22.8 | 123.3 | 159.2 | 29.1 |
| 0-17 | 2.6 | 2.9 | 8.2 | 13.1 | 22.1 | 68.8 |
| 18-44 | 19.6 | 33.2 | 69.6 | 94.2 | 263.5 | 179.7 |
| 45-64 | 91.9 | 164.4 | 78.9 | 448.6 | 1,269.7 | 183.0 |
| 65-84 | 430.8 | 580.5 | 34.7 | 2,002.2 | 4,238.6 | 111.7 |
| 85+ | 1,121.8 | 1,525.4 | 36.0 | 4,870.4 | 10,449.9 | 114.6 |
| Sex | ||||||
| Male | 97.8 | 162.6 | 66.2 | 475.0 | 1,270.3 | 167.4 |
| Female | 92.7 | 154.0 | 66.0 | 416.8 | 1,072.0 | 157.2 |
| Community-level income | ||||||
| Low (first quartile) | 111.6 | 207.5 | 86.0 | 516.5 | 1,469.2 | 184.4 |
| Not low (upper three quartiles) | 87.4 | 138.8 | 58.9 | 410.0 | 1,047.7 | 155.5 |
| Region | ||||||
| Northeast | 99.9 | 156.9 | 57.0 | 474.2 | 1,176.3 | 148.1 |
| Midwest | 96.0 | 172.0 | 79.1 | 440.7 | 1,270.5 | 188.3 |
| South | 109.5 | 182.2 | 66.4 | 493.1 | 1,276.0 | 158.8 |
| West | 68.2 | 108.6 | 59.3 | 351.5 | 904.9 | 157.4 |
| Source: Agency for Healthcare Research and Quality (AHRQ), Center for Delivery, Organization, and Markets, Healthcare Cost and Utilization Project (HCUP), National (Nationwide) Inpatient Sample (NIS), 2005 and 2014 | ||||||
|
|
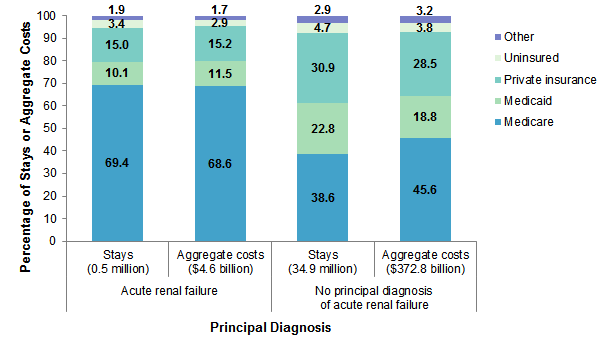
Figure 3. Distribution of stays and aggregate costs by expected payer for stays with and without a principal acute renal failure diagnosis, 2014
Source: Agency for Healthcare Research and Quality (AHRQ), Center for Delivery, Organization, and Markets, Healthcare Cost and Utilization Project (HCUP), National Inpatient Sample (NIS), 2014 Bar chart that shows the percentage of stays and aggregate costs with and without principal acute renal failure diagnosis by expected payer in 2014. Stays for acute renal failure (total stays=0.5 million)—Medicare: 69.4%; Medicaid: 10.1%; private insurance: 15.0%; uninsured: 3.4%; other: 1.9%. Aggregate costs for stays with acute renal failure diagnosis (total=$4.6 billion)—Medicare: 68.6%; Medicaid: 11.5%; private insurance: 15.2%; uninsured: 2.9%; other: 1.7%. Stays with no principal diagnosis of acute renal failure (total stays=34.9 million): Medicare: 38.6%; Medicaid: 22.8%; private insurance: 30.9%; uninsured: 4.7%; other: 2.9%. Aggregate costs for stays with no principal diagnosis of acute renal failure (total=$372.8 billion)—Medicare: 45.6%; Medicaid: 18.8%; private insurance: 28.5%; uninsured: 3.8%; other: 3.2%.
|
Table 2 presents the principal diagnoses most frequently listed for hospital inpatient stays with an all-listed diagnosis of acute renal failure in 2005 and 2014. The percentage of total all-listed acute renal failure stays with each principal diagnosis and the average cost per stay are also presented for both years. Diagnoses are ordered by their ranking in 2014. |
| Table 2. Most frequent principal diagnoses for inpatient stays with an all-listed acute renal failure diagnosis, 2005 and 2014 | |||||||
| CCS principal diagnosis category | 2005 | 2014 | Percent change in number of stays | ||||
|---|---|---|---|---|---|---|---|
| Rank | Number of stays | Total acute renal failure stays, % | Rank | Number of stays | Total acute renal failure stays, % | ||
| Septicemia | 2 | 126,600 | 9.6 | 1 | 590,800 | 15.8 | 366.7 |
| Acute and unspecified renal failure | 1 | 281,500 | 21.4 | 2 | 504,600 | 13.5 | 79.3 |
| Congestive heart failure; nonhypertensive | 3 | 91,200 | 6.9 | 3 | 230,700 | 6.2 | 153.0 |
| Diabetes mellitus with complications | 7 | 32,000 | 2.4 | 4 | 129,400 | 3.5 | 304.4 |
| Pneumonia | 4 | 56,900 | 4.3 | 5 | 113,600 | 3.0 | 99.6 |
| Acute myocardial infarction | 5 | 54,200 | 4.1 | 6 | 105,300 | 2.8 | 94.3 |
| Complication of device; implant or graft | 8 | 27,200 | 2.1 | 7 | 90,800 | 2.4 | 233.8 |
| Respiratory failure; insufficiency; arrest | 6 | 42,400 | 3.2 | 8 | 88,200 | 2.4 | 108.0 |
| Urinary tract infections | - | - | - | 9 | 77,100 | 2.1 | n/a |
| Cardiac dysrhythmias | - | - | - | 10 | 76,500 | 2.1 | n/a |
| Fluid and electrolyte disorders | 9 | 26,100 | 2.0 | - | - | - | n/a |
| Coronary atherosclerosis and other heart disease | 10 | 24,300 | 1.8 | - | - | - | n/a |
| Total in top 10 | - | 762,400 | 57.9 | - | 2,007,000 | 53.8 | 163.2 |
| Total for all stays | - | 1,316,400 | 100.0 | - | 3,729,800 | 100.0 | 183.3 |
| Abbreviations: CCS, Clinical Classifications Software; n/a, not applicable Notes: Diagnoses were identified using the Clinical Classifications Software (CCS). Number of stays are rounded to the nearest 100. Source: Agency for Healthcare Research and Quality (AHRQ), Center for Delivery, Organization, and Markets, Healthcare Cost and Utilization Project (HCUP), National (Nationwide) Inpatient Sample (NIS), 2005 and 2014 | |||||||
|
|
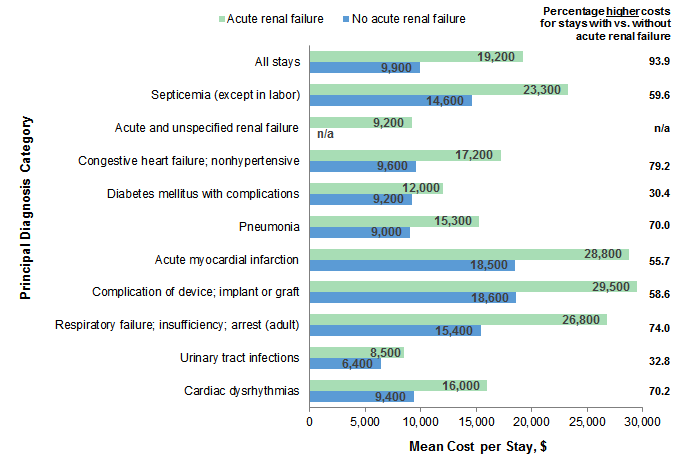
Figure 4. Mean costs per hospital stay for stays with and without an all-listed acute renal failure diagnosis, by principal diagnosis, 2014
Abbreviation: n/a, not applicable Bar chart that shows mean costs per hospital stay for stays with and without an all-listed acute renal failure diagnosis by principal diagnosis category in 2014. All stays—acute renal failure: $19,200; no acute renal failure: $9,900; % higher costs for stays with versus without acute renal failure: 93.9%. Septicemia (except in labor)—acute renal failure: $23,300; no acute renal failure: $14,600; % higher costs for stays with versus without acute renal failure: 59.6%. Acute and unspecified renal failure—acute renal failure: $9,200; no acute renal failure: not applicable. Congestive heart failure; nonhypertensive—acute renal failure: $17,200; no acute renal failure: $9,600; % higher costs for stays with versus without acute renal failure: 79.2%. Diabetes mellitus with complications—acute renal failure: $12,000; no acute renal failure: $9,200; % higher costs for stays with versus without acute renal failure: 30.4%. Pneumonia—acute renal failure: $15,300; no acute renal failure: $9,000; % higher costs for stays with versus without acute renal failure: 70.0%. Acute myocardial infarction—acute renal failure: $28,800; no acute renal failure: $18,500; % higher costs for stays with versus without acute renal failure: 55.7%. Complication of device, implant or graft—acute renal failure: $29,500; no acute renal failure: $18,600; % higher costs for stays with versus without acute renal failure: 58.6%. Respiratory failure; insufficiency; arrest (adult)—acute renal failure: $26,800; no acute renal failure: 15,400; % higher costs for stays with versus without acute renal failure: 74.0%. Urinary tract infections—acute renal failure: $8,500; no acute renal failure: $6,400; % higher costs for stays with versus without acute renal failure: 32.8%. Cardiac dysrhythmias—acute renal failure: $16,000; no acute renal failure: $9,400; % higher costs for stays with versus without acute renal failure: 70.2%.
|
|
| Table 3. Most frequent all-listed procedures for inpatient stays with an acute renal failure diagnosis, 2014 | ||||
| CCS all-listed procedure category | Rank | Number of stays | Total acute renal failure stays with this procedure, % | All stays with this procedure, % |
|---|---|---|---|---|
| Blood transfusion | 1 | 586,100 | 26.0 | 6.4 |
| Respiratory intubation and mechanical ventilation | 2 | 556,700 | 24.7 | 5.0 |
| Upper gastrointestinal endoscopy; biopsy | 3 | 212,100 | 9.4 | 3.1 |
| Hemodialysis | 4 | 186,800 | 8.3 | 2.3 |
| Diagnostic ultrasound of heart (echocardiogram) | 5 | 178,900 | 7.9 | 2.4 |
| Diagnostic cardiac catheterization; coronary arteriography | 6 | 167,700 | 7.4 | 3.1 |
| Incision of pleura; thoracentesis; chest drainage | 7 | 117,300 | 5.2 | 1.3 |
| Enteral and parenteral nutrition | 8 | 113,800 | 5.1 | 1.5 |
| Diagnostic bronchoscopy and biopsy of bronchus | 9 | 96,400 | 4.3 | 1.1 |
| Abdominal paracentesis | 10 | 89,100 | 4.0 | 0.8 |
| Abbreviations: CCS, Clinical Classifications Software Notes: Procedures are identified using the Clinical Classifications Software (CCS) based on all-listed procedures. Not all inpatient stays include a procedure. A single hospitalization could contribute to more than one row in the table if more than one procedure occurred during the inpatient stay. Number of stays are rounded to the nearest 100. Source: Agency for Healthcare Research and Quality (AHRQ), Center for Delivery, Organization, and Markets, Healthcare Cost and Utilization Project (HCUP), National Inpatient Sample (NIS), 2014 | ||||
HCUP Statistical Briefs provide basic descriptive statistics on a variety of topics using HCUP administrative healthcare data. Topics include hospital inpatient, ambulatory surgery, and emergency department use and costs, quality of care, access to care, medical conditions, procedures, and patient populations, among other topics. The reports are intended to generate hypotheses that can be further explored in other research; the reports are not designed to answer in-depth research questions using multivariate methods. Data Source The estimates in this Statistical Brief are based upon data from the Healthcare Cost and Utilization Project (HCUP) 2014 National Inpatient Sample (NIS). Historical data were drawn from the 2005-2013 National (Nationwide) Inpatient Sample (NIS). Supplemental sources included population denominator data for use with HCUP databases, derived from information available from the U.S. Census Bureau9 and Claritas, a vendor that compiles and adds values to data from the U.S. Census Bureau.10 Definitions Diagnoses, procedures, ICD-9-CM, and Clinical Classifications Software (CCS) The principal diagnosis is that condition established after study to be chiefly responsible for the patient's admission to the hospital. Secondary diagnoses are concomitant conditions that coexist at the time of admission or develop during the stay. All-listed diagnoses include the principal diagnosis plus these additional secondary conditions. All-listed procedures include all procedures performed during the hospital stay, whether for definitive treatment or for diagnostic or exploratory purposes. The first-listed procedure is the procedure that is listed first on the discharge record. Inpatient data define this as the principal procedure—the procedure that is performed for definitive treatment rather than for diagnostic or exploratory purposes (i.e., the procedure that was necessary to take care of a complication). ICD-9-CM is the International Classification of Diseases, Ninth Revision, Clinical Modification, which assigns numeric codes to diagnoses and procedures. There are approximately 14,000 ICD-9-CM diagnosis codes and 4,000 ICD-9-CM procedure codes. CCS categorizes ICD-9-CM diagnosis codes and procedure codes into a manageable number of clinically meaningful categories.11 This clinical grouper makes it easier to quickly understand patterns of diagnoses and procedure use. CCS categories identified as Other typically are not reported; these categories include miscellaneous, otherwise unclassifiable diagnoses and procedures that may be difficult to interpret as a group. Case definition For this report, acute renal failure diagnoses were defined as CCS diagnosis category 157, acute and unspecified renal failure. Diagnoses of chronic renal failure were excluded. CCS 157 includes ICD-9-CM codes 584.5 (acute kidney failure with lesion of tubular necrosis), 584.6 (acute renal failure with lesion of renal cortical necrosis), 584.7 (acute renal failure with lesion of renal medullary [papillary] necrosis), 584.8 (acute renal failure with other specified pathological lesion in kidney), 584.9 (acute renal failure, unspecified), and 586 (renal failure, unspecified). The Centers for Medicare & Medicaid Services (CMS) implemented Medicare Severity Diagnosis Related Groups (MS-DRGs) in fiscal year 2008. The change to MS-DRGs included a major overhaul to the complications and comorbidity (CC) system to revise which ICD-9-CM codes qualified for CC and major CC status. We conducted several alternate analyses to examine whether this change in CMS rules affected the number of hospital inpatient stays with a secondary diagnosis of acute renal failure. There was no sudden increase in the number of acute kidney disease stays with the shift to MS-DRGs—the trend followed the same pattern of increase before and after 2008. We did not observe notable differences in the pattern of our results when the analysis focused only on discharges for patients aged 18-64 years. Medicare covers costs for end stage renal disease for patients of all ages, but acute kidney disease would not fall under Medicare reimbursement for patients aged 65 years or younger. Types of hospitals included in the HCUP National (Nationwide) Inpatient Sample The National (Nationwide) Inpatient Sample (NIS) is based on data from community hospitals, which are defined as short-term, non-Federal, general, and other hospitals, excluding hospital units of other institutions (e.g., prisons). The NIS includes obstetrics and gynecology, otolaryngology, orthopedic, cancer, pediatric, public, and academic medical hospitals. Excluded are long-term care facilities such as rehabilitation, psychiatric, and alcoholism and chemical dependency hospitals. Beginning in 2012, long-term acute care hospitals are also excluded. However, if a patient received long-term care, rehabilitation, or treatment for a psychiatric or chemical dependency condition in a community hospital, the discharge record for that stay will be included in the NIS. Unit of analysis The unit of analysis is the hospital discharge (i.e., the hospital stay), not a person or patient. This means that a person who is admitted to the hospital multiple times in 1 year will be counted each time as a separate discharge from the hospital. Costs and charges Total hospital charges were converted to costs using HCUP Cost-to-Charge Ratios based on hospital accounting reports from the Centers for Medicare & Medicaid Services (CMS).12 Costs reflect the actual expenses incurred in the production of hospital services, such as wages, supplies, and utility costs; charges represent the amount a hospital billed for the case. For each hospital, a hospital-wide cost-to-charge ratio is used. Hospital charges reflect the amount the hospital billed for the entire hospital stay and do not include professional (physician) fees. For the purposes of this Statistical Brief, costs are reported to the nearest hundred. How HCUP estimates of costs differ from National Health Expenditure Accounts There are a number of differences between the costs cited in this Statistical Brief and spending as measured in the National Health Expenditure Accounts (NHEA), which are produced annually by CMS.13 The largest source of difference comes from the HCUP coverage of inpatient treatment only in contrast to the NHEA inclusion of outpatient costs associated with emergency departments and other hospital-based outpatient clinics and departments as well. The outpatient portion of hospitals' activities has been growing steadily and may exceed half of all hospital revenue in recent years. On the basis of the American Hospital Association Annual Survey, 2012 outpatient gross revenues (or charges) were about 44 percent of total hospital gross revenues.14 Smaller sources of differences come from the inclusion in the NHEA of hospitals that are excluded from HCUP. These include Federal hospitals (Department of Defense, Veterans Administration, Indian Health Services, and Department of Justice [prison] hospitals) as well as psychiatric, substance abuse, and long-term care hospitals. A third source of difference lies in the HCUP reliance on billed charges from hospitals to payers, adjusted to provide estimates of costs using hospital-wide cost-to-charge ratios, in contrast to the NHEA measurement of spending or revenue. HCUP costs estimate the amount of money required to produce hospital services, including expenses for wages, salaries, and benefits paid to staff as well as utilities, maintenance, and other similar expenses required to run a hospital. NHEA spending or revenue measures the amount of income received by the hospital for treatment and other services provided, including payments by insurers, patients, or government programs. The difference between revenues and costs include profit for for-profit hospitals or surpluses for nonprofit hospitals. Community-level income Community-level income is based on the median household income of the patient's ZIP Code of residence. Quartiles are defined so that the total U.S. population is evenly distributed. Cut-offs for the quartiles are determined annually using ZIP Code demographic data obtained from Claritas, a vendor that adds value to data from the U.S. Census Bureau.15 Patients in the first quartile are designated as having low income, and patients in the upper three quartiles are designated as having not low income. The income quartile is missing for patients who are homeless or foreign. Payer Payer is the expected payer for the hospital stay. To make coding uniform across all HCUP data sources, payer combines detailed categories into general groups:
For this Statistical Brief, when more than one payer is listed for a hospital discharge, the first-listed payer is used. Region Region is one of the four regions defined by the U.S. Census Bureau:
About HCUP The Healthcare Cost and Utilization Project (HCUP, pronounced "H-Cup") is a family of healthcare databases and related software tools and products developed through a Federal-State-Industry partnership and sponsored by the Agency for Healthcare Research and Quality (AHRQ). HCUP databases bring together the data collection efforts of State data organizations, hospital associations, and private data organizations (HCUP Partners) and the Federal government to create a national information resource of encounter-level healthcare data. HCUP includes the largest collection of longitudinal hospital care data in the United States, with all-payer, encounter-level information beginning in 1988. These databases enable research on a broad range of health policy issues, including cost and quality of health services, medical practice patterns, access to healthcare programs, and outcomes of treatments at the national, State, and local market levels. HCUP would not be possible without the contributions of the following data collection Partners from across the United States: Alaska Department of Health and Social Services Alaska State Hospital and Nursing Home Association Arizona Department of Health Services Arkansas Department of Health California Office of Statewide Health Planning and Development Colorado Hospital Association Connecticut Hospital Association District of Columbia Hospital Association Florida Agency for Health Care Administration Georgia Hospital Association Hawaii Health Information Corporation Illinois Department of Public Health Indiana Hospital Association Iowa Hospital Association Kansas Hospital Association Kentucky Cabinet for Health and Family Services Louisiana Department of Health Maine Health Data Organization Maryland Health Services Cost Review Commission Massachusetts Center for Health Information and Analysis Michigan Health & Hospital Association Minnesota Hospital Association Mississippi State Department of Health Missouri Hospital Industry Data Institute Montana Hospital Association Nebraska Hospital Association Nevada Department of Health and Human Services New Hampshire Department of Health & Human Services New Jersey Department of Health New Mexico Department of Health New York State Department of Health North Carolina Department of Health and Human Services North Dakota (data provided by the Minnesota Hospital Association) Ohio Hospital Association Oklahoma State Department of Health Oregon Association of Hospitals and Health Systems Oregon Office of Health Analytics Pennsylvania Health Care Cost Containment Council Rhode Island Department of Health South Carolina Revenue and Fiscal Affairs Office South Dakota Association of Healthcare Organizations Tennessee Hospital Association Texas Department of State Health Services Utah Department of Health Vermont Association of Hospitals and Health Systems Virginia Health Information Washington State Department of Health West Virginia Department of Health and Human Resources, West Virginia Health Care Authority Wisconsin Department of Health Services Wyoming Hospital Association About the NIS The HCUP National (Nationwide) Inpatient Sample (NIS) is a nationwide database of hospital inpatient stays. The NIS is nationally representative of all community hospitals (i.e., short-term, non-Federal, nonrehabilitation hospitals). The NIS includes all payers. It is drawn from a sampling frame that contains hospitals comprising more than 95 percent of all discharges in the United States. The vast size of the NIS allows the study of topics at the national and regional levels for specific subgroups of patients. In addition, NIS data are standardized across years to facilitate ease of use. Over time, the sampling frame for the NIS has changed; thus, the number of States contributing to the NIS varies from year to year. The NIS is intended for national estimates only; no State-level estimates can be produced. The 2012 NIS was redesigned to optimize national estimates. The redesign incorporates two critical changes:
For More Information For other information on urinary and renal conditions, refer to the HCUP Statistical Briefs located at www.hcup-us.ahrq.gov/reports/statbriefs/sb_urinary.jsp. For additional HCUP statistics, visit:
For a detailed description of HCUP and more information on the design of the National (Nationwide) Inpatient Sample (NIS), please refer to the following database documentation: Agency for Healthcare Research and Quality. Overview of the National (Nationwide) Inpatient Sample (NIS). Healthcare Cost and Utilization Project (HCUP). Rockville, MD: Agency for Healthcare Research and Quality. Updated December 2016. www.hcup-us.ahrq.gov/nisoverview.jsp. Accessed January 31, 2017. Suggested Citation Moore BJ (IBM Watson Health), Torio CM (AHRQ). Acute Renal Failure Hospitalizations, 2005-2014. HCUP Statistical Brief #231. November 2017. Agency for Healthcare Research and Quality, Rockville, MD. www.hcup-us.ahrq.gov/reports/statbriefs/sb231-Acute-Renal-Failure-Hospitalizations.pdf. Acknowledgments The authors would like to acknowledge the contributions of Minya Sheng and Kimberly McDermott of IBM Watson Health. *** AHRQ welcomes questions and comments from readers of this publication who are interested in obtaining more information about access, cost, use, financing, and quality of healthcare in the United States. We also invite you to tell us how you are using this Statistical Brief and other HCUP data and tools, and to share suggestions on how HCUP products might be enhanced to further meet your needs. Please e-mail us at hcup@ahrq.gov or send a letter to the address below:Sharon B. Arnold, Ph.D., Acting Director Center for Delivery, Organization, and Markets Agency for Healthcare Research and Quality 5600 Fishers Lane Rockville, MD 20857 This Statistical Brief was posted online on November 14, 2017. 1 Makris K, Spanou L. Acute kidney injury: definition, pathophysiology and clinical phenotypes. Clinical Biochemist Reviews. 2016;37(2):85-98. 2 Mayo Clinic. Diseases and conditions: acute kidney failure. www.mayoclinic.org/diseases-conditions/kidney-failure/basics/causes/con-20024029. 3 Koza Y. Acute kidney injury: current concepts and new insights. Journal of Injury and Violence Research. 2016;8(1):58-62. 4 Rewa O, Bagshaw SM. Acute kidney injury: epidemiology, outcomes and economics. Nature Reviews Nephrology. 2014;10:193-207. 5 Mehta RL, Ceraé J, Burdmann EA, Tonelli M, Garcia-Garcia G, Jha V, et al. International Society of Nephrology's 0by25 initiative for acute kidney injury (zero preventable deaths by 2025): a human rights case for nephrology. The Lancet. 2015;385(9987):2616-2643. 6 HCUPnet. Healthcare Cost and Utilization Project (HCUP). 2014. Agency for Healthcare Research and Quality, Rockville, MD. datatools.ahrq.gov/hcupnet. Accessed August 8, 2017. 7 Pfuntner A, Wier LM, Stocks C. Most Frequent Conditions in U.S. Hospitals, 2011. HCUP Statistical Brief #162. September 2013. Agency for Healthcare Research and Quality, Rockville, MD. www.hcup-us.ahrq.gov/reports/statbriefs/sb162.pdf. 8 Torio CM, Moore BJ. National Inpatient Hospital Costs: The Most Expensive Conditions by Payer, 2013. HCUP Statistical Brief #204. May 2016. Agency for Healthcare Research and Quality, Rockville, MD. 9 Barrett M, McCarty J, Coffey R, Levit K. Population Denominator Data for Use with the HCUP Databases (Updated with 2015 Population Data). HCUP Methods Series Report #2016-04. September 29, 2016. U.S. Agency for Healthcare Research and Quality. www.hcup-us.ahrq.gov/reports/methods/2016-04.pdf. Accessed July 5, 2017. 10 Claritas. Claritas Demographic Profile. www.claritas.com. 11 Agency for Healthcare Research and Quality. HCUP Clinical Classifications Software (CCS) for ICD-9-CM. Healthcare Cost and Utilization Project (HCUP). Rockville, MD: Agency for Healthcare Research and Quality. Updated October 2016. www.hcup-us.ahrq.gov/toolssoftware/ccs/ccs.jsp. Accessed January 31, 2017. 12 Agency for Healthcare Research and Quality. HCUP Cost-to-Charge Ratio (CCR) Files. Healthcare Cost and Utilization Project (HCUP). 2001-2014. Rockville, MD: Agency for Healthcare Research and Quality. Updated November 2016. www.hcup-us.ahrq.gov/db/state/costtocharge.jsp. Accessed January 31, 2017. 13 For additional information about the NHEA, see Centers for Medicare & Medicaid Services (CMS). National Health Expenditure Data. CMS website May 2014. www.cms.gov/Research-Statistics-Data-and-Systems/Statistics-Trends-and-Reports/NationalHealthExpendData/index.html?redirect=/NationalHealthExpendData/. Accessed January 31, 2017. 14 American Hospital Association. TrendWatch Chartbook, 2014. Table 4.2. Distribution of Inpatient vs. Outpatient Revenues, 1992-2012. https://www.aha.org/system/files/research/reports/tw/chartbook/2016/appendix4.pdf. 15 Claritas. Claritas Demographic Profile. www.claritas.com. |
| Internet Citation: Statistical Brief #231. Healthcare Cost and Utilization Project (HCUP). April 2018. Agency for Healthcare Research and Quality, Rockville, MD. www.hcup-us.ahrq.gov/reports/statbriefs/sb231-Acute-Renal-Failure-Hospitalizations.jsp?utm_source=ahrq&utm_medium=en21&utm_term=&utm_content=21&utm_campaign=ahrq_en11_14_2017. |
| Are you having problems viewing or printing pages on this website? |
| If you have comments, suggestions, and/or questions, please contact hcup@ahrq.gov. |
| Privacy Notice, Viewers & Players |
| Last modified 4/18/18 |