HEALTHCARE COST & UTILIZATION PROJECT

User Support

Do Your own analysis
Explore Expert Research & Limited Datasets
STATISTICAL BRIEF #232


December 2017


Characteristics of Inpatient Stays Involving Hepatitis C, 2005-2014


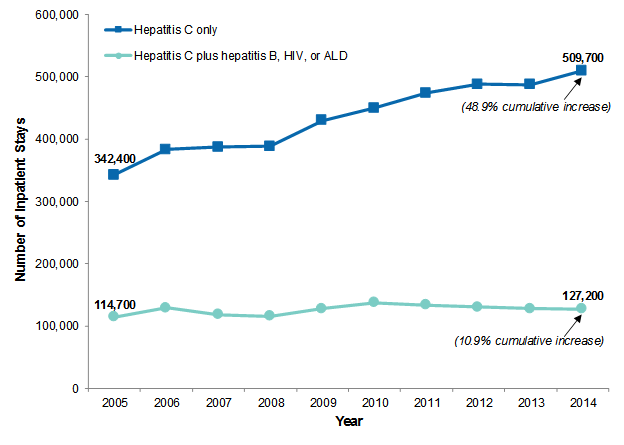
Quyen Ngo-Metzger, M.D., M.P.H., Iris Mabry-Hernandez, M.D., Kevin C. Heslin, Ph.D., Audrey J. Weiss, Ph.D., Amanda Mummert, Ph.D., and Arlene S. Bierman, M.D., M.S.


Introduction

Hepatitis C virus is the most common chronic blood-borne pathogen in the United States.1 The number of people in the United States with hepatitis C is estimated at 4.6 million, of whom an estimated 3.2 million are chronically infected.2,3,4 Based on data from 1999 to 2008, about three-fourths of individuals in the United States now living with hepatitis C were born between 1945 and 1965 (baby boomers), with a prevalence of 3.3 percent.5 The most important risk factor for hepatitis C is current or past injection drug use.6

Acute hepatitis C cases nearly tripled from 2010 through 2015, likely the result of increasing injection drug use due to the growing opioid epidemic.7,8 People with hepatitis C can have a mild, short-term illness. However, 75-85 percent of those who become infected with hepatitis C develop a chronic infection that can result in cirrhosis, liver failure, hepatocellular carcinoma (liver cancer), and death.9 Factors associated with the progression of liver disease in people with chronic hepatitis C include coinfection with hepatitis B virus, coinfection with human immunodeficiency virus (HIV), and high levels of alcohol intake.10 Chronic hepatitis C virus is the most common indication for liver transplants among U.S. adults.11

Mortality rates from hepatitis C have been increasing. From 1999 to 2007, the average annual age-adjusted mortality rate involving hepatitis C increased by 0.18 deaths per 100,000 population.12 The rate of hospitalizations associated with hepatitis C also has increased significantly, from 4.8 per 100,000 population in 2004-2005 to 13.8 per 100,000 population in 2010-2011 (a 190-percent increase).13

This Healthcare Cost and Utilization Project (HCUP) Statistical Brief presents data for adults aged 18 years and older on hepatitis C-related inpatient stays, including those among patients with and without key co-occurring diagnoses: hepatitis B, HIV, and alcoholic liver disease (ALD). Trends in the number and population rate of hepatitis C-related inpatient stays from 2005 through 2014 are provided. Characteristics of hepatitis C-related inpatient stays in 2014 are presented by patient age group and by presence or absence of the key codiagnoses. Because hepatitis C is so prevalent among baby boomers, characteristics and codiagnoses of hepatitis C-related stays are further detailed specifically for this age group. Finally, the rate of hepatitis C-related inpatient stays in 2014 is depicted by U.S. census division for each patient age group. Differences in estimates of 10 percent or greater are noted in the text.

Findings

Trends in hepatitis C-related inpatient stays, 2005-2014
Figure 1 presents trends in the number of inpatient stays involving hepatitis C—with and without hepatitis B, human immunodeficiency virus (HIV), or alcoholic liver disease (ALD)—among adults aged 18 years and older from 2005 through 2014.
Highlights
  • In 2014, there were 636,900 adult hospitalizations involving hepatitis C. Stays involving hepatitis C only—without co-occurring hepatitis B, human immunodeficiency virus (HIV), or alcoholic liver disease (ALD)—increased 48.9 percent between 2005 and 2014.


  • Average costs, length of stay, and the proportion of in-hospital deaths in 2014 were all higher for stays involving hepatitis C than for stays without hepatitis C.


  • Black patients and those with Medicaid as the expected payer constituted a higher proportion of stays involving hepatitis C than stays without hepatitis C.


  • Baby boomers (patients aged 52-72 years) had the highest rate of inpatient stays involving hepatitis C in 2014: 503.1 per 100,000 population versus 155.4 for younger patients and 117.1 for older patients.


  • The following are comparisons to the national average rate of hepatitis C-related inpatient stays in 2014:
    • The Middle Atlantic division had higher rates across all age groups.
    • The Mountain and East North Central divisions had lower rates across all age groups.
    • The West South Central division had higher rates for baby boomers but lower rates for younger and older patients.
    • The New England and East South Central divisions had higher rates for younger patients and lower rates for older patients; the opposite was true in the Pacific division.


Figure 1. Number of inpatient stays involving hepatitis C among adults aged 18+ years, 2005-2014

Figure 1 is a line graph illustrating the number of inpatient stays involving hepatitis C only or hepatitis C plus hepatitis B, human immunodeficiency virus, or alcoholic liver disease among adults aged 18 or older from 2005 to 2014.

Abbreviations: ALD, alcoholic liver disease; HIV, human immunodeficiency virus
Note: Number of stays is rounded to the nearest 100.
Source: Agency for Healthcare Research and Quality (AHRQ), Center for Delivery, Organization, and Markets, Healthcare Cost and Utilization Project (HCUP), National (Nationwide) Inpatient Sample (NIS), 2005-2014

Line graph that shows the number of inpatient stays involving hepatitis C only or hepatitis C plus hepatitis B, human immunodeficiency virus, or alcoholic liver disease among adults aged 18+ years from 2005 to 2014. Hepatitis C only—2005: 342,400; 2006: 382,900; 2007: 386,800; 2008: 388,400; 2009: 429,600; 2010: 449,300; 2011, 473,900; 2012, 487,800; 2013, 487,100; 2014: 509,700; cumulative increase: 48.9%. Hepatitis C plus hepatitis B, human immunodeficiency virus, or alcoholic liver disease—2005: 114,700; 2006: 128,900; 2007: 118,000; 2008: 115,600; 2009: 128,100; 2010: 137,200; 2011, 133,700; 2012, 130,100; 2013, 128,200; 2014: 127,200; cumulative increase: 10.9%.


  • From 2005 to 2014, stays involving hepatitis C without hepatitis B, HIV, or ALD (hepatitis C only) were 3 to 4 times more common than stays involving hepatitis C plus hepatitis B, HIV, or ALD (hepatitis C-plus).

    From 2005 to 2014, stays involving hepatitis C only were 3 to 4 times more common than stays involving hepatitis C-plus (342,400 vs. 114,700 stays in 2005; 509,700 vs. 127,200 stays in 2014).


  • The number of stays involving hepatitis C only increased faster between 2005 and 2014 than the number of stays involving hepatitis C plus hepatitis B, HIV, or ALD.

    Between 2005 and 2014, the number of stays involving hepatitis C only increased 48.9 percent, whereas the number of stays involving hepatitis C-plus increased 10.9 percent.
Figure 2 presents trends in the population rate of all inpatient stays involving hepatitis C by adult patient age group from 2005 through 2014 (stays with and without co-occurring hepatitis B, HIV, or ALD are grouped together).


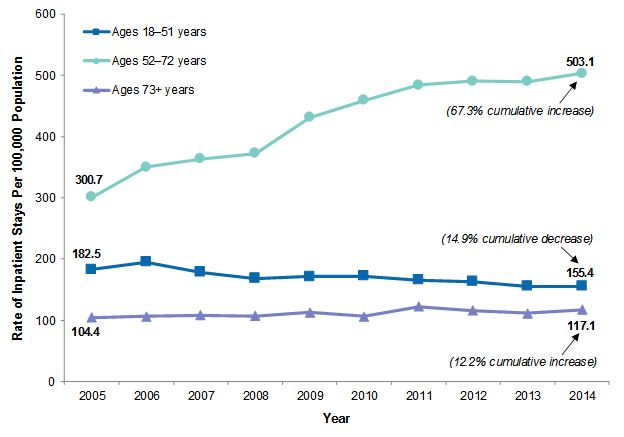
Figure 2. Rate of inpatient stays involving hepatitis C by patient age group, 2005-2014

Figure 2 is a line graph illustrating the rate of inpatient stays involving hepatitis C per 100,000 population by age from 2005 to 2014.

Note: All stays involving hepatitis C are included—those stays with and without hepatitis B, human immunodeficiency virus (HIV), and alcoholic liver disease.
Source: Agency for Healthcare Research and Quality (AHRQ), Center for Delivery, Organization, and Markets, Healthcare Cost and Utilization Project (HCUP), National (Nationwide) Inpatient Sample (NIS), 2005-2014

Line graph showing the rate of inpatient stays involving hepatitis C per 100,000 population by age from 2005 to 2014. Ages 18-51 years—2005: 182.5; 2006: 195.1; 2007: 178.3; 2008: 168.0; 2009: 171.4; 2010: 172.2; 2011: 165.4; 2012: 163.1; 2013: 155.6; 2014: 155.4; cumulative decrease: 14.9%. Ages 52-72 years—2005: 300.7; 2006: 349.8; 2007: 363.2; 2008: 372.2; 2009: 430.7; 2010: 458.8; 2011: 484.0; 2012: 490.2; 2013: 489.4; 2014: 503.1; cumulative increase: 67.3%. Ages 73+ years—2005: 104.4; 2006: 106.0; 2007: 108.1; 2008: 106.9; 2009: 112.9; 2010: 106.2; 2011: 122.0; 2012: 115.5; 2013: 111.2; 2014: 117.1; cumulative increase: 12.2%.


  • Patients aged 52-72 years (baby boomers) had the highest rate of inpatient stays involving hepatitis C between 2005 and 2014.

    In 2014, the rate of stays involving hepatitis C was highest for patients aged 52-72 years (503.1 per 100,000 population), followed by patients aged 18-51 years (155.4 per 100,000) and patients aged 73 years and older (117.1 per 100,000).


  • The rate of stays involving hepatitis C increased substantially among baby boomers between 2005 and 2014.

    The rate of stays involving hepatitis C increased the most between 2005 and 2014 among patients aged 52-72 years (67.3 percent cumulative increase), followed by patients aged 73 years and older (12.2 percent increase). In contrast, the rate of stays involving hepatitis C decreased by 14.9 percent among patients aged 18-51 years over the same 10-year period.
Characteristics of hepatitis C-related inpatient stays, 2014
Table 1 presents utilization and patient characteristics for all inpatient stays involving hepatitis C by patient age group in 2014. Characteristics of adult inpatients stays that do not involve hepatitis C are provided for comparison.


Table 1. Characteristics of inpatient stays involving hepatitis C by patient age group, 2014
Characteristic Hepatitis C No hepatitis C
18-51 years 52-72 years 73+ years All adults 18+ years All adults 18+ years
Number of stays 225,900 383,200 27,800 636,900 29,115,100
Rate of stays (per 100,000 population) 155.4 503.1 117.1 259.7 11,870.5
Utilization characteristics
Cost per stay, mean $ 11,000 14,600 14,500 13,300 11,600
Length of stay, mean days 5.5 6.0 6.1 5.8 4.7
Died during hospital stay, % 1.5 3.5 5.3 2.9 2.2
Patient characteristics
Sex, %
Male 54.7 66.5 47.9 61.5 40.7
Female 45.3 33.5 52.1 38.5 59.3
Race/ethnicity, %
White 67.1 54.5 52.7 58.9 65.0
Black 11.4 26.5 21.4 20.9 13.9
Hispanic 12.1 10.9 12.5 11.4 10.1
Other 4.6 4.5 10.1 4.7 5.9
Expected primary payer, %
Medicare 17.6 41.3 90.0 35.0 46.6
Medicaid 52.9 32.0 2.8 38.1 17.4
Private insurance 12.3 17.1 5.2 14.9 28.4
Uninsured 13.0 5.4 0.5 7.9 4.7
Other 3.8 3.9 1.4 3.8 2.8
Community-level income, %
Low income (<$40,000) 40.9 40.1 30.4 40.0 28.8
Not low income ($40,000+) 59.1 59.9 69.6 60.0 71.2
Location, %
Large central metropolitan 31.4 40.1 47.0 37.3 29.5
Large fringe metropolitan 20.6 19.8 22.4 20.2 24.0
Medium metropolitan 20.9 19.5 15.7 19.8 20.1
Small metropolitan 8.6 7.6 6.3 7.9 9.3
Micropolitan 9.1 6.6 4.7 7.4 9.4
Noncore (rural) 6.9 4.3 3.4 5.2 7.2
Notes: All stays involving hepatitis C are included—those stays with and without hepatitis B, human immunodeficiency virus (HIV), and alcoholic liver disease. Number of stays and cost per stay are rounded to the nearest 100. Location is missing for approximately 2.2 percent of stays with hepatitis C and 0.5 percent of stays without hepatitis C.
Source: Agency for Healthcare Research and Quality (AHRQ), Center for Delivery, Organization, and Markets, Healthcare Cost and Utilization Project (HCUP), National Inpatient Sample (NIS), 2014


  • Average costs, length of stay, and the proportion of in-hospital deaths in 2014 were all higher for stays involving hepatitis C than stays without hepatitis C.

    Compared with stays that did not involve hepatitis C, stays involving hepatitis C were, on average:
    • Higher cost ($13,300 vs. $11,600)
    • Longer (5.8 vs. 4.7 days)
    • More likely to result in death in the hospital (2.9 vs. 2.2 percent of stays)


  • Males constituted a higher proportion of stays involving hepatitis C than stays without hepatitis C.

    Males represented 61.5 percent of all stays involving hepatitis C compared with only 40.7 percent of stays without hepatitis C. Males constituted the highest proportion of hepatitis C-related stays among baby boomers (66.5 percent) and the lowest proportion among those aged 73 years and older (47.9 percent).


  • Black patients and those with Medicaid as the expected payer constituted a higher proportion of stays involving hepatitis C than stays without hepatitis C.

    Black patients represented 20.9 percent of stays with hepatitis C compared with 13.9 percent of stays without hepatitis C. Black patients constituted the highest proportion of hepatitis C-related stays among baby boomers (26.5 percent) and the lowest proportion among those aged 18-51 years (11.4 percent).

    Patients with Medicaid as the expected payer represented 38.1 percent of stays with hepatitis C compared with only 17.4 percent of stays without hepatitis C. Among patients aged 18-51 years, more than half of stays involving hepatitis C had Medicaid as the expected payer (52.9 percent).


  • Patients residing in low-income areas and large central metropolitan areas constituted a higher proportion of stays involving hepatitis C than stays without hepatitis C.

    Patients residing in low-income areas represented 40.0 percent of stays with hepatitis C compared with 28.8 percent of stays without hepatitis C. This was driven by patients in the two younger age groups (18-51 years and 52-72 years) for whom those in low-income areas constituted more than 40 percent of hepatitis C-related stays. In contrast, among patients aged 73 years and older, those in low-income areas constituted only 30.4 percent of hepatitis C-related stays—similar to the proportion of stays without hepatitis C across all adults (28.8 percent).

    Patients residing in large central metropolitan areas represented 37.3 percent of stays with hepatitis C compared with 29.5 percent of stays without hepatitis C. As patient age increased, a larger proportion of hepatitis C-related stays were among those residing in large central metropolitan areas (ages 18-51 years: 31.4 percent; ages 52-72 years: 40.1 percent; ages 73+ years: 47.0 percent).
Table 2 presents the proportion of inpatient stays involving hepatitis C with select co-occurring diagnoses, procedures, and comorbidities by patient age group in 2014. The proportions for adult inpatient stays that do not involve hepatitis C are provided for comparison.


Table 2. Co-occurring diagnoses, procedures, and comorbidities associated with inpatient stays involving hepatitis C by patient age group, 2014
Diagnosis, procedure, or comorbidity Hepatitis C No hepatitis C
18-51 years 52-72 years 73+ years All adults 18+ years All adults 18+ years
Diagnosis, %
Hepatitis C (principal diagnosis) 3.7 6.3 5.0 5.3 -
Hepatitis B 3.4 3.2 2.4 3.3 0.2
HIV 7.1 6.1 1.3 6.2 0.6
Alcoholic liver disease (ALD) 9.1 13.6 3.3 11.5 1.1
Liver cancer 1.0 6.2 8.3 4.5 1.1
Cirrhosis of the liver 9.7 23.8 29.6 19.1 0.8
Ascites 7.2 14.7 12.7 12.0 1.2
Upper GI bleeding 4.5 7.1 7.1 6.2 2.3
Any mental disorder 78.4 69.7 42.4 71.6 44.3
Any nonalcohol SUD 53.5 24.9 4.8 34.2 5.7
Any alcohol-related diagnosis (not ALD) 26.8 26.9 6.3 26.0 5.7
Procedure, %
Abdominal paracentesis 4.1 8.8 6.7 7.0 0.9
Upper GI endoscopy 4.8 7.3 7.5 6.4 3.6
Comorbidity, %
Hypertension 30.1 58.3 71.9 48.9 49.8
Fluid and electrolyte disorders 26.8 37.2 40.2 33.7 24.6
Drug abuse 44.8 22.1 4.2 29.4 4.6
Chronic pulmonary disease 19.5 29.2 26.4 25.6 18.7
Deficiency anemias 17.3 25.7 31.7 22.9 17.5
Alcohol abuse 20.5 23.3 5.8 21.5 4.6
Diabetes, uncomplicated 11.0 23.4 28.6 19.2 18.9
Coagulopathy 13.3 22.0 22.7 19.0 4.9
Depression 15.8 16.0 10.8 15.7 11.3
Renal failure 6.9 18.5 32.1 15.0 12.6
Psychoses 17.2 11.8 4.5 13.4 4.8
Other neurological disorders 9.7 9.1 10.1 9.4 7.6
Obesity 8.4 10.0 6.4 9.3 13.4
Congestive heart failure 3.7 10.5 20.2 8.5 8.9
Hypothyroidism 5.1 8.7 19.2 7.9 11.9
Weight loss 5.1 9.2 11.2 7.8 4.9
Diabetes with chronic complications 3.6 7.8 8.2 6.3 5.1
Peripheral vascular disorders 1.7 6.5 11.5 5.0 6.1
Abbreviations: GI, gastrointestinal; HIV, human immunodeficiency virus; SUD, substance use disorder
Note: All stays involving hepatitis C are included—those stays with and without hepatitis B, HIV, and ALD.
Source: Agency for Healthcare Research and Quality (AHRQ), Center for Delivery, Organization, and Markets, Healthcare Cost and Utilization Project (HCUP), National Inpatient Sample (NIS), 2014


  • Hepatitis B, HIV, alcoholic liver disease (ALD), liver cancer, and cirrhosis of the liver were among the codiagnoses in 2014 that were more common among stays involving hepatitis C than among those without hepatitis C.

    Several liver-related conditions were more common among stays involving hepatitis C than among stays without hepatitis C. Cirrhosis of the liver, HIV, and hepatitis B were codiagnoses in less than 1 percent of stays without hepatitis C but in 19.1 percent, 6.2 percent, and 3.3 percent, respectively, of stays involving hepatitis C. Ascites (accumulation of fluid in the abdomen), ALD, and liver cancer were codiagnoses in 1.1-1.2 percent of stays without hepatitis C but in 12.0 percent, 11.5 percent, and 4.5 percent, respectively, of stays involving hepatitis C. Upper gastrointestinal (GI) bleeding was a codiagnosis in 2.3 percent of stays without hepatitis C compared with 6.2 percent of stays with hepatitis C.


  • Mental and substance use disorders were more common codiagnoses for stays involving hepatitis C than for stays without hepatitis C.

    Any mental disorder and any nonalcohol substance use disorder were more common codiagnoses among stays involving hepatitis C (71.6 percent and 34.2 percent, respectively) than stays without hepatitis C (44.3 percent and 5.7 percent, respectively). Among hepatitis C-related stays for patients aged 18-51 years, a mental disorder codiagnosis was present in over three-fourths of stays (78.4 percent) and a nonalcohol substance use disorder codiagnosis was present in over half of stays (53.5 percent). As patient age increased, a smaller proportion of hepatitis C-related stays involved a mental disorder or nonalcohol substance use disorder codiagnosis.

    Any alcohol-related diagnosis (not ALD) occurred among 26.0 percent of stays with hepatitis C versus 5.7 percent of stays without hepatitis C. This was driven by patients in the two younger age groups (18-51 years and 52-72 years) for whom an alcohol-related codiagnosis constituted more than 26 percent of hepatitis C-related stays. In contrast, among patients aged 73 years and older, only 6.3 percent of hepatitis C-related stays involved an alcohol-related codiagnosis.


  • Abdominal paracentesis and upper GI endoscopy were more common during stays involving hepatitis C than during stays without hepatitis C.

    Abdominal paracentesis (removal of fluid through the stomach) was performed during 7.0 percent of stays with hepatitis C versus 0.9 percent of stays without hepatitis C. Upper GI endoscopy was performed during 6.4 percent of stays with hepatitis C versus 3.6 percent of stays without hepatitis C.


  • Drug abuse, alcohol abuse, coagulopathy, and psychoses were among the comorbidities that were more common during stays involving hepatitis C than during stays without hepatitis C.

    Drug abuse was a comorbidity among 29.4 percent of stays with hepatitis C versus 4.6 percent of stays without hepatitis C. Alcohol abuse was a comorbidity among 21.5 percent of stays with hepatitis C versus 4.6 percent of stays without hepatitis C. Coagulopathy (impairment of the blood's ability to clot) was a comorbidity among 19.0 percent of stays with hepatitis C versus 4.9 percent of stays without hepatitis C. Psychoses was a comorbidity among 13.4 percent of stays with hepatitis C versus 4.8 percent of stays without hepatitis C.
Because hepatitis C-related stays occurred among patients aged 52-72 years (baby boomers) at 3 to 4 times the rate that they occurred among younger and older individuals, Tables 3 and 4 provide a more detailed examination of the characteristics and codiagnoses of hepatitis C-related stays specifically among baby boomers. In particular, hepatitis C-related stays among baby boomers are described separately for stays with and without the co-occurring diagnoses of hepatitis B, HIV, or ALD. Similar to Tables 1 and 2, hepatitis C-related stays are compared with those stays without hepatitis C; for Tables 3 and 4 this comparison group is limited to stays among baby boomers.

Table 3 presents utilization and patient characteristics among baby boomers for hepatitis C-related inpatient stays with and without hepatitis B, HIV, or ALD. Characteristics of inpatient stays that do not involve hepatitis C among baby boomers are provided for comparison.


Table 3. Characteristics of inpatient stays involving hepatitis C among baby boomers, 2014
Characteristic Ages 52-72 years (baby boomers)
Hepatitis C without hepatitis B, HIV, or ALD Hepatitis C plus hepatitis B, HIV, or ALD No hepatitis C
Number of stays 300,000 83,300 10,282,100
Percentage of all baby boomer stays 2.8 0.8 96.4
Rate of stays (per 100,000 population) 393.8 109.3 13,498.2
Utilization characteristics
Cost per stay, mean $ 14,500 15,000 14,100
Length of stay, mean days 5.9 6.4 5.1
Died during hospital stay, % 3.1 5.1 2.2
Patient characteristics
Sex, %
Male 64.6 73.6 50.2
Female 35.4 26.4 49.8
Race/ethnicity, %
White 55.7 50.1 68.2
Black 26.1 27.9 14.0
Hispanic 10.1 13.6 7.9
Other 4.4 4.7 4.9
Expected primary payer, %
Medicare 42.6 36.4 50.2
Medicaid 29.8 39.7 11.6
Private insurance 18.0 13.9 31.0
Uninsured 5.2 6.4 3.9
Other 4.1 3.5 3.1
Community-level income, %
Low income (<$40,000) 40.0 40.4 29.6
Not low income ($40,000+) 60.0 59.6 70.4
Location, %
Large central metropolitan 40.2 39.7 28.1
Large fringe metropolitan 20.5 17.4 23.8
Medium metropolitan 19.7 18.7 20.2
Small metropolitan 7.8 7.2 9.6
Micropolitan 6.7 6.1 10.0
Noncore (rural) 4.4 3.8 7.9
Abbreviations: ALD, alcoholic liver disease; HIV, human immunodeficiency virus
Notes: Number of stays and cost per stay are rounded to the nearest 100. Location is missing for approximately 0.7 percent of stays with hepatitis C only, 7.1 percent of stays with hepatitis C-plus, and 0.4 percent of stays without hepatitis C.
Source: Agency for Healthcare Research and Quality (AHRQ), Center for Delivery, Organization, and Markets, Healthcare Cost and Utilization Project (HCUP), National Inpatient Sample (NIS), 2014


  • Stays involving hepatitis C constituted approximately 3.6 percent of all inpatient stays among baby boomers in 2014.

    Approximately 3.6 percent of all inpatient stays among baby boomers in 2014 involved hepatitis C: 2.8 percent of stays involved hepatitis C without hepatitis B, HIV, or ALD (hepatitis C only), and 0.8 percent of stays involved hepatitis C plus hepatitis B, HIV, or ALD (hepatitis C-plus)


  • Among baby boomers, average length of stay and the proportion of in-hospital deaths were higher for stays involving hepatitis C only than for stays without hepatitis C.

    The length of stay was 16 percent longer for stays involving hepatitis C only than for stays without hepatitis C (5.9 vs. 5.1 days). Length of stay was longest for hepatitis C-plus stays at 6.4 days.

    The proportion of in-hospital deaths was 41 percent higher for stays involving hepatitis C only than for stays without hepatitis C (3.1 vs. 2.2 percent). The proportion of in-hospital deaths was highest for hepatitis C-plus stays at 5.1 percent.


  • Males constituted a higher proportion of stays involving hepatitis C only than stays without hepatitis C among baby boomers.

    Among baby boomers, males represented 64.6 percent of stays involving hepatitis C only compared with 50.2 percent of stays without hepatitis C. Males constituted the highest proportion among hepatitis C-plus stays at 73.6 percent.


  • Among baby boomers, Black and Hispanic patients and those with Medicaid as the expected payer constituted a higher proportion of stays involving hepatitis C only than stays without hepatitis C.

    Among baby boomers, Black patients represented 26.1 percent of stays involving hepatitis C only compared with 14.0 percent of stays without hepatitis C. Hispanic patients represented 10.1 percent of stays involving hepatitis C only compared with 7.9 percent of stays without hepatitis C.

    Patients with Medicaid as the expected payer represented 29.8 percent of stays involving hepatitis C only compared with 11.6 percent of stays without hepatitis C. Patients with Medicaid constituted the highest proportion among hepatitis C-plus stays at 39.7 percent.
Table 4 presents the proportion of inpatient stays involving hepatitis C—with and without hepatitis B, HIV, or ALD—with select co-occurring diagnoses, procedures, and comorbidities among baby boomers. The proportions for inpatient stays that did not involve hepatitis C among baby boomers are provided for comparison.


Table 4. Co-occurring diagnoses, procedures, and comorbidities associated with inpatient stays involving hepatitis C among baby boomers, 2014
Diagnosis, procedure, or comorbidity Ages 52-72 years (baby boomers)
Hepatitis C without hepatitis B, HIV, or ALD Hepatitis C plus hepatitis B, HIV, or ALD No hepatitis C
Diagnosis, %
Hepatitis C (principal diagnosis) 5.4 9.7 -
Hepatitis B - 14.8 0.2
HIV - 28.0 0.6
Alcoholic liver disease (ALD) - 62.4 1.6
Liver cancer 5.8 7.7 1.7
Cirrhosis of the liver 27.6 10.2 1.3
Ascites 11.1 27.7 1.8
Upper GI bleeding 5.5 13.1 2.6
Any mental disorder 69.8 69.5 53.4
Any nonalcohol SUD 24.3 27.2 4.5
Any alcohol-related diagnosis (not ALD) 18.0 59.0 7.3
Procedure, %
Abdominal paracentesis 6.4 17.6 1.3
Upper GI endoscopy 6.2 11.1 4.1
Comorbidity, %
Hypertension 60.4 50.8 63.3
Fluid and electrolyte disorders 35.4 44.0 27.8
Drug abuse 21.4 24.5 3.6
Chronic pulmonary disease 29.6 27.5 23.5
Deficiency anemias 24.6 29.6 18.2
Alcohol abuse 14.8 53.7 6.1
Diabetes, uncomplicated 24.4 19.6 25.8
Coagulopathy 18.6 34.3 5.6
Depression 16.3 14.9 14.1
Renal failure 18.7 17.6 13.7
Psychoses 11.9 11.5 5.7
Other neurological disorders 9.2 9.0 7.7
Obesity 10.9 6.7 18.5
Congestive heart failure 10.9 9.0 9.4
Hypothyroidism 9.4 6.3 12.7
Weight loss 8.3 12.5 5.7
Diabetes with chronic complications 8.5 5.1 7.4
Peripheral vascular disorders 7.1 4.4 7.4
Abbreviations: GI, gastrointestinal; HIV, human immunodeficiency virus; SUD, substance use disorder
Source: Agency for Healthcare Research and Quality (AHRQ), Center for Delivery, Organization, and Markets, Healthcare Cost and Utilization Project (HCUP), National Inpatient Sample (NIS), 2014


  • Among baby boomers in 2014, liver cancer, cirrhosis of the liver, ascites, and upper GI bleeding were more common among stays involving hepatitis C only than among stays without hepatitis C.

    Several liver-related conditions were more common for baby boomers among stays involving hepatitis C only than among stays without hepatitis C. Liver cancer was a codiagnosis among 5.8 percent of stays involving hepatitis C only versus 1.7 percent of stays without hepatitis C. Liver cancer was most common among hepatitis C-plus stays at 7.7 percent.

    Cirrhosis of the liver was more common among stays involving hepatitis C only than among stays without hepatitis C (27.6 percent vs. 1.3 percent). Cirrhosis of the liver was also more common among hepatitis C-plus stays than among stays without hepatitis C (10.2 percent) but less common than among hepatitis C-only stays.

    Ascites was a codiagnosis among 11.1 percent of stays involving hepatitis C versus 1.8 percent of stays without hepatitis C. Ascites was most common among hepatitis C-plus stays at 27.7 percent.

    Upper GI bleeding was a codiagnosis among 5.5 percent of stays involving hepatitis C only versus 2.6 percent of stays without hepatitis C. Upper GI bleeding was most common among hepatitis C-plus stays at 13.1 percent.


  • Mental and substance use disorders were more common among stays involving hepatitis C only than among stays without hepatitis C.

    Any mental disorder was a codiagnosis among 69.8 percent of stays with hepatitis C only versus 53.4 percent of stays without hepatitis C. Any nonalcohol substance use disorder was a codiagnosis among 24.3 percent of stays with hepatitis C only versus 4.5 percent of stays without hepatitis C. Any alcohol-related diagnosis (not ALD) was a codiagnosis among 18.0 percent of stays with hepatitis C only versus 7.3 percent of stays without hepatitis C. Alcohol-related codiagnoses were most common among hepatitis C-plus stays at 59.0 percent.


  • Abdominal paracentesis and upper GI endoscopy were more common among stays involving hepatitis C only than among stays without hepatitis C.

    Abdominal paracentesis was performed during 6.4 percent of stays involving hepatitis C only versus 1.3 percent of stays without hepatitis C. Abdominal paracentesis was most common among hepatitis C-plus stays at 17.6 percent. Upper GI endoscopy was performed during 6.2 percent of stays involving hepatitis C only versus 4.1 percent of stays without hepatitis C. Upper GI endoscopy was most common among hepatitis C-plus stays at 11.1 percent.


  • Drug abuse, alcohol abuse, coagulopathy, and psychoses were among the comorbidities more common among stays involving hepatitis C only than those without hepatitis C.

    Drug abuse was a comorbidity among 21.4 percent of stays with hepatitis C only versus 3.6 percent of stays without hepatitis C. Drug abuse was most common among hepatitis C-plus stays at 24.5 percent. Alcohol abuse was a comorbidity among 14.8 percent of stays with hepatitis C only versus 6.1 percent of stays without hepatitis C. Alcohol abuse was most common among hepatitis C-plus stays at 53.7 percent.

    Coagulopathy was a comorbidity among 18.6 percent of stays with hepatitis C only versus 5.6 percent of stays without hepatitis C. Coagulopathy was most common among hepatitis C-plus stays at 34.3 percent. Psychoses was a comorbidity among 11.9 percent of stays with hepatitis C only versus 5.7 percent of stays without hepatitis C.
Regional variation in hepatitis C-related inpatient stays, 2014
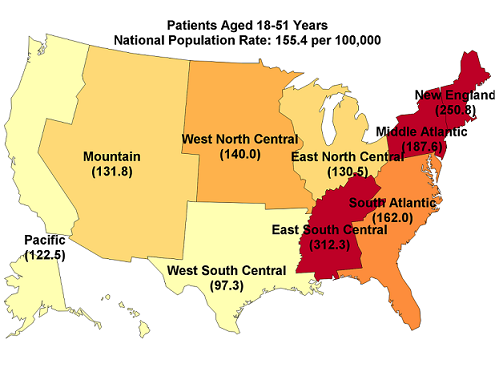
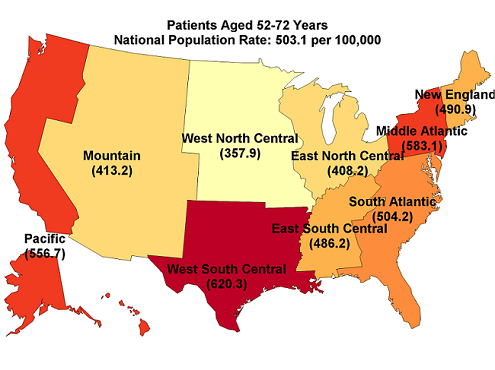
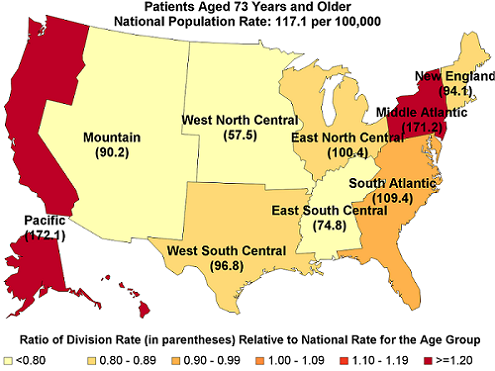
Figure 3 provides the population rate of inpatient stays involving hepatitis C among patients aged 18-51 years, aged 52-72 years, and aged 73+ years by U.S. census division in 2014. The ratio of the census division rate to the national rate for each age group also is provided.


Figure 3. Rate of inpatient stays involving hepatitis C among patients aged 18-51 years, 52-72 years, and 73+ years by census division, and ratio of census division rate to national rate, 2014

Figure 3 is three United States maps that illustrate the rate of inpatient stays per 100,000 population by age and by census division and the ratio of the census division rate to the national rate in 2014.


  • New England: The rate ranged from 61 percent higher than the national average among younger patients to 20 percent lower than the national average among older patients.


  • Middle Atlantic: The rate was 16 to 46 percent higher than the national average across all patient age groups.


  • South Atlantic: The rate was about at the national average across all patient age groups.


  • East North Central:The rate was 14 to 19 percent lower than the national average across all patient age groups.


  • East South Central: The rate ranged from more than double the national average among younger patients to 36 percent lower than the national average among older patients.


  • West North Central: The rate was similar to the national average among younger patients but lower than the national average among baby boomers (29 percent) and older patients (51 percent).


  • West South Central: The rate was 23 percent higher than the national average among baby boomers but lower than the national average among younger patients (37 percent) and among older patients (17 percent).


  • Mountain: The rate was 15 to 23 percent lower than the national average across all patient age groups.


  • Pacific: The rate was 21 percent lower than the national average among younger patients but higher than the national average among baby boomers (11 percent) and older patients (47 percent).

Notes: Rate is per 100,000 population. All stays involving hepatitis C are included—those stays with and without hepatitis B, human immunodeficiency virus (HIV), and alcoholic liver disease.
Source: Agency for Healthcare Research and Quality (AHRQ), Center for Delivery, Organization, and Markets, Healthcare Cost and Utilization Project (HCUP), National Inpatient Sample (NIS), 2014

Three U.S. maps that show the rate of inpatient stays per 100,000 population by age and by census division and the ratio of the census division rate to the national rate in 2014. Patients aged 18-51 years (national population rate: 155.4): Pacific: 122.5; Mountain: 131.8; West North Central: 140.0; West South Central: 97.3; East North Central: 130.5; East South Central: 312.3; New England: 250.8; Middle Atlantic: 187.6; South Atlantic: 162.0. Patients aged 52-72 years (national population rate: 503.1): Pacific: 556.7; Mountain: 413.2; West North Central: 357.9; West South Central: 620.3; East North Central: 408.2; East South Central: 486.2; New England: 490.9; Middle Atlantic: 583.1; South Atlantic: 504.2. Patients aged 73+ years (national population rate: 117.1): Pacific: 172.1; Mountain: 90.2; West North Central: 57.5; West South Central: 96.8; East North Central: 100.4; East South Central: 74.8; New England: 94.1; Middle Atlantic: 171.2; South Atlantic: 109.4.


About Statistical Briefs

HCUP Statistical Briefs provide basic descriptive statistics on a variety of topics using HCUP administrative healthcare data. Topics include hospital inpatient, ambulatory surgery, and emergency department use and costs, quality of care, access to care, medical conditions, procedures, and patient populations, among other topics. The reports are intended to generate hypotheses that can be further explored in other research; the reports are not designed to answer in-depth research questions using multivariate methods.

Data Source

The estimates in this Statistical Brief are based upon data from the Healthcare Cost and Utilization Project (HCUP) 2014 National Inpatient Sample (NIS). Historical data were drawn from the 2005-2013 National (Nationwide) Inpatient Sample (NIS). Supplemental sources include population denominators based on data available from the U.S. Census Bureau.14

Definitions

Diagnoses, procedures, ICD-9-CM, Clinical Classifications Software (CCS), and Elixhauser Comorbidity Software
The principal diagnosis is that condition established after study to be chiefly responsible for the patient's admission to the hospital. Secondary diagnoses are concomitant conditions that coexist at the time of admission or develop during the stay. All-listed diagnoses include the principal diagnosis plus these additional secondary conditions.

All-listed procedures include all procedures performed during the hospital stay, whether for definitive treatment or for diagnostic or exploratory purposes.

ICD-9-CM is the International Classification of Diseases, Ninth Revision, Clinical Modification, which assigns numeric codes to diagnoses and procedures. There are approximately 14,000 ICD-9-CM diagnosis codes and approximately 4,000 ICD-9-CM procedure codes.

CCS categorizes ICD-9-CM diagnosis codes and procedure codes into a manageable number of clinically meaningful categories.15 This clinical grouper makes it easier to quickly understand patterns of diagnoses and procedure use. CCS categories identified as Other typically are not reported; these categories include miscellaneous, otherwise unclassifiable diagnoses and procedures that may be difficult to interpret as a group.

The Elixhauser Comorbidity Software assigns variables that identify comorbidities in hospital discharge records using the diagnosis coding of ICD-9-CM. There are a total of 29 comorbidities assigned in the 2014 NIS.16 For this Statistical Brief, reporting was limited to those comorbidities that occurred among at least 5 percent of adult inpatient stays involving hepatitis C in 2014.

Case definition
Table 5 provides the ICD-9-CM diagnosis codes used to define hepatitis C for this Statistical Brief.


Table 5. ICD-9-CM diagnosis codes defining hepatitis C
ICD-9-CM diagnosis code Description
070.41 Acute hepatitis C with hepatic coma
070.44 Chronic hepatitis C with hepatic coma
070.51 Acute hepatitis C without mention of hepatic coma
070.54 Chronic hepatitis C without mention of hepatic coma
070.70 Unspecified viral hepatitis C without hepatic coma
070.71 Unspecified viral hepatitis C with hepatic coma
V02.62 Hepatitis C carrier


Table 6 provides the CCS and ICD-9-CM diagnosis codes used to define the key co-occurring conditions of interest—hepatitis B, human immunodeficiency virus (HIV), and alcoholic liver disease.

Table 6. CCS and ICD-9-CM diagnosis codes defining hepatitis B, HIV, and alcoholic liver disease
Condition ICD-9-CM or CCS diagnosis code Description
Hepatitis B 070.20 Viral hepatitis B with hepatic coma, acute or unspecified, without mention of hepatitis delta
070.21 Viral hepatitis B with hepatic coma, acute or unspecified, with hepatitis delta
070.22 Viral hepatitis B with hepatic coma, chronic, without mention of hepatitis delta
070.23 Viral hepatitis B with hepatic coma, chronic with hepatitis delta
070.30 Viral hepatitis B without mention of hepatic coma, acute or unspecified, without mention of hepatitis delta
070.31 Viral hepatitis B without mention of hepatic coma, acute or unspecified, with hepatitis delta
070.32 Viral hepatitis B without mention of hepatic coma, chronic, without mention of hepatitis delta
070.33 Viral hepatitis B without mention of hepatic coma, chronic with hepatitis delta
070.42 Hepatitis delta without mention of active hepatitis B disease with hepatic coma
070.52 Hepatitis delta without mention of active hepatitis B disease or hepatic coma
V02.61 Hepatitis B carrier
HIV CCS 5 HIV infection
Alcoholic liver disease 571.0 Alcoholic fatty liver
571.1 Acute alcoholic hepatitis
571.2 Alcoholic cirrhosis of liver
571.3 Alcoholic liver damage, unspecified
Abbreviations: CCS, Clinical Classifications Software; HIV, human immunodeficiency virus


Table 7 provides the CCS and ICD-9-CM diagnosis codes used to define other co-occurring conditions.

E860.0
Table 7. CCS and ICD-9-CM diagnosis codes defining other co-occurring conditions
Condition ICD-9-CM or CCS diagnosis code Description
Liver cancer 155.0 Malignant neoplasm of liver, primary
155.1 Malignant neoplasm of intrahepatic bile ducts
155.2 Malignant neoplasm of liver, not specified as primary or secondary
197.7 Liver, specified as secondary malignant neoplasm
230.8 Carcinoma in situ of liver and biliary system
235.3 Neoplasm of uncertain behavior, liver and biliary passages
Cirrhosis of the liver 571.5 Cirrhosis of liver without mention of alcohol
Ascites 789.59 Other ascites
456.0 Esophageal varices with bleeding
456.20 Esophageal varices in diseases classified elsewhere with bleeding
530.21 Ulcer of esophagus with bleeding
530.4 Perforation of esophagus
530.7 Gastroesophageal laceration-hemorrhage syndrome
530.82 Esophageal hemorrhage
531.00 Acute gastric ulcer with hemorrhage without obstruction
531.01 Acute gastric ulcer with hemorrhage with obstruction
531.10 Acute gastric ulcer with perforation without obstruction
531.11 Acute gastric ulcer with perforation with obstruction
531.20 Acute gastric ulcer with hemorrhage and perforation without obstruction
531.21 Acute gastric ulcer with hemorrhage and perforation with obstruction
532.00 Acute duodenal ulcer with hemorrhage without obstruction
532.01 Acute duodenal ulcer with hemorrhage with obstruction
532.10 Acute duodenal ulcer with perforation without obstruction
532.11 Acute duodenal ulcer with perforation with obstruction
532.20 Acute duodenal ulcer with hemorrhage and perforation without obstruction
532.21 Acute duodenal ulcer with hemorrhage and perforation with obstruction
533.00 Acute peptic ulcer of unspecified site with hemorrhage without obstruction
533.01 Acute peptic ulcer of unspecified site with hemorrhage with obstruction
533.10 Acute peptic ulcer of unspecified site with perforation without obstruction
533.11 Acute peptic ulcer of unspecified site with perforation with obstruction
533.20 Acute peptic ulcer of unspecified site with hemorrhage and perforation without obstruction
533.21 Acute peptic ulcer of unspecified site with hemorrhage and perforation with obstruction
531.40 Chronic or unspecified gastric ulcer with hemorrhage without obstruction
531.41 Chronic or unspecified gastric ulcer with hemorrhage with obstruction
531.50 Chronic or unspecified gastric ulcer with perforation without obstruction
531.51 Chronic or unspecified gastric ulcer with perforation with obstruction
531.60 Chronic or unspecified gastric ulcer with hemorrhage and perforation without obstruction
531.61 Chronic or unspecified gastric ulcer with hemorrhage and perforation with obstruction
532.40 Chronic or unspecified duodenal ulcer with hemorrhage without obstruction
532.41 Chronic or unspecified duodenal ulcer with hemorrhage with obstruction
532.50 Chronic or unspecified duodenal ulcer with perforation without obstruction
532.51 Chronic or unspecified duodenal ulcer with perforation with obstruction
532.60 Chronic or unspecified duodenal ulcer with hemorrhage and perforation without obstruction
532.61 Chronic or unspecified duodenal ulcer with hemorrhage and perforation with obstruction
533.40 Chronic or unspecified peptic ulcer of unspecified site with hemorrhage without obstruction
533.41 Chronic or unspecified peptic ulcer of unspecified site with hemorrhage with obstruction
533.50 Chronic or unspecified peptic ulcer of unspecified site with perforation without obstruction
533.51 Chronic or unspecified peptic ulcer of unspecified site with perforation with obstruction
533.60 Chronic or unspecified peptic ulcer of unspecified site with hemorrhage and perforation without obstruction
533.61 Chronic or unspecified peptic ulcer of unspecified site with hemorrhage and perforation with obstruction
535.01 Acute gastritis with hemorrhage
535.11 Atrophic gastritis with hemorrhage
535.21 Gastric mucosal hypertrophy with hemorrhage
535.41 Other specified gastritis with hemorrhage
535.51 Unspecified gastritis and gastroduodenitis with hemorrhage
535.61 Duodenitis with hemorrhage
535.71 Eosinophilic gastritis with hemorrhage
537.83 Angiodysplasia of stomach and duodenum with hemorrhage
578.0 Hematemesis
578.9 Hemorrhage of gastrointestinal tract, unspecified
Any mental disorder CCS 650 Adjustment disorders
CCS 651 Anxiety disorders
CCS 652 Attention-deficit, conduct, and disruptive behavior disorders
CCS 655 Disorders usually diagnosed in infancy, childhood, or adolescence
CCS 656 Impulse control disorders, NEC
CCS 657 Mood disorders
CCS 658 Personality disorders
CCS 659 Schizophrenia and other psychotic disorders
CCS 662 Suicide and intentional self-inflicted injury
CCS 663 Screening and history of mental health and substance abuse codes
CCS 670 Miscellaneous disorders
Any nonalcohol substance use disorder 661 Substance-related disorders
Any alcohol-related diagnosis (other than ALD) 291.0 Alcohol withdrawal delirium
291.1 Alcohol-induced persisting amnestic disorder
291.2 Alcohol-induced persisting dementia
291.3 Alcohol-induced psychotic disorder with hallucinations
291.4 Idiosyncratic alcohol intoxication
291.5 Alcohol-induced psychotic disorder with delusions
291.81 Alcohol withdrawal
291.82 Alcohol induced sleep disorders
291.89 Other alcohol-induced mental disorders
291.9 Unspecified alcohol-induced mental disorders
303.00 Acute alcoholic intoxication in alcoholism, unspecified
303.01 Acute alcoholic intoxication in alcoholism, continuous
303.02 Acute alcoholic intoxication in alcoholism, episodic
303.03 Acute alcoholic intoxication in alcoholism, in remission
303.90 Other and unspecified alcohol dependence, unspecified
303.91 Other and unspecified alcohol dependence, continuous
303.92 Other and unspecified alcohol dependence, episodic
303.93 Other and unspecified alcohol dependence, in remission
305.00 Alcohol abuse, unspecified
305.01 Alcohol abuse, continuous
305.02 Alcohol abuse, episodic
305.03 Alcohol abuse, in remission
357.5 Alcoholic polyneuropathy
425.5 Alcoholic cardiomyopathy
535.30 Alcoholic gastritis, without mention of hemorrhage
535.31 Alcoholic gastritis, with hemorrhage
760.71 Alcohol affecting fetus or newborn via placenta or breast milk
790.3 Excessive blood level of alcohol
980.0 Toxic effect of ethyl alcohol
V11.3 Alcoholism
Accidental poisoning by alcoholic beverages
Abbreviations: ALD, alcoholic liver disease; CCS, Clinical Classifications Software


Table 8 provides the CCS and ICD-9-CM procedure codes used to define co-occurring procedures.

Table 8. CCS and ICD-9-CM procedure codes defining co-occurring procedures
Procedure ICD-9-CM or CCS diagnosis code Description
Abdominal paracentesis CCS 88 Abdominal paracentesis
Upper gastro-intestinal endoscopy CCS 70 Upper gastrointestinal endoscopy; biopsy
Abbreviation: CCS, Clinical Classifications Software


Types of hospitals included in the HCUP National (Nationwide) Inpatient Sample
The National (Nationwide) Inpatient Sample (NIS) is based on data from community hospitals, which are defined as short-term, non-Federal, general, and other hospitals, excluding hospital units of other institutions (e.g., prisons). The NIS includes obstetrics and gynecology, otolaryngology, orthopedic, cancer, pediatric, public, and academic medical hospitals. Excluded are long-term care facilities such as rehabilitation, psychiatric, and alcoholism and chemical dependency hospitals. Beginning in 2012, long-term acute care hospitals are also excluded. However, if a patient received long-term care, rehabilitation, or treatment for a psychiatric or chemical dependency condition in a community hospital, the discharge record for that stay will be included in the NIS.

Unit of analysis
The unit of analysis is the hospital discharge (i.e., the hospital stay), not a person or patient. This means that a person who is admitted to the hospital multiple times in 1 year will be counted each time as a separate discharge from the hospital.

Costs and charges
Total hospital charges were converted to costs using HCUP Cost-to-Charge Ratios based on hospital accounting reports from the Centers for Medicare & Medicaid Services (CMS).17 Costs reflect the actual expenses incurred in the production of hospital services, such as wages, supplies, and utility costs; charges represent the amount a hospital billed for the case. For each hospital, a hospital-wide cost-to-charge ratio is used. Hospital charges reflect the amount the hospital billed for the entire hospital stay and do not include professional (physician) fees. For the purposes of this Statistical Brief, costs are reported to the nearest hundred.

Hospital location
The classification of whether a hospital is in a metropolitan area (urban) or nonmetropolitan area (rural) is defined from the American Hospital Association (AHA) Annual Survey, using the 1993 U.S. Office of Management and Budget definition.

Community-level income
Community-level income is based on the median household income of the patient's ZIP Code of residence. Quartiles are defined so that the total U.S. population is evenly distributed. Cut-offs for the quartiles are determined annually using ZIP Code demographic data obtained from Claritas, a vendor that adds value to data from the U.S. Census Bureau.18 The value ranges for the income quartiles vary by year. Patients in the first quartile are designated as having low income, and patients in the upper three quartiles are designated as having not low income. The income quartile is missing for patients who are homeless or foreign.

Payer
Payer is the expected payer for the hospital stay. To make coding uniform across all HCUP data sources, payer combines detailed categories into general groups:
  • Medicare: includes patients covered by fee-for-service and managed care Medicare
  • Medicaid: includes patients covered by fee-for-service and managed care Medicaid
  • Private Insurance: includes Blue Cross, commercial carriers, and private health maintenance organizations (HMOs) and preferred provider organizations (PPOs)
  • Uninsured: includes an insurance status of self-pay and no charge
  • Other: includes Workers' Compensation, TRICARE/CHAMPUS, CHAMPVA, Title V, and other government programs
Hospital stays billed to the State Children's Health Insurance Program (SCHIP) may be classified as Medicaid, Private Insurance, or Other, depending on the structure of the State program. Because most State data do not identify patients in SCHIP specifically, it is not possible to present this information separately.

For this Statistical Brief, when more than one payer is listed for a hospital discharge, the first-listed payer is used.

Division
Division corresponds to the location of the hospital and is one of the nine divisions defined by the U.S. Census Bureau:
  • New England: Maine, New Hampshire, Vermont, Massachusetts, Rhode Island, Connecticut
  • Middle Atlantic: New York, New Jersey, Pennsylvania
  • East North Central: Ohio, Indiana, Illinois, Michigan, Wisconsin
  • West North Central: Minnesota, Iowa, Missouri, North Dakota, South Dakota, Nebraska, Kansas
  • South Atlantic: Delaware, Maryland, District of Columbia, Virginia, West Virginia, North Carolina, South Carolina, Georgia, Florida
  • East South Central: Kentucky, Tennessee, Alabama, Mississippi
  • West South Central: Arkansas, Louisiana, Oklahoma, Texas
  • Mountain: Montana, Idaho, Wyoming, Colorado, New Mexico, Arizona, Utah, Nevada
  • Pacific: Washington, Oregon, California, Alaska, Hawaii

Reporting of race and ethnicity
Data on Hispanic ethnicity are collected differently among the States and also can differ from the Census methodology of collecting information on race (White, Black, Asian/Pacific Islander, American Indian/Alaska Native, Other (including mixed race)) separately from ethnicity (Hispanic, non-Hispanic). State data organizations often collect Hispanic ethnicity as one of several categories that include race. Therefore, for multistate analyses, HCUP creates the combined categorization of race and ethnicity for data from States that report ethnicity separately. When a State data organization collects Hispanic ethnicity separately from race, HCUP uses Hispanic ethnicity to override any other race category to create a Hispanic category for the uniformly coded race/ethnicity data element, while also retaining the original race and ethnicity data. This Statistical Brief reports race/ethnicity for the following categories: White (non-Hispanic), Black (non-Hispanic), Hispanic, and Other (which includes Asian/Pacific Islander, American Indian/Alaska Native, and non-Hispanic Other).

About HCUP

The Healthcare Cost and Utilization Project (HCUP, pronounced "H-Cup") is a family of healthcare databases and related software tools and products developed through a Federal-State-Industry partnership and sponsored by the Agency for Healthcare Research and Quality (AHRQ). HCUP databases bring together the data collection efforts of State data organizations, hospital associations, and private data organizations (HCUP Partners) and the Federal government to create a national information resource of encounter-level healthcare data. HCUP includes the largest collection of longitudinal hospital care data in the United States, with all-payer, encounter-level information beginning in 1988. These databases enable research on a broad range of health policy issues, including cost and quality of health services, medical practice patterns, access to healthcare programs, and outcomes of treatments at the national, State, and local market levels.

HCUP would not be possible without the contributions of the following data collection Partners from across the United States:

Alaska Department of Health and Social Services
Alaska State Hospital and Nursing Home Association
Arizona Department of Health Services
Arkansas Department of Health
California Office of Statewide Health Planning and Development
Colorado Hospital Association
Connecticut Hospital Association
District of Columbia Hospital Association
Florida Agency for Health Care Administration
Georgia Hospital Association
Hawaii Health Information Corporation
Illinois Department of Public Health
Indiana Hospital Association
Iowa Hospital Association
Kansas Hospital Association
Kentucky Cabinet for Health and Family Services
Louisiana Department of Health
Maine Health Data Organization
Maryland Health Services Cost Review Commission
Massachusetts Center for Health Information and Analysis
Michigan Health & Hospital Association
Minnesota Hospital Association
Mississippi State Department of Health
Missouri Hospital Industry Data Institute
Montana Hospital Association
Nebraska Hospital Association
Nevada Department of Health and Human Services
New Hampshire Department of Health & Human Services
New Jersey Department of Health
New Mexico Department of Health
New York State Department of Health
North Carolina Department of Health and Human Services
North Dakota (data provided by the Minnesota Hospital Association)
Ohio Hospital Association
Oklahoma State Department of Health
Oregon Association of Hospitals and Health Systems
Oregon Office of Health Analytics
Pennsylvania Health Care Cost Containment Council
Rhode Island Department of Health
South Carolina Revenue and Fiscal Affairs Office
South Dakota Association of Healthcare Organizations
Tennessee Hospital Association
Texas Department of State Health Services
Utah Department of Health
Vermont Association of Hospitals and Health Systems
Virginia Health Information
Washington State Department of Health
West Virginia Department of Health and Human Resources, West Virginia Health Care Authority
Wisconsin Department of Health Services
Wyoming Hospital Association

About the NIS

The HCUP National (Nationwide) Inpatient Sample (NIS) is a nationwide database of hospital inpatient stays. The NIS is nationally representative of all community hospitals (i.e., short-term, non-Federal, nonrehabilitation hospitals). The NIS includes all payers. It is drawn from a sampling frame that contains hospitals comprising more than 95 percent of all discharges in the United States. The vast size of the NIS allows the study of topics at the national and regional levels for specific subgroups of patients. In addition, NIS data are standardized across years to facilitate ease of use. Over time, the sampling frame for the NIS has changed; thus, the number of States contributing to the NIS varies from year to year. The NIS is intended for national estimates only; no State-level estimates can be produced.

The 2012 NIS was redesigned to optimize national estimates. The redesign incorporates two critical changes:
  • Revisions to the sample design—starting with 2012, the NIS is now a sample of discharge records from all HCUP-participating hospitals, rather than a sample of hospitals from which all discharges were retained (as is the case for NIS years before 2012).
  • Revisions to how hospitals are defined—the NIS now uses the definition of hospitals and discharges supplied by the statewide data organizations that contribute to HCUP, rather than the definitions used by the American Hospital Association (AHA) Annual Survey of Hospitals.
The new sampling strategy is expected to result in more precise estimates than those that resulted from the previous NIS design by reducing sampling error: for many estimates, confidence intervals under the new design are about half the length of confidence intervals under the previous design. The change in sample design for 2012 necessitates recomputation of prior years' NIS data to enable analyses of trends that use the same definitions of discharges and hospitals.

For More Information

For other information on infectious diseases, including hepatitis C, refer to the HCUP Statistical Briefs located at www.hcup-us.ahrq.gov/reports/statbriefs/sb_infectious.jsp.

For additional HCUP statistics, visit:
For more information about HCUP, visit www.hcup-us.ahrq.gov/.

For a detailed description of HCUP and more information on the design of the National (Nationwide) Inpatient Sample (NIS), please refer to the following database documentation:

Agency for Healthcare Research and Quality. Overview of the National (Nationwide) Inpatient Sample (NIS). Healthcare Cost and Utilization Project (HCUP). Rockville, MD: Agency for Healthcare Research and Quality. Updated December 2016. www.hcup-us.ahrq.gov/nisoverview.jsp. Accessed January 31, 2017.

Suggested Citation

Ngo-Metzger Q (AHRQ), Mabry-Hernandez I (AHRQ), Heslin KC (AHRQ), Weiss AJ (IBM Watson Health), Mummert A (IBM Watson Health), Bierman AS (AHRQ). Characteristics of Inpatient Stays Involving Hepatitis C, 2005-2014. HCUP Statistical Brief #232. November 2017. Agency for Healthcare Research and Quality, Rockville, MD. www.hcup-us.ahrq.gov/reports/statbriefs/sb232-Hepatitis-C-Hospital-Stays-Trends.pdf.

Acknowledgments

The authors would like to acknowledge the contributions of Minya Sheng of IBM Watson Health.

***

AHRQ welcomes questions and comments from readers of this publication who are interested in obtaining more information about access, cost, use, financing, and quality of healthcare in the United States. We also invite you to tell us how you are using this Statistical Brief and other HCUP data and tools, and to share suggestions on how HCUP products might be enhanced to further meet your needs. Please e-mail us at hcup@ahrq.gov or send a letter to the address below:

Sharon B. Arnold, Ph.D., Acting Director
Center for Delivery, Organization, and Markets
Agency for Healthcare Research and Quality
5600 Fishers Lane
Rockville, MD 20857


This Statistical Brief was posted online on December 5, 2017.


1 Alter MJ, Kruszon-Moran D, Nainan OV, McQuillan GM, Gao F, Moyer LA, et al. The prevalence of hepatitis C virus infection in the United States, 1988 through 1994. New England Journal of Medicine. 1999;341:556-62.
2 Edlin BR, Eckhardt BJ, Shu MA, Holmberg SD, Swan T. Toward a more accurate estimate of the prevalence of hepatitis C in the United States. Hepatology. 2015;62(5):1353-63.
3 Rosenberg ES, Hall EW, Sullivan PS, Sanchez TH, Workowski KA, Ward JW, et al. Estimation of state-level prevalence of hepatitis C virus infection, US States and District of Columbia, 2010. Clinical Infectious Diseases: An Official Publication of the Infectious Diseases Society of America. 2017;64(11):1573-81.
4 U.S. Centers for Disease Control and Prevention. Hepatitis C FAQs for Health Professionals. Updated January 27, 2017. www.cdc.gov/hepatitis/hcv/hcvfaq.htm. Accessed September 15, 2017.
5 Smith BD, Patel N, Beckett GA, Ward JW. Hepatitis C virus antibody prevalence, correlates and predictors among persons born from 1945 through 1965, United States, 1999-2008 [Abstract]. Hepatology. 2011;54(4, Suppl):554A-5A.
6 U.S. Centers for Disease Control and Prevention, 2017. Op. cit.
7 U.S. Centers for Disease Control and Prevention. Surveillance for Viral Hepatitis - United States, 2015. Updated June 19, 2017. www.cdc.gov/hepatitis/statistics/2015surveillance/commentary.htm. Accessed September 15, 2017.
8 Zibbell JE, Iqbal K, Patel RC, Suryaprasad A, Sanders KJ, Moore-Moravian L, et al. Increases in hepatitis C virus infection related to injection drug use among persons aged <30 years-Kentucky, Tennessee, Virginia, and West Virginia, 2006-2012. Morbidity and Mortality Weekly Report. 2015;64(17):453-8.
9 U.S. Centers for Disease Control and Prevention, 2017. Op. cit.
10 Louie KS, St Laurent S, Forssen UM, Mundy LM, Pimenta JM. The high comorbidity burden of the hepatitis C virus infected population in the United States. BMC Infectious Diseases. 2012;12:86.
11 U.S. Centers for Disease Control and Prevention. Hepatitis C FAQs for Health Professionals. Updated January 27, 2017. www.cdc.gov/hepatitis/hcv/hcvfaq.htm. Accessed September 15, 2017.
12 Ly KN, Xing J, Klevens RM, Jiles RB, Ward JW, Holmberg SC. The increasing burden of mortality from viral hepatitis in the United States between 1999 and 2007. Annals of Internal Medicine. 2012;156(4):271-8.
13 Xu F, Tong X, Leidner AJ. Hospitalizations and costs associated with hepatitis C and advanced liver disease continue to increase. Health Affairs. 2014;33(10):1728-35.
14 U.S. Census Bureau. Annual Estimates of the Resident Population by Single Year of Age and Sex for the United States, States, and Puerto Rico Commonwealth: April 1, 2010 to July 1, 2014; 2014 Population Estimates. www.factfinder.census.gov/faces/nav/jsf/pages/index.xhtml. Accessed July 31, 2017.
15 Agency for Healthcare Research and Quality. HCUP Clinical Classifications Software (CCS) for ICD-9-CM. Healthcare Cost and Utilization Project (HCUP). Rockville, MD: Agency for Healthcare Research and Quality. Updated October 2016. www.hcup-us.ahrq.gov/toolssoftware/ccs/ccs.jsp. Accessed January 31, 2017.
16 Agency for Healthcare Research and Quality. Elixhauser Comorbidity Software, Version 3.7. Rockville, MD: Agency for Healthcare Research and Quality. Updated June 2017. www.hcup-us.ahrq.gov/toolssoftware/comorbidity/comorbidity.jsp. Accessed July 19, 2017.
17 Agency for Healthcare Research and Quality. HCUP Cost-to-Charge Ratio (CCR) Files. Healthcare Cost and Utilization Project (HCUP). 2001-2014. Rockville, MD: Agency for Healthcare Research and Quality. Updated November 2016. www.hcup-us.ahrq.gov/db/state/costtocharge.jsp. Accessed January 31, 2017.
18 Claritas. Claritas Demographic Profile. www.claritas.com. Exit Disclaimer Accessed June 23, 2017.

Internet Citation: Statistical Brief #232. Healthcare Cost and Utilization Project (HCUP). November 2017. Agency for Healthcare Research and Quality, Rockville, MD. www.hcup-us.ahrq.gov/reports/statbriefs/sb232-Hepatitis-C-Hospital-Stays-Trends.jsp.
Are you having problems viewing or printing pages on this website?
If you have comments, suggestions, and/or questions, please contact hcup@ahrq.gov.
Privacy Notice, Viewers & Players
Last modified 11/21/17