STATISTICAL BRIEF #233 |
December 2017
Kimberly W. McDermott, Ph.D., William J. Freeman, M.P.H., and Anne Elixhauser, Ph.D. Introduction The majority of patients admitted to the hospital undergo at least one type of procedure during their stay.1 Many diagnostic and therapeutic procedures, such as x-rays and blood transfusions, are performed outside of the operating room (OR), whereas surgical procedures, such as Cesarean sections and hip replacements, take place in the OR. On average, hospital costs for stays with OR procedures are more than double the costs for inpatient stays without OR procedures.2,3 Identifying the characteristics, costs, and volume of OR procedures can guide healthcare improvement efforts. Such information can also provide baseline data for assessing the potential impact of advances in medical practice and technology and changes in healthcare provider arrangements. This Healthcare Cost and Utilization Project (HCUP) Statistical Brief updates previous HCUP reports focused on OR procedures in the inpatient setting,4,5,6,7 presenting data from U.S. hospitals in 2014, the last full year that procedures were coded using ICD-9-CM. In this Statistical Brief, OR procedures are defined using diagnosis-related group (DRG) algorithms, which were based on reviews by clinical panels. The percentage of all inpatient stays involving operating room (OR) procedures and the percentage of aggregate costs attributed to inpatient stays involving OR procedures are presented. Patient characteristics, resource use, and outcomes are provided for inpatient stays with OR procedures. The most frequent and most costly OR procedures are also presented. Differences in estimates of 10 percent or greater are noted in the text. Findings Characteristics of inpatient stays involving operating room procedures, 2014 Figure 1 shows the percentage of all inpatient stays with operating room (OR) procedures and the percentage of aggregate hospital costs attributed to stays involving OR procedures. |
|
|
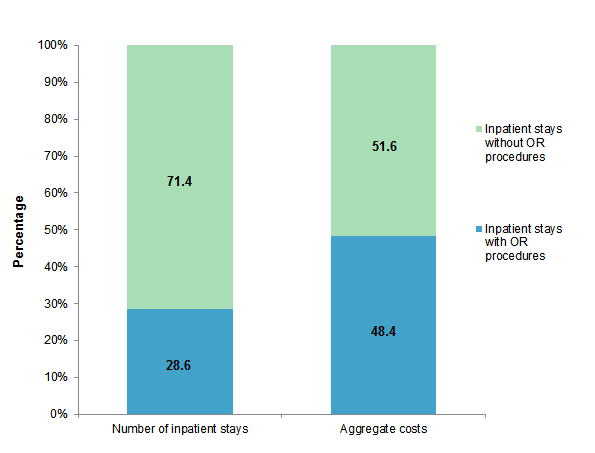
Figure 1. Percentage of inpatient stays and aggregate costs for inpatient stays with and without operating room (OR) procedures, 2014
Source: Agency for Healthcare Research and Quality (AHRQ), Center for Delivery, Organization, and Markets, Healthcare Cost and Utilization Project (HCUP) National Inpatient Sample (NIS), 2014 Bar chart that shows the percentage of inpatient stays and aggregate costs for inpatient stays with and without OR procedures in 2014. Number of inpatient stays: 28.6% with OR procedures; 71.4% without OR procedures. Aggregate costs: 48.4% with OR procedures; 51.6% without OR procedures.
|
|
| Table 1. Utilization and outcomes for inpatient hospital stays with and without operating room (OR) procedures, 2014 | ||
| Characteristic or outcome | Stays with one or more OR procedures | Stays without any OR procedures |
|---|---|---|
| Number of stays | 10,115,800 | 25,243,000 |
| All hospital stays, % | 28.6 | 71.4 |
| Rate of stays per 100,000 population | 3,172.5 | 7,916.7 |
| Aggregate costs, $ billions | 187.1 | 199.1 |
| Aggregate costs, % | 48.4 | 51.6 |
| Mean cost per stay, $ | 18,500 | 7,900 |
| Mean length of stay, days | 5.1 | 4.4 |
| Mean cost per day, $ | 4,800 | 2,100 |
| Admitted from emergency department, % | 27.7 | 58.7 |
| Discharge status, % | ||
| Discharged to self-care (routine discharge) or home healthcare | 83.0 | 80.3 |
| Transferred to short-term hospital | 0.8 | 2.5 |
| Transferred to other type of facility, including long-term care | 14.8 | 13.5 |
| Died in hospital | 1.2 | 2.2 |
| Othera | 0.2 | 1.5 |
| Notes: Number of stays, mean cost per stay, and mean cost per day are rounded to the nearest hundred. a Other discharges include alive/destination unknown, against medical advice, and missing. Source: Agency for Healthcare Research and Quality (AHRQ), Center for Delivery, Organization, and Markets, Healthcare Cost and Utilization Project (HCUP) National Inpatient Sample (NIS), 2014 | ||
|
| Table 2. Distribution of inpatient stays with and without operating room (OR) procedures, by patient characteristic, 2014 | ||||
| Characteristic | Stays with one or more OR procedures | Stays without any OR procedures | ||
|---|---|---|---|---|
| Number | % | Number | % | |
| All stays | 10,115,800 | 100.0 | 25,243,000 | 100.0 |
| Sex | ||||
| Male | 4,776,200 | 47.2 | 10,319,500 | 40.9 |
| Female | 5,337,900 | 52.8 | 14,917,700 | 59.1 |
| Age, years | ||||
| <1a | 1,136,400 | 11.2 | 3,111,400 | 12.3 |
| 1-17 | 272,100 | 2.7 | 1,075,200 | 4.3 |
| 18-44 | 2,568,100 | 25.4 | 6,146,800 | 24.4 |
| 45-64 | 2,844,000 | 28.1 | 5,865,300 | 23.2 |
| 65-84 | 2,851,200 | 28.2 | 6,638,900 | 26.3 |
| 85+ | 441,100 | 4.4 | 2,396,600 | 9.5 |
| Expected primary payer | ||||
| Medicare | 3,505,400 | 34.7 | 10,289,700 | 40.8 |
| Medicaid | 1,903,500 | 18.8 | 6,090,000 | 24.1 |
| Private insurance | 3,970,900 | 39.3 | 6,862,100 | 27.2 |
| Uninsured | 375,200 | 3.7 | 1,275,200 | 5.1 |
| Community-level income | ||||
| Low (lowest quartile) | 2,610,300 | 25.8 | 7,634,300 | 30.2 |
| Not low (upper 3 quartiles) | 7,505,500 | 74.2 | 17,608,600 | 69.8 |
| Location of patient residence | ||||
| Large central metropolitan | 2,861,800 | 28.3 | 7,839,700 | 31.1 |
| Large fringe metropolitan (suburbs) | 2,501,800 | 24.7 | 5,914,200 | 23.4 |
| Medium and small metropolitan | 3,045,100 | 30.1 | 7,344,100 | 29.1 |
| Micropolitan and noncore (rural) | 1,670,300 | 16.5 | 4,014,400 | 15.9 |
| Notes: Number of stays is rounded to the nearest hundred. Percentage is based on unrounded data values. Unspecified, missing, and "other" categories are not reported. a The vast majority of inpatient stays with OR procedures among infants involved male circumcision. Source: Agency for Healthcare Research and Quality (AHRQ), Center for Delivery, Organization, and Markets, Healthcare Cost and Utilization Project (HCUP) National Inpatient Sample (NIS), 2014 | ||||
|
|
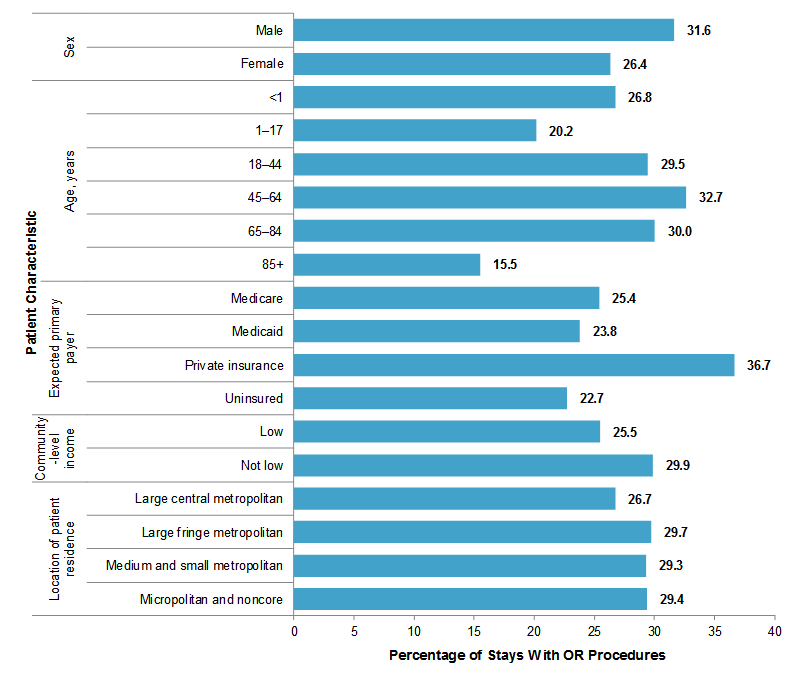
Figure 2. Percentage of inpatient stays that involved operating room (OR) procedures, by patient characteristic, 2014
Source: Agency for Healthcare Research and Quality (AHRQ), Center for Delivery, Organization, and Markets, Healthcare Cost and Utilization Project (HCUP) National Inpatient Sample (NIS), 2014 Bar chart that shows the percentage of inpatient stays with OR procedures in 2014 by patient characteristics. Sex: male, 31.6%; female, 26.4%. Age: < year, 26.8%; 1-17 years, 20.2%; 18-44 years, 29.5%; 45-64 years, 32.7%; 65-84 years, 30.0%; 85+ years, 15.5%. Expected primary payer: Medicare, 25.4%; Medicaid, 23.8%; private insurance, 36.7%; uninsured, 22.7%. Community-level income: low, 25.5%; not low, 29.9%. Location of patient residence: large central metropolitan, 26.7%; large fringe metropolitan, 29.7%; medium and small metropolitan, 29.3%; micropolitan and noncore, 29.4%. |
Table 3 presents the number and rate of inpatient stays for the 20 most common all-listed operating room procedures in 2014. Only one occurrence of a procedure type is counted per hospitalization because multiple codes may be used for related procedures performed during a single operation. For example, multiple codes for spinal fusion may appear on the record when multiple vertebrae were fused, but only one procedure is counted in the spinal fusion procedure category total. The unit of analysis for Table 3 is the number of procedures (unlike Table 1, which shows the number of inpatient stays with one or more procedures). |
| Table 3. Most frequent all-listed operating room (OR) procedures, 2014 | ||||
| Rank | All-listed OR procedure type | Number of OR procedures | Percent of all OR procedures | Rate per 100,000 population |
|---|---|---|---|---|
| All-listed OR procedures | 14,198,900 | 100.0 | 4,453.1 | |
| 1 | Cesarean section | 1,242,800 | 8.8 | 389.8 |
| 2 | Circumcision | 1,075,100 | 7.6 | 337.2 |
| 3 | Arthroplasty of knee | 752,900 | 5.3 | 236.1 |
| 4 | Hip replacement, total and partial | 522,800 | 3.7 | 164.0 |
| 5 | Percutaneous coronary angioplasty (PTCA) | 465,400 | 3.3 | 146.0 |
| 6 | Spinal fusion | 463,200 | 3.3 | 145.3 |
| 7 | Laminectomy, excision of intervertebral disc | 438,200 | 3.1 | 137.4 |
| 8 | Cholecystectomy and common duct exploration | 372,600 | 2.6 | 116.9 |
| 9 | Colorectal resection | 302,400 | 2.5 | 94.8 |
| 10 | Treatment, fracture or dislocation of hip and femur | 289,800 | 2.0 | 90.9 |
| 11 | Ligation of fallopian tubes | 254,500 | 1.8 | 79.8 |
| 12 | Appendectomy | 238,800 | 1.7 | 74.9 |
| 13 | Hysterectomy, abdominal and vaginal | 237,500 | 1.7 | 74.5 |
| 14 | Coronary artery bypass graft (CABG) | 201,600 | 1.4 | 63.2 |
| 15 | Oophorectomy, unilateral and bilateral | 182,400 | 1.3 | 57.2 |
| 16 | Treatment, fracture or dislocation of lower extremity (other than hip or femur) | 181,900 | 1.3 | 57.0 |
| 17 | Debridement of wound, infection or burn | 160,400 | 1.1 | 50.3 |
| 18 | Amputation of lower extremity | 146,500 | 1.0 | 46.0 |
| 19 | Heart valve procedures | 143,600 | 1.0 | 45.0 |
| 20 | Incision and excision of central nervous system (CNS) | 120,800 | 0.9 | 37.9 |
| Top 20 OR procedures | 7,793,400 | 54.9 | 2,444.2 | |
| Notes: Number of procedures is rounded to the nearest hundred. Percentage is based on unrounded data values. Procedures are grouped using the Agency for Healthcare Research and Quality (AHRQ) Clinical Classifications Software (CCS). CCS categories identified as "Other" and procedure categories that are nonspecific or likely to be adjuncts to other procedures were not reported. Procedure totals include only one occurrence of a CCS category per hospitalization because multiple codes may be used for related procedures performed during a single operation. The overall number of procedures represents the sum of all CCS category totals. Although some procedures are specific to male or female populations (e.g., Cesarean section and circumcision), the population denominator used to calculate rate includes both sexes. Source: Agency for Healthcare Research and Quality (AHRQ), Center for Delivery, Organization, and Markets, Healthcare Cost and Utilization Project (HCUP), HCUPnet (https://datatools.ahrq.gov/hcupnet) | ||||
|
| Table 4. Top five most frequent all-listed operating room (OR) procedures by age group, 2014 | |||
| Rank | OR Procedure | Number of OR procedures | Percent of OR procedures in this age group |
|---|---|---|---|
| Age <1 year | 1,186,700 | 100.0 | |
| 1 | Circumcision | 1,071,200 | 90.3 |
| 2 | Inguinal and femoral hernia repair | 4,600 | 0.4 |
| 3 | Insertion, replacement, or removal of extracranial ventricular shunt | 3,400 | 0.3 |
| 4 | Colorectal resection | 3,000 | 0.3 |
| 5 | Small bowel resection | 2,800 | 0.2 |
| Ages 1-17 years | 384,100 | 100.0 | |
| 1 | Appendectomy | 54,400 | 14.2 |
| 2 | Cesarean section | 13,000 | 3.4 |
| 3 | Spinal fusion | 12,500 | 3.2 |
| 4 | Treatment, fracture or dislocation of hip and femur | 12,400 | 3.2 |
| 5 | Tonsillectomy and/or adenoidectomy | 10,500 | 2.7 |
| Ages 18-44 years | 3,585,700 | 100.0 | |
| 1 | Cesarean section | 1,225,500 | 34.2 |
| 2 | Ligation of fallopian tubes | 253,600 | 7.1 |
| 3 | Cholecystectomy and common duct exploration | 122,800 | 3.4 |
| 4 | Hysterectomy, abdominal and vaginal | 89,700 | 2.5 |
| 5 | Appendectomy | 88,800 | 2.5 |
| Ages 45-64 years | 4,382,700 | 100.0 | |
| 1 | Arthroplasty of knee | 314,800 | 7.2 |
| 2 | Spinal fusion | 216,500 | 4.9 |
| 3 | Percutaneous coronary angioplasty (PTCA) | 207,500 | 4.7 |
| 4 | Laminectomy, excision of intervertebral disc | 199,200 | 4.5 |
| 5 | Hip replacement, total and partial | 188,000 | 4.3 |
| Ages 65-84 years | 4,094,500 | 100.0 | |
| 1 | Arthroplasty of knee | 402,500 | 9.8 |
| 2 | Hip replacement, total and partial | 253,700 | 6.2 |
| 3 | Percutaneous coronary angioplasty (PTCA) | 205,200 | 5.0 |
| 4 | Spinal fusion | 155,900 | 3.8 |
| 5 | Laminectomy, excision of intervertebral disc | 149,000 | 3.6 |
| Age 85+ years | 561,700 | 100.0 | |
| 1 | Treatment, fracture or dislocation of hip and femur | 85,800 | 15.3 |
| 2 | Hip replacement, total and partial | 61,700 | 11.0 |
| 3 | Percutaneous coronary angioplasty (PTCA) | 26,700 | 4.8 |
| 4 | Colorectal resection | 18,700 | 3.3 |
| 5 | Arthroplasty of knee | 18,200 | 3.2 |
| Notes: The number of procedures is rounded to the nearest hundred. Percentage is based on unrounded data values. Procedures are grouped using the Agency for Healthcare Research and Quality (AHRQ) Clinical Classifications Software (CCS). CCS categories identified as "Other" and procedure categories that are nonspecific or likely to be adjuncts to other procedures were not reported. Procedure totals include only one occurrence of a CCS category per hospitalization because multiple codes may be used for related procedures performed during a single operation. The overall number of procedures for each age group represents the sum of all CCS category totals for that age group. Source: Agency for Healthcare Research and Quality (AHRQ), Center for Delivery, Organization, and Markets, Healthcare Cost and Utilization Project (HCUP), HCUPnet (https://datatools.ahrq.gov/hcupnet) | |||
|
| Table 5. Most costly inpatient stays by first-listed operating room (OR) procedure, 2014 | |||||
| Rank | First-listed OR procedure type | Aggregate costs for stays with a first-listed OR procedure, $ billions | Percent of aggregate costs for all stays with a first-listed OR procedure | Mean cost per stay, $ thousands | Number of inpatient stays |
|---|---|---|---|---|---|
| First-listed OR procedures | 163.8 | 100.0 | 17.8 | 9,204,100 | |
| 1 | Spinal fusion | 12.0 | 7.3 | 28.9 | 413,200 |
| 2 | Arthroplasty of knee | 11.8 | 7.2 | 16.3 | 723,100 |
| 3 | Hip replacement, total and partial | 8.3 | 5.1 | 17.1 | 487,600 |
| 4 | Percutaneous coronary angioplasty (PTCA) | 8.1 | 4.9 | 21.5 | 377,500 |
| 5 | Cesarean section | 7.0 | 4.3 | 6.1 | 1,142,700 |
| 6 | Coronary artery bypass graft (CABG) | 6.7 | 4.1 | 41.9 | 160,200 |
| 7 | Heart valve procedures | 5.8 | 3.5 | 52.0 | 111,100 |
| 8 | Colorectal resection | 5.6 | 3.4 | 23.7 | 234,700 |
| 9 | Treatment, fracture or dislocation of hip and femur | 4.3 | 2.6 | 17.3 | 246,100 |
| 10 | Cholecystectomy and common duct exploration | 4.0 | 2.4 | 13.3 | 300,200 |
| 11 | Incision and excision of central nervous system (CNS) | 3.5 | 2.1 | 34.6 | 100,400 |
| 12 | Insertion, revision, replacement, removal of cardiac pacemaker or cardioverter/defibrillator | 2.8 | 1.7 | 35.0 | 79,000 |
| 13 | Amputation of lower extremity | 2.5 | 1.5 | 20.8 | 119,200 |
| 14 | Treatment, fracture or dislocation of lower extremity (other than hip or femur) | 2.4 | 1.4 | 16.5 | 142,400 |
| 15 | Laminectomy, excision of intervertebral disc | 2.3 | 1.4 | 14.9 | 151,700 |
| 16 | Hysterectomy, abdominal and vaginal | 1.9 | 1.2 | 10.3 | 185,000 |
| 17 | Appendectomy | 1.9 | 1.2 | 10.7 | 177,600 |
| 18 | Circumcision | 1.8 | 1.1 | 2.0 | 887,600 |
| 19 | Debridement of wound, infection or burn | 1.7 | 1.1 | 17.5 | 98,400 |
| 20 | Small bowel resection | 1.7 | 1.1 | 34.3 | 50,300 |
| 20 most costly first-listed OR procedures | 96.0 | 58.6 | - | 6,188,000 | |
| Notes: Number of stays is rounded to the nearest hundred. Percentage is based on unrounded data values. Procedures are grouped using the Agency for Healthcare Research and Quality (AHRQ) Clinical Classifications Software (CCS). CCS categories identified as "Other" are not reported. Source: Agency for Healthcare Research and Quality (AHRQ), Center for Delivery, Organization, and Markets, Healthcare Cost and Utilization Project (HCUP), HCUPnet (https://datatools.ahrq.gov/hcupnet) | |||||
HCUP Statistical Briefs provide basic descriptive statistics on a variety of topics using HCUP administrative healthcare data. Topics include hospital inpatient, ambulatory surgery, and emergency department use and costs, quality of care, access to care, medical conditions, procedures, and patient populations, among other topics. The reports are intended to generate hypotheses that can be further explored in other research; the reports are not designed to answer in-depth research questions using multivariate methods. Data Source The estimates in this Statistical Brief are based upon data from the Healthcare Cost and Utilization Project (HCUP) 2014 National Inpatient Sample (NIS). Some of the statistics were generated from HCUPnet, a free, online query system that provides users with immediate access to the largest set of publicly available, all-payer national, regional, and State-level hospital care databases from HCUP.8 Supplemental sources included population denominator data for use with HCUP databases, derived from information available from the U.S. Census Bureau.9 Definitions Procedures, ICD-9-CM, Clinical Classifications Software (CCS), diagnosis-related groups (DRGs) All-listed procedures include all procedures performed during the hospital stay, whether for definitive treatment or for diagnostic or exploratory purposes. The first-listed procedure is the procedure that is listed first on the discharge record. Inpatient data define this as the principal procedure—the procedure that is performed for definitive treatment rather than for diagnostic or exploratory purposes (i.e., the procedure that was necessary to take care of a complication). ICD-9-CM is the International Classification of Diseases, Ninth Revision, Clinical Modification, which assigns numeric codes to procedures. There are approximately 4,000 ICD-9-CM procedure codes. CCS categorizes ICD-9-CM procedure codes into a manageable number of clinically meaningful categories.10 This clinical grouper makes it easier to quickly understand patterns of procedure use. CCS categories identified as Other typically are not reported; these categories include miscellaneous, otherwise unclassifiable procedures that may be difficult to interpret as a group. In this report, procedure categories that are nonspecific or likely to be adjuncts to other procedures (e.g., excision, lysis peritoneal adhesions; partial bone excision; intraoperative cholangiogram) are not included in the listings of specific procedure rankings. Only one occurrence of a CCS category is counted per hospitalization because multiple codes may be used for related procedures performed during a single operation. For example, multiple codes for spinal fusion may appear on the record when multiple vertebrae were fused, but only one code is counted in the spinal fusion CCS category total. Major operating room (OR) procedures were defined using procedure classes, which categorize each ICD-9-CM procedure code as either major therapeutic, major diagnostic, minor therapeutic, or minor diagnostic.11 If at least one major diagnostic or major therapeutic procedure was on a hospital record, the hospital stay was classified as involving a major OR procedure. Major OR procedures are considered to be valid OR procedures based on diagnosis-related groups (DRGs). This classification scheme relies upon physician panels that classify ICD-9-CM procedure codes according to whether the procedure would be performed in a hospital operating room in most hospitals. Types of hospitals included in the HCUP National (Nationwide) Inpatient Sample The National (Nationwide) Inpatient Sample (NIS) is based on data from community hospitals, which are defined as short-term, non-Federal, general, and other hospitals, excluding hospital units of other institutions (e.g., prisons). The NIS includes obstetrics and gynecology, otolaryngology, orthopedic, cancer, pediatric, public, and academic medical hospitals. Excluded are long-term care facilities such as rehabilitation, psychiatric, and alcoholism and chemical dependency hospitals. Beginning in 2012, long-term acute care hospitals are also excluded. However, if a patient received long-term care, rehabilitation, or treatment for a psychiatric or chemical dependency condition in a community hospital, the discharge record for that stay will be included in the NIS. Unit of analysis The unit of analysis is the hospital discharge (i.e., the hospital stay), not a person or patient. This means that a person who is admitted to the hospital multiple times in 1 year will be counted each time as a separate discharge from the hospital. Costs and charges Total hospital charges were converted to costs using HCUP Cost-to-Charge Ratios based on hospital accounting reports from the Centers for Medicare & Medicaid Services (CMS).12 Costs reflect the actual expenses incurred in the production of hospital services, such as wages, supplies, and utility costs; charges represent the amount a hospital billed for the case. For each hospital, a hospital-wide cost-to-charge ratio is used. Hospital charges reflect the amount the hospital billed for the entire hospital stay and do not include professional (physician) fees. For the purposes of this Statistical Brief, costs are reported to the nearest hundred. As reported in this Statistical Brief, mean cost per day represents the weighted average of cost per day at the discharge level, which is calculated as total cost of stay divided by length of stay. When length of stay was 0 days (same-day discharge), cost per day was set equal to total cost of stay. How HCUP estimates of costs differ from National Health Expenditure Accounts There are a number of differences between the costs cited in this Statistical Brief and spending as measured in the National Health Expenditure Accounts (NHEA), which are produced annually by CMS.13 The largest source of difference comes from the HCUP coverage of inpatient treatment only in contrast to the NHEA inclusion of outpatient costs associated with emergency departments and other hospital-based outpatient clinics and departments as well. The outpatient portion of hospitals' activities has been growing steadily and may exceed half of all hospital revenue in recent years. On the basis of the American Hospital Association Annual Survey, 2012 outpatient gross revenues (or charges) were about 44 percent of total hospital gross revenues.14 Smaller sources of differences come from the inclusion in the NHEA of hospitals that are excluded from HCUP. These include Federal hospitals (Department of Defense, Veterans Administration, Indian Health Services, and Department of Justice [prison] hospitals) as well as psychiatric, substance abuse, and long-term care hospitals. A third source of difference lies in the HCUP reliance on billed charges from hospitals to payers, adjusted to provide estimates of costs using hospital-wide cost-to-charge ratios, in contrast to the NHEA measurement of spending or revenue. HCUP costs estimate the amount of money required to produce hospital services, including expenses for wages, salaries, and benefits paid to staff as well as utilities, maintenance, and other similar expenses required to run a hospital. NHEA spending or revenue measures the amount of income received by the hospital for treatment and other services provided, including payments by insurers, patients, or government programs. The difference between revenues and costs include profit for for-profit hospitals or surpluses for nonprofit hospitals. Location of patients' residence Place of residence is based on the urban-rural classification scheme for U.S. counties developed by the National Center for Health Statistics (NCHS):
Community-level income is based on the median household income of the patient's ZIP Code of residence. Quartiles are defined so that the total U.S. population is evenly distributed. Cut-offs for the quartiles are determined annually using ZIP Code demographic data obtained from Claritas, a vendor that adds value to data from the U.S. Census Bureau.15 The value ranges for the income quartiles vary by year. Patients in the first quartile are designated as having low income, and patients in the upper three quartiles are designated as having not low income. The income quartile is missing for patients who are homeless or foreign. Payer Payer is the expected payer for the hospital stay. To make coding uniform across all HCUP data sources, payer combines detailed categories into general groups:
For this Statistical Brief, when more than one payer is listed for a hospital discharge, the first-listed payer is used. Admission source or point of origin Admission source (now known as the patient's point of origin) indicates where the patient was located prior to admission to the hospital. Emergency admission indicates that the patient was admitted to the hospital through the emergency department. Discharge status Discharge status reflects the disposition of the patient at discharge from the hospital and includes the following five categories: discharged to self-care (routine discharge to home) or home healthcare; transferred to a short-term hospital; transferred to other type of facility (including skilled nursing facility, intermediate care, and another type of facility such as a nursing home); died in hospital, and other (including alive/destination unknown, against medical advice (AMA), and missing). About HCUP The Healthcare Cost and Utilization Project (HCUP, pronounced "H-Cup") is a family of healthcare databases and related software tools and products developed through a Federal-State-Industry partnership and sponsored by the Agency for Healthcare Research and Quality (AHRQ). HCUP databases bring together the data collection efforts of State data organizations, hospital associations, and private data organizations (HCUP Partners) and the Federal government to create a national information resource of encounter-level healthcare data. HCUP includes the largest collection of longitudinal hospital care data in the United States, with all-payer, encounter-level information beginning in 1988. These databases enable research on a broad range of health policy issues, including cost and quality of health services, medical practice patterns, access to healthcare programs, and outcomes of treatments at the national, State, and local market levels. HCUP would not be possible without the contributions of the following data collection Partners from across the United States: Alaska Department of Health and Social Services Alaska State Hospital and Nursing Home Association Arizona Department of Health Services Arkansas Department of Health California Office of Statewide Health Planning and Development Colorado Hospital Association Connecticut Hospital Association District of Columbia Hospital Association Florida Agency for Health Care Administration Georgia Hospital Association Hawaii Health Information Corporation Illinois Department of Public Health Indiana Hospital Association Iowa Hospital Association Kansas Hospital Association Kentucky Cabinet for Health and Family Services Louisiana Department of Health Maine Health Data Organization Maryland Health Services Cost Review Commission Massachusetts Center for Health Information and Analysis Michigan Health & Hospital Association Minnesota Hospital Association Mississippi State Department of Health Missouri Hospital Industry Data Institute Montana Hospital Association Nebraska Hospital Association Nevada Department of Health and Human Services New Hampshire Department of Health & Human Services New Jersey Department of Health New Mexico Department of Health New York State Department of Health North Carolina Department of Health and Human Services North Dakota (data provided by the Minnesota Hospital Association) Ohio Hospital Association Oklahoma State Department of Health Oregon Association of Hospitals and Health Systems Oregon Office of Health Analytics Pennsylvania Health Care Cost Containment Council Rhode Island Department of Health South Carolina Revenue and Fiscal Affairs Office South Dakota Association of Healthcare Organizations Tennessee Hospital Association Texas Department of State Health Services Utah Department of Health Vermont Association of Hospitals and Health Systems Virginia Health Information Washington State Department of Health West Virginia Department of Health and Human Resources, West Virginia Health Care Authority Wisconsin Department of Health Services Wyoming Hospital Association About the NIS The HCUP National (Nationwide) Inpatient Sample (NIS) is a nationwide database of hospital inpatient stays. The NIS is nationally representative of all community hospitals (i.e., short-term, non-Federal, nonrehabilitation hospitals). The NIS includes all payers. It is drawn from a sampling frame that contains hospitals comprising more than 95 percent of all discharges in the United States. The vast size of the NIS allows the study of topics at the national and regional levels for specific subgroups of patients. In addition, NIS data are standardized across years to facilitate ease of use. Over time, the sampling frame for the NIS has changed; thus, the number of States contributing to the NIS varies from year to year. The NIS is intended for national estimates only; no State-level estimates can be produced. The 2012 NIS was redesigned to optimize national estimates. The redesign incorporates two critical changes:
About HCUPnet HCUPnet (https://datatools.ahrq.gov/hcupnet) is an online query system that offers instant access to the largest set of all-payer healthcare databases that are publicly available. HCUPnet has an easy step-by-step query system that creates tables and graphs of national and regional statistics as well as data trends for community hospitals in the United States. HCUPnet generates statistics using data from HCUP's National (Nationwide) Inpatient Sample (NIS), the Kids' Inpatient Database (KID), the Nationwide Emergency Department Sample (NEDS), the Nationwide Readmissions Database (NRD), the State Inpatient Databases (SID), and the State Emergency Department Databases (SEDD). For More Information For other information on procedures and treatments, refer to the HCUP Statistical Briefs located at www.hcup-us.ahrq.gov/reports/statbriefs/sb_procedures.jsp. For additional HCUP statistics, visit:
For a detailed description of HCUP and more information on the design of the National (Nationwide) Inpatient Sample (NIS), please refer to the following database documentation: Agency for Healthcare Research and Quality. Overview of the National (Nationwide) Inpatient Sample (NIS). Healthcare Cost and Utilization Project (HCUP). Rockville, MD: Agency for Healthcare Research and Quality. Updated December 2016. www.hcup-us.ahrq.gov/nisoverview.jsp. Accessed January 31, 2017. Suggested Citation McDermott KW (IBM Watson Health), Freeman WJ (AHRQ), Elixhauser A (AHRQ). Overview of Operating Room Procedures During Inpatient Stays in U.S. Hospitals, 2014. HCUP Statistical Brief #233. December 2017. Agency for Healthcare Research and Quality, Rockville, MD. www.hcup-us.ahrq.gov/reports/statbriefs/sb233-Operating-Room-Procedures-United-States-2014.pdf. Acknowledgments The authors would like to acknowledge the contributions of Minya Sheng of IBM Watson Health. *** AHRQ welcomes questions and comments from readers of this publication who are interested in obtaining more information about access, cost, use, financing, and quality of healthcare in the United States. We also invite you to tell us how you are using this Statistical Brief and other HCUP data and tools, and to share suggestions on how HCUP products might be enhanced to further meet your needs. Please e-mail us at hcup@ahrq.gov or send a letter to the address below:Sharon B. Arnold, Ph.D., Acting Director Center for Delivery, Organization, and Markets Agency for Healthcare Research and Quality 5600 Fishers Lane Rockville, MD 20857 This Statistical Brief was posted online on December 19, 2017. 1 Pfuntner A, Wier LM, Stocks C. Most Frequent Procedures Performed in U.S. Hospitals, 2011. HCUP Statistical Brief #165. October 2013. Agency for Healthcare Research and Quality, Rockville, MD. www.hcup-us.ahrq.gov/reports/statbriefs/sb165.pdf. Accessed October 9, 2017. 2 Elixhauser A, Andrews RM. Profile of inpatient operating room procedures in US hospitals in 2007. Archives of Surgery. 2010;145(12):1201-1208. 3 Weiss AJ, Elixhauser A, Andrews RM. Characteristics of Operating Room Procedures in U.S. Hospitals, 2011. HCUP Statistical Brief #170. February 2014. Agency for Healthcare Research and Quality, Rockville, MD. www.hcup-us.ahrq.gov/reports/statbriefs/sb170-Operating-Room-Procedures-United-States-2011.pdf. Accessed October 10, 2017. 4 Fingar KR, Stocks CA, Weiss AJ, Steiner CA. Most Frequent Operating Room Procedures Performed in U.S. Hospitals, 2003-2012. HCUP Statistical Brief #186. December 2014. Agency for Healthcare Research and Quality, Rockville, MD. www.hcup-us.ahrq.gov/reports/statbriefs/sb186-Operating-Room-Procedures-United-States-2012.pdf. Accessed October 10, 2017. 5 Weiss AJ, Elixhauser A. Trends in Operating Room Procedures in U.S. Hospitals, 2001-2011. HCUP Statistical Brief #171. March 2014. Agency for Healthcare Research and Quality, Rockville, MD. www.hcup-us.ahrq.gov/reports/statbriefs/sb171-Operating-Room-Procedure-Trends.pdf. Accessed October 10, 2017. 6 Elixhauser, Andrews, 2010. Op. cit. 7 Weiss, Elixhauser, Andrews, 2014. Op cit. 8 Agency for Healthcare Research and Quality. HCUPnet website. https://datatools.ahrq.gov/hcupnet. Accessed January 31, 2017. 9 Barrett M, McCarty J, Coffey R, Levit K. Population Denominator Data for Use with the HCUP Databases (Updated with 2015 Population Data). HCUP Methods Series Report #2016-04. September 29, 2016. U.S. Agency for Healthcare Research and Quality. www.hcup-us.ahrq.gov/reports/methods/2016-04.pdf. Accessed January 31, 2017. 10 Agency for Healthcare Research and Quality. HCUP Clinical Classifications Software (CCS) for ICD-9-CM. Healthcare Cost and Utilization Project (HCUP). Rockville, MD: Agency for Healthcare Research and Quality. Updated October 2016. www.hcup-us.ahrq.gov/toolssoftware/ccs/ccs.jsp. Accessed January 31, 2017. 11 HCUP Procedure Classes. Healthcare Cost and Utilization Project (HCUP). U.S. Agency for Healthcare Research and Quality. Rockville, MD. Updated September 2015. www.hcup-us.ahrq.gov/toolssoftware/procedure/procedure.jsp. Accessed September 26, 2017. 12 Agency for Healthcare Research and Quality. HCUP Cost-to-Charge Ratio (CCR) Files. Healthcare Cost and Utilization Project (HCUP). 2001-2014. Rockville, MD: Agency for Healthcare Research and Quality. Updated November 2016. www.hcup-us.ahrq.gov/db/state/costtocharge.jsp. Accessed January 31, 2017. 13 For additional information about the NHEA, see Centers for Medicare & Medicaid Services (CMS). National Health Expenditure Data. CMS website May 2014. www.cms.gov/Research-Statistics-Data-and-Systems/Statistics-Trends-and-Reports/NationalHealthExpendData/index.html?redirect=/NationalHealthExpendData/. Accessed January 31, 2017. 14 American Hospital Association. TrendWatch Chartbook, 2014. Table 4.2. Distribution of Inpatient vs. Outpatient Revenues, 1992-2012. https://www.aha.org/system/files/research/reports/tw/chartbook/2016/appendix4.pdf. 15 Claritas. Claritas Demographic Profile. www.claritas.com. |
| Internet Citation: Statistical Brief #233. Healthcare Cost and Utilization Project (HCUP). April 2018. Agency for Healthcare Research and Quality, Rockville, MD. www.hcup-us.ahrq.gov/reports/statbriefs/sb233-Operating-Room-Procedures-United-States-2014.jsp?utm_source=ahrq&utm_medium=en1&utm_term=&utm_content=1&utm_campaign=ahrq_en3_20_2018. |
| Are you having problems viewing or printing pages on this website? |
| If you have comments, suggestions, and/or questions, please contact hcup@ahrq.gov. |
| Privacy Notice, Viewers & Players |
| Last modified 4/18/18 |