STATISTICAL BRIEF #256 |
April 2020
Audrey J. Weiss, Ph.D., Kevin C. Heslin, Ph.D., Carol Stocks, Ph.D., and Pamela L. Owens, Ph.D. Introduction Declared a public health emergency by the Department of Health and Human Services in 2017, the opioid crisis continues to negatively affect communities across the United States.1 The 47,600 overdose deaths due to opioids in 2017 represented 67.8 percent of all drug overdose deaths in that year and a 12-percent increase in opioid overdose deaths from the previous year alone.2 In addition to overdose, opioid-related diagnoses such as abuse/dependence, withdrawal, and medical complications arising from opioid use have become more frequent among patients in recent years, leading to sharp increases in the use of acute care services.3 Between 2005 and 2014, the national rate of opioid-related inpatient stays and emergency department visits increased 64.1 percent and 99.4 percent, respectively.4 Despite the dramatic rise in opioid-related problems, little research has focused on clinical conditions that may be associated with opioid dependence and long-term use. Concurrent with the opioid epidemic, there has been a rise in hospital inpatient stays for individuals with both drug dependence and endocarditis.5,6 Between 2002 and 2012, the number of inpatient stays involving opioid abuse/dependence and endocarditis increased by 46.1 percent.7 Endocarditis is an inflammation of the heart valves and the inner lining of the heart from bacteria or fungi that entered the bloodstream through a variety of mechanisms, including bleeding gums from brushing or dental procedures, infections, catheters, needles for body piercing and tattoos, and intravenous drug use.8 Endocarditis can lead to severe complications such as heart failure, stroke, and pulmonary embolism, and if left untreated, the condition can be fatal.9 At least half of individuals with endocarditis will require heart valve replacement surgery.10,11 |
|
The specific relationship between opioid use disorder (defined here as opioid abuse, opioid dependence, opioid use, long-term opiate use, poisoning, and adverse effects) and endocarditis is not clear. For example, a bloodstream infection resulting in endocarditis may develop subsequent to a dental procedure and may co-occur in a patient being treated with opioids. Endocarditis also may result from illicit intravenous drug (opioid) use, one of many possible risk factors for endocarditis.
Using the National (Nationwide) Inpatient Sample (NIS), this Healthcare Cost and Utilization Project (HCUP) Statistical Brief presents statistics for three groups of inpatient stays for patients aged 18 years and older:
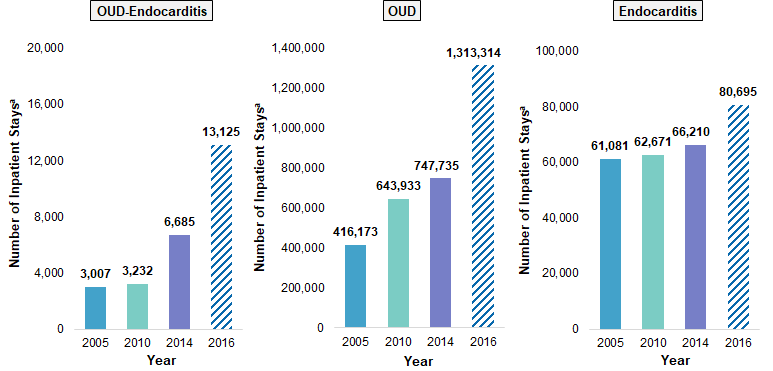
Findings Trends in inpatient stays related to opioid use disorder and/or endocarditis, 2005-2014 Figure 1 presents the total number of inpatient stays with any diagnosis related to opioid use disorder and/or endocarditis in 4 years: 2005, 2010, 2014, and 2016.12 |
|
Figure 1. Number of inpatient stays related to opioid use disorder and/or endocarditis, 2005-2016
Abbreviation: OUD, opioid use disorder Bar chart that shows the number of inpatient stays related to opioid use disorder and endocarditis, opioid use disorder only, and endocarditis only from 2005 to 2016. Data are provided in Supplemental Table 1.
|
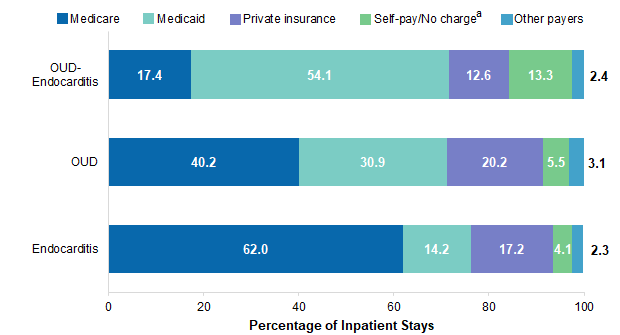
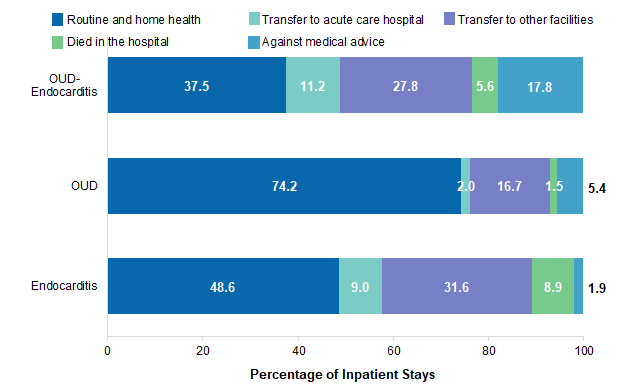
Table 1 summarizes the distribution of inpatient stays with any diagnosis of opioid use disorder and/or endocarditis, by select patient characteristics in 2016. Figures 2 and 3 present the distributions by expected primary payer (Figure 2) and discharge status (Figure 3). |
| Table 1. Characteristics of inpatient stays related to opioid use disorder and/or endocarditis, 2016 | |||
| Characteristic | OUD-endocarditis | OUD | Endocarditis |
|---|---|---|---|
| Total number of inpatient stays | 13,125 | 1,313,314 | 80,695 |
| Specific opioid diagnosis, %a | |||
| Opioid abuse/dependence | 82.3 | 50.6 | n/a |
| Opioid use | 5.5 | 5.0 | n/a |
| Poisoning | 1.8 | 4.8 | n/a |
| Adverse effects | 3.5 | 13.7 | n/a |
| Long-term use of opiates | 6.9 | 25.8 | n/a |
| Sex, %b | |||
| Female | 52.8 | 52.8 | 45.8 |
| Male | 47.1 | 47.1 | 54.2 |
| Age, years, % | |||
| 18-34 | 49.8 | 21.6 | 8.2 |
| 35-49 | 27.5 | 22.1 | 12.0 |
| 50-64 | 15.4 | 31.0 | 24.6 |
| 65-79 | 5.3 | 18.4 | 31.6 |
| 80+ | 2.0 | 6.8 | 23.7 |
| Community-level income, % | |||
| Low income (quartile 1) | 37.1 | 32.9 | 32.7 |
| Middle income (quartiles 2–3) | 45.4 | 48.0 | 46.8 |
| High income (quartile 4) | 14.9 | 16.8 | 18.3 |
| Missing | 2.6 | 2.3 | 2.2 |
| Patient location, % | |||
| Metro | 83.3 | 83.9 | 80.1 |
| Rural-adjacent to metro | 10.0 | 10.1 | 12.9 |
| Rural-remote | 5.4 | 5.1 | 6.4 |
| Missing | 1.3 | 0.9 | 0.6 |
| Abbreviations: n/a, not applicable; OUD, opioid use disorder a Some discharges included more than one opioid diagnosis type. For this table, discharges were categorized into only one opioid diagnosis category using the following hierarchy: opioid abuse/dependence, opioid use, poisoning, adverse effects, long-term use of opiates. b Patient sex was missing for less than 0.1 percent of discharges in each group. Source: Agency for Healthcare Research and Quality (AHRQ), Healthcare Cost and Utilization Project (HCUP), National Inpatient Sample (NIS), 2016 | |||
|
|
Figure 2. Expected primary payer of inpatient stays related to opioid use disorder and/or endocarditis, 2016
Abbreviation: OUD, opioid use disorder Bar chart that shows the expected payer of inpatient stays related to opioid use disorder and endocarditis, opioid use disorder only, and endocarditis only in 2016. Data are provided in Supplemental Table 2.
|
|
|
Figure 3. Discharge status of inpatient stays related to opioid use disorder and/or endocarditis, 2016
Abbreviation: OUD, opioid use disorder Bar chart that shows the discharge status of inpatient stays related to opioid use disorder and endocarditis, opioid use disorder only, and endocarditis only in 2016. Data are provided in Supplemental Table 3.
|
Table 2 presents the population rate of inpatient stays related to opioid use disorder and/or endocarditis, by the U.S. census region and division of the hospital in which patients were treated in 2016. |
| Table 2. Rate per 100,000 population of inpatient stays related to opioid use disorder and/or endocarditis, by U.S. census region and division, 2016 | |||
| U.S. census region and division | Rate of inpatient stays (per 100,000 population) | ||
|---|---|---|---|
| OUD-endocarditis | OUD | Endocarditis | |
| Northeast | 6.4 | 608.2 | 33.4 |
| New England | 8.7 | 665.2 | 29.6 |
| Middle Atlantic | 5.5 | 587.7 | 34.7 |
| Midwest | 4.7 | 567.9 | 32.3 |
| East North Central | 5.5 | 610.1 | 33.1 |
| West North Central | 2.8 | 473.4 | 30.6 |
| South | 5.4 | 497.6 | 37.2 |
| South Atlantic | 6.2 | 550.2 | 38.5 |
| East South Central | 9.6 | 644.5 | 46.8 |
| West South Central | 2.0 | 335.5 | 30.4 |
| West | 4.8 | 481.4 | 24.3 |
| South Atlantic | 4.8 | 555.9 | 23.6 |
| East South Central | 4.8 | 448.4 | 24.6 |
| Abbreviation: OUD, opioid use disorder Source: Agency for Healthcare Research and Quality (AHRQ), Healthcare Cost and Utilization Project (HCUP), National Inpatient Sample (NIS), 2016 | |||
Table 3 presents the top 10 principal diagnoses among inpatient stays with any diagnosis of opioid use disorder and/or endocarditis in 2016. |
| Table 3. Top 10 principal diagnoses of inpatient stays related to opioid use disorder and/or endocarditis, 2016 | |||||||||
| Principal diagnosis (CCSR category)a | OUD-endocarditis | OUD | Endocarditis | ||||||
|---|---|---|---|---|---|---|---|---|---|
| Rank | Number of stays | Stays, % | Rank | Number of stays | Stays, % | Rank | Number of stays | Stays, % | |
| Total number of stays | — | 13,125 | 100.0 | — | 1,313,314 | 100.0 | — | 80,695 | 100.0 |
| Septicemia (INF002) | 1 | 5,640 | 43.0 | 2 | 85,115 | 6.5 | 1 | 20,360 | 25.2 |
| Endocarditis and endocardial disease (CIR004) | 2 | 3,075 | 23.4 | 2 | 10,100 | 12.5 | |||
| Complication of cardiovascular device, implant or graft (INJ033) | 3 | 915 | 7.0 | 3 | 8,220 | 10.2 | |||
| Opioid-related disorders (MBD018) | 4 | 265 | 2.0 | 1 | 144,125 | 11.0 | |||
| Skin and subcutaneous tissue infections (SKN001) | 5 | 235 | 1.8 | 4 | 44,860 | 3.4 | |||
| Complication of other surgical or medical care, injury (INJ037) | 6 | 230 | 1.8 | 6 | 1,805 | 2.2 | |||
| Other specified complications in pregnancy (PRG028) | 7 | 155 | 1.2 | ||||||
| Osteomyelitis (MUS002) | 8 | 135 | 1.0 | ||||||
| Pneumonia (RSP002) | 9 | 115 | 0.9 | 10 | 26,425 | 2.0 | 7 | 1,540 | 1.9 |
| Cerebral infarction (CIR020) | 10 | 110 | 0.8 | 5 | 1,810 | 2.2 | |||
| Depressive disorders (MBD002) | 3 | 54,325 | 4.1 | ||||||
| Osteoarthritis (MUS006) | 5 | 36,450 | 2.8 | ||||||
| Spondylopathies/spondyloarthropathy (MUS011) | 6 | 31,710 | 2.4 | ||||||
| COPD and bronchiectasis (RSP008) | 7 | 28,005 | 2.1 | ||||||
| Alcohol-related disorders (MBD017) | 8 | 27,910 | 2.1 | ||||||
| Bipolar and related disorders (MBD003) | 9 | 27,280 | 2.1 | ||||||
| Heart failure (CIR019) | 4 | 4,710 | 5.8 | ||||||
| Acute myocardial infarction (CIR009) | 8 | 1,415 | 1.8 | ||||||
| Cardiac dysrhythmias (CIR017) | 9 | 1,380 | 1.7 | ||||||
| Acute and unspecified renal failure (GEN002) | 10 | 1,195 | 1.5 | ||||||
| Top 10 principal diagnoses | — | 10,875 | 82.9 | — | 506,205 | 38.5 | — | 52,535 | 65.1 |
| Abbreviations: CCSR, Clinical Classifications Software Refined; COPD, chronic obstructive pulmonary disease; OUD, opioid use disorder a Principal diagnosis was grouped using the CCSR for International Classification of Diseases, Tenth Revision, Clinical Modification (ICD-10-CM) diagnoses. Source: Agency for Healthcare Research and Quality (AHRQ), Healthcare Cost and Utilization Project (HCUP), National Inpatient Sample (NIS), 2016 | |||||||||
Healthcare Cost and Utilization Project (HCUP) Statistical Briefs provide basic descriptive statistics on a variety of topics using HCUP administrative healthcare data. Topics include hospital inpatient, ambulatory surgery, and emergency department use and costs, quality of care, access to care, medical conditions, procedures, and patient populations, among other topics. The reports are intended to generate hypotheses that can be further explored in other research; the reports are not designed to answer in-depth research questions using multivariate methods. Data Source The estimates in this Statistical Brief are based upon data from the HCUP 2016 National Inpatient Sample (NIS). Historical data were drawn from the 2005, 2010, and 2014 National (Nationwide) Inpatient Sample (NIS). Supplemental sources included population denominator data for use with HCUP databases, derived from information available from the U.S. Census Bureau. 13 Definitions Diagnoses, ICD-9-CM, ICD-10-CM, and Clinical Classifications Software Refined (CCSR) for ICD-10-CM diagnoses The principal diagnosis is that condition established after study to be chiefly responsible for the patient's admission to the hospital. Secondary diagnoses are concomitant conditions that coexist at the time of admission or develop during the stay. All-listed diagnoses include the principal diagnosis plus these additional secondary conditions. ICD-9-CM is the International Classification of Diseases, Ninth Revision, Clinical Modification, which assigns numeric codes to diagnoses. There are approximately 14,000 ICD-9-CM diagnosis codes. ICD-10-CM is the International Classification of Diseases, Tenth Revision, Clinical Modification. In October 2015, ICD-10-CM replaced the ICD-9-CM diagnosis coding system with the ICD-10-CM diagnosis coding system for most inpatient and outpatient medical encounters. There are over 70,000 ICD-10-CM diagnosis codes. The CCSR for ICD-10-CM aggregates the diagnosis codes into a manageable number of clinically meaningful categories.14 The CCSR for ICD-10-CM is intended to be used analytically to examine patterns of healthcare in terms of cost, utilization, and outcomes; rank utilization by diagnoses; and risk adjust by clinical condition. The CCSR capitalizes on the specificity of the ICD-10-CM coding scheme and allows ICD-10-CM codes to be classified in more than one category. Approximately 10 percent of diagnosis codes are associated with more than one CCSR category because the diagnosis code documents either multiple conditions or a condition along with a common symptom or manifestation. For this Statistical Brief, the principal diagnosis code is assigned to a single default CCSR based on clinical coding guidelines, etiology and pathology of diseases, and standards set by other Federal agencies. The assignment of the default CCSR for the principal diagnosis is available starting with v2020.2 of the software tool. For this Statistical Brief, a preliminary version of the default CCSR was used. Case definition Opioid use disorder and endocarditis were defined using the all-listed ICD-9-CM and ICD-10-CM diagnosis codes shown in Tables 4 and 5, respectively. Note that the specificity of ICD-10-CM allowed for the identification of cases with opioid use and long-term use that was not previously available in ICD-9-CM. The definition of opioid use disorder in this Statistical Brief may differ from the definition used in other HCUP reports about opioid-related hospitalizations because of the specific focus on the relationship between opioids and endocarditis in this Statistical Brief. In particular, the definition used here includes not only the general opioid dependence, abuse and use, poisoning, and adverse effect codes as an initial or subsequent encounter but also opioid abuse/dependence in remission and long-term use of opiates. The definition does not include sequela codes for poisoning and adverse effects. |
| Table 4. ICD-9-CM and ICD-10-CM diagnosis codes defining opioid use disorder (OUD) | |
| Diagnosis code | Description |
|---|---|
| ICD-9-CM diagnosis codes | |
| 304.00 | Opioid type dependence, unspecified |
| 304.01 | Opioid type dependence, continuous |
| 304.02 | Opioid type dependence, episodic |
| 304.03 | Opioid type dependence, in remission |
| 304.70 | Combinations of opioid type drug with any other drug dependence, unspecified |
| 304.71 | Combinations of opioid type drug with any other drug dependence, continuous |
| 304.72 | Combinations of opioid type drug with any other drug dependence, episodic |
| 304.73 | Combinations of opioid type drug with any other drug dependence, in remission |
| 305.50 | Opioid abuse, unspecified |
| 305.51 | Opioid abuse, continuous |
| 305.52 | Opioid abuse, episodic |
| 305.53 | Opioid abuse, in remission |
| 965.00 | Poisoning by opium (alkaloids), unspecified |
| 965.01 | Poisoning by heroin |
| 965.02 | Poisoning by methadone |
| 965.09 | Poisoning by other opiates and related narcotics |
| 970.1 | Poisoning by opiate antagonists |
| E850.0 | Accidental poisoning by heroin |
| E850.1 | Accidental poisoning by methadone |
| E850.2 | Accidental poisoning by other opiates and related narcotics |
| E935.0 | Heroin causing adverse effects in therapeutic use |
| E935.1 | Methadone causing adverse effects in therapeutic use |
| E935.2 | Other opiates and related narcotics causing adverse effects in therapeutic use |
| E940.1 | Adverse effects of opiate antagonists |
| ICD-10-CM diagnosis codes | |
| Opioid abuse/dependence | |
| F11.10 | Opioid abuse, uncomplicated |
| F11.120 | Opioid abuse with intoxication, uncomplicated |
| F11.121 | Opioid abuse with intoxication, delirium |
| F11.122 | Opioid abuse with intoxication, with perceptual disturbance |
| F11.129 | Opioid abuse with intoxication, unspecified |
| F11.14 | Opioid abuse with opioid-induced mood disorder |
| F11.150 | Opioid abuse with opioid-induced psychotic disorder, with delusions |
| F11.151 | Opioid abuse with opioid-induced psychotic disorder, with hallucinations |
| F11.159 | Opioid abuse with opioid-induced psychotic disorder, unspecified |
| F11.181 | Opioid abuse with opioid-induced sexual dysfunction |
| F11.182 | Opioid abuse with opioid-induced sleep disorder |
| F11.188 | Opioid abuse with other opioid-induced disorder |
| F11.19 | Opioid abuse with unspecified opioid-induced disorder |
| F11.20 | Opioid dependence, uncomplicated |
| F11.21 | Opioid dependence, in remission |
| F11.220 | Opioid dependence with intoxication, uncomplicated |
| F11.221 | Opioid dependence with intoxication, delirium |
| F11.222 | Opioid dependence with intoxication, with perceptual disturbance |
| F11.229 | Opioid dependence with intoxication, unspecified |
| F11.23 | Opioid dependence with withdrawal |
| F11.24 | Opioid dependence with opioid-induced mood disorder |
| F11.250 | Opioid dependence with opioid-induced psychotic disorder, with delusions |
| F11.251 | Opioid dependence with opioid-induced psychotic disorder, with hallucinations |
| F11.259 | Opioid dependence with opioid-induced psychotic disorder, unspecified |
| F11.281 | Opioid dependence with opioid-induced sexual dysfunction |
| F11.282 | Opioid dependence with opioid-induced sleep disorder |
| F11.288 | Opioid dependence with other opioid-induced disorder |
| F11.29 | Opioid dependence with unspecified opioid-induced disorder |
| Opioid use | |
| F11.90 | Opioid use, unspecified, uncomplicated |
| F11.920 | Opioid use, unspecified with intoxication, uncomplicated |
| F11.921 | Opioid use, unspecified with intoxication delirium |
| F11.922 | Opioid use, unspecified with intoxication, with perceptual disturbance |
| F11.929 | Opioid use, unspecified with intoxication, unspecified |
| F11.93 | Opioid use, unspecified, with withdrawal |
| F11.94 | Opioid use, unspecified, with opioid-induced mood disorder |
| F11.950 | Opioid use, unspecified with opioid-induced psychotic disorder, with delusions |
| F11.951 | Opioid use, unspecified with opioid-induced psychotic disorder, with hallucinations |
| F11.959 | Opioid use, unspecified with opioid-induced psychotic disorder, unspecified |
| F11.981 | Opioid use, unspecified with opioid-induced sexual dysfunction |
| F11.982 | Opioid use, unspecified with opioid-induced sleep disorder |
| F11.988 | Opioid use, unspecified with other opioid-induced disorder |
| F11.99 | Opioid use, unspecified, with unspecified opioid-induced disorder |
| Poisoning | |
| T40.0X1A | Poisoning by opium, accidental (unintentional), initial encounter |
| T40.0X1D | Poisoning by opium, accidental (unintentional), subsequent encounter |
| T40.0X2A | Poisoning by opium, intentional self-harm, initial encounter |
| T40.0X2D | Poisoning by opium, intentional self-harm, subsequent encounter |
| T40.0X3A | Poisoning by opium, assault, initial encounter |
| T40.0X3D | Poisoning by opium, assault, subsequent encounter |
| T40.0X4A | Poisoning by opium, undetermined, initial encounter |
| T40.0X4D | Poisoning by opium, undetermined, subsequent encounter |
| T40.1X1A | Poisoning by heroin, accidental (unintentional), initial encounter |
| T40.1X1D | Poisoning by heroin, accidental (unintentional), subsequent encounter |
| T40.1X2A | Poisoning by heroin, intentional self-harm, initial encounter |
| T40.1X2D | Poisoning by heroin, intentional self-harm, subsequent encounter |
| T40.1X3A | Poisoning by heroin, assault, initial encounter |
| T40.1X3D | Poisoning by heroin, assault, subsequent encounter |
| T40.1X4A | Poisoning by heroin, undetermined, initial encounter |
| T40.1X4D | Poisoning by heroin, undetermined, subsequent encounter |
| T40.2X1A | Poisoning by other opioids, accidental (unintentional), initial encounter |
| T40.2X1D | Poisoning by other opioids, accidental (unintentional), subsequent encounter |
| T40.2X2A | Poisoning by other opioids, intentional self-harm, initial encounter |
| T40.2X2D | Poisoning by other opioids, intentional self-harm, subsequent encounter |
| T40.2X3A | Poisoning by other opioids, assault, initial encounter |
| T40.2X3D | Poisoning by other opioids, assault, subsequent encounter |
| T40.2X4A | Poisoning by other opioids, undetermined, initial encounter |
| T40.2X4D | Poisoning by other opioids, undetermined, subsequent encounter |
| T40.3X1A | Poisoning by methadone, accidental (unintentional), initial encounter |
| T40.3X1D | Poisoning by methadone, accidental (unintentional), subsequent encounter |
| T40.3X2A | Poisoning by methadone, intentional self-harm, initial encounter |
| T40.3X2D | Poisoning by methadone, intentional self-harm, subsequent encounter |
| T40.3X3A | Poisoning by methadone, assault, initial encounter |
| T40.3X3D | Poisoning by methadone, assault, subsequent encounter |
| T40.3X4A | Poisoning by methadone, undetermined, initial encounter |
| T40.3X4D | Poisoning by methadone, undetermined, subsequent encounter |
| T40.4X1A | Poisoning by synthetic narcotics, accidental (unintentional), initial encounter |
| T40.4X1D | Poisoning by synthetic narcotics, accidental (unintentional), subsequent encounter |
| T40.4X2A | Poisoning by other synthetic narcotics, intentional self-harm, initial encounter |
| T40.4X2D | Poisoning by other synthetic narcotics, intentional self-harm, subsequent encounter |
| T40.4X3A | Poisoning by other synthetic narcotics, assault, initial encounter |
| T40.4X3D | Poisoning by other synthetic narcotics, assault, subsequent encounter |
| T40.4X4A | Poisoning by synthetic narcotics, undetermined, initial encounter |
| T40.4X4D | Poisoning by synthetic narcotics, undetermined, subsequent encounter |
| T40.601A | Poisoning by unspecified narcotics, accidental (unintentional), initial encounter |
| T40.601D | Poisoning by unspecified narcotics, accidental (unintentional), subsequent encounter |
| T40.602A | Poisoning by unspecified narcotics, intentional self-harm, initial encounter |
| T40.602D | Poisoning by unspecified narcotics, intentional self-harm, subsequent encounter |
| T40.603A | Poisoning by unspecified narcotics, assault, initial encounter |
| T40.603D | Poisoning by unspecified narcotics, assault, subsequent encounter |
| T40.604A | Poisoning by unspecified narcotics, undetermined, initial encounter |
| T40.604D | Poisoning by unspecified narcotics, undetermined, subsequent encounter |
| T40.691A | Poisoning by other narcotics, accidental (unintentional), initial encounter |
| T40.691D | Poisoning by other narcotics, accidental (unintentional), subsequent encounter |
| T40.692A | Poisoning by other narcotics, intentional self-harm, initial encounter |
| T40.692D | Poisoning by other narcotics, intentional self-harm, subsequent encounter |
| T40.693A | Poisoning by other narcotics, assault, initial encounter |
| T40.693D | Poisoning by other narcotics, assault, subsequent encounter |
| T40.694A | Poisoning by other narcotics, undetermined, initial encounter |
| T40.694D | Poisoning by other narcotics, undetermined, subsequent encounter |
| Adverse effects | |
| T40.0X5A | Adverse effect of opium, initial encounter |
| T40.0X5D | Adverse effect of opium, subsequent encounter |
| T40.2X5A | Adverse effect of other opioids, initial encounter |
| T40.2X5D | Adverse effect of other opioids, subsequent encounter |
| T40.3X5A | Adverse effect of methadone, initial encounter |
| T40.3X5D | Adverse effect of methadone, subsequent encounter |
| T40.4X5A | Adverse effect of synthetic narcotics, initial encounter |
| T40.4X5D | Adverse effect of synthetic narcotic, subsequent encounter |
| T40.605A | Adverse effect of unspecified narcotics, initial encounter |
| T40.605D | Adverse effect of unspecified narcotics, subsequent encounter |
| T40.695A | Adverse effect of other narcotics, initial encounter |
| T40.695D | Adverse effect of other narcotics, subsequent encounter |
| Long-term use of opiates | |
| Z79.891 | Long-term (current) use of opiate analgesic |
| Abbreviations: ICD-9-CM, International Classification of Diseases, Ninth Revision, Clinical Modification; ICD-10-CM, International Classification of Diseases, Tenth Revision, Clinical Modification | |
| Table 5. ICD-9-CM and ICD-10-CM diagnosis codes defining endocarditis | |
| Diagnosis code | Description |
|---|---|
| ICD-9-CM diagnosis codes | |
| 036.42 | Meningococcal endocarditis |
| 098.84 | Gonococcal endocarditis |
| 112.81 | Candidal endocarditis |
| 115.04 | Infection by Histoplasma capsulatum, endocarditis |
| 115.14 | Infection by Histoplasma duboisii, endocarditis |
| 115.94 | Histoplasmosis, unspecified, endocarditis |
| 421.0 | Acute and subacute bacterial endocarditis |
| 421.1 | Acute and subacute infective endocarditis in diseases classified elsewhere |
| 421.9 | Acute endocarditis, unspecified |
| 424.90 | Endocarditis, valve unspecified, unspecified cause |
| 424.91 | Endocarditis in diseases classified elsewhere |
| 424.99 | Other endocarditis, valve unspecified |
| ICD-10-CM diagnosis codes | |
| A32.82 | Listerial endocarditis |
| A39.51 | Meningococcal endocarditis |
| A52.03 | Syphilitic endocarditis |
| A54.83 | Gonococcal heart infection |
| B33.21 | Viral endocarditis |
| B37.6 | Candidal endocarditis |
| I01.1 | Acute rheumatic endocarditis |
| I33.0 | Acute and subacute infective endocarditis |
| I33.9 | Acute and subacute endocarditis, unspecified |
| I38 | Endocarditis, valve unspecified |
| I39 | Endocarditis and heart valve disorders in diseases classified elsewhere |
| M32.11 | Endocarditis in systemic lupus erythematosus |
| Abbreviations: ICD-9-CM, International Classification of Diseases, Ninth Revision, Clinical Modification; ICD-10-CM, International Classification of Diseases, Tenth Revision, Clinical Modification | |
Types of hospitals included in the HCUP National (Nationwide) Inpatient Sample The National (Nationwide) Inpatient Sample (NIS) is based on data from community hospitals, which are defined as short-term, non-Federal, general, and other hospitals, excluding hospital units of other institutions (e.g., prisons). The NIS includes obstetrics and gynecology, otolaryngology, orthopedic, cancer, pediatric, public, and academic medical hospitals. Excluded are long-term care facilities such as rehabilitation, psychiatric, and alcoholism and chemical dependency hospitals. Beginning in 2012, long-term acute care hospitals are also excluded. However, if a patient received long-term care, rehabilitation, or treatment for a psychiatric or chemical dependency condition in a community hospital, the discharge record for that stay will be included in the NIS. Unit of analysis The unit of analysis is the hospital discharge (i.e., the hospital stay), not a person or patient. This means that a person who is admitted to the hospital multiple times in 1 year will be counted each time as a separate discharge from the hospital. Location of patients' residence Place of residence is based on the rural-urban continuum codes (RUCC) for U.S. counties developed by the United States Department of Agriculture (USDA).15 For this Statistical Brief, we collapsed the RUCC categories into the following three groups:
Community-level income is based on the median household income of the patient's ZIP Code of residence. Quartiles are defined so that the total U.S. population is evenly distributed. Cut-offs for the quartiles are determined annually using ZIP Code demographic data obtained from Claritas, a vendor that produces population estimates and projections based on data from the U.S. Census Bureau.16 The value ranges for the income quartiles vary by year. The income quartile is missing for patients who are homeless or foreign. Expected payer To make coding uniform across all HCUP data sources, the primary expected payer for the hospital stay combines detailed categories into general groups:
For this Statistical Brief, when more than one payer is listed for a hospital discharge, the first-listed payer is used. Discharge status Discharge status reflects the disposition of the patient at discharge from the hospital and includes the following six categories: routine (to home); transfer to another short-term hospital; other transfers (including skilled nursing facility, intermediate care, and another type of facility such as a nursing home); home health care; against medical advice (AMA); or died in the hospital. Region and division Region is one of the four regions defined by the U.S. Census Bureau. Division corresponds to the location of the hospital and is one of the nine divisions defined by the U.S. Census Bureau.
The Healthcare Cost and Utilization Project (HCUP, pronounced "H-Cup") is a family of healthcare databases and related software tools and products developed through a Federal-State-Industry partnership and sponsored by the Agency for Healthcare Research and Quality (AHRQ). HCUP databases bring together the data collection efforts of State data organizations, hospital associations, and private data organizations (HCUP Partners) and the Federal government to create a national information resource of encounter-level healthcare data. HCUP includes the largest collection of longitudinal hospital care data in the United States, with all-payer, encounter-level information beginning in 1988. These databases enable research on a broad range of health policy issues, including cost and quality of health services, medical practice patterns, access to healthcare programs, and outcomes of treatments at the national, State, and local market levels. HCUP would not be possible without the contributions of the following data collection Partners from across the United States: Alaska Department of Health and Social Services Alaska State Hospital and Nursing Home Association Arizona Department of Health Services Arkansas Department of Health California Office of Statewide Health Planning and Development Colorado Hospital Association Connecticut Hospital Association Delaware Division of Public Health District of Columbia Hospital Association Florida Agency for Health Care Administration Georgia Hospital Association Hawaii Laulima Data Alliance, a subsidiary of the Healthcare Association of Hawaii Illinois Department of Public Health Indiana Hospital Association Iowa Hospital Association Kansas Hospital Association Kentucky Cabinet for Health and Family Services Louisiana Department of Health Maine Health Data Organization Maryland Health Services Cost Review Commission Massachusetts Center for Health Information and Analysis Michigan Health & Hospital Association Minnesota Hospital Association Mississippi State Department of Health Missouri Hospital Industry Data Institute Montana Hospital Association Nebraska Hospital Association Nevada Department of Health and Human Services New Hampshire Department of Health & Human Services New Jersey Department of Health New Mexico Department of Health New York State Department of Health North Carolina Department of Health and Human Services North Dakota (data provided by the Minnesota Hospital Association) Ohio Hospital Association Oklahoma State Department of Health Oregon Association of Hospitals and Health Systems Oregon Office of Health Analytics Pennsylvania Health Care Cost Containment Council Rhode Island Department of Health South Carolina Revenue and Fiscal Affairs Office South Dakota Association of Healthcare Organizations Tennessee Hospital Association Texas Department of State Health Services Utah Department of Health Vermont Association of Hospitals and Health Systems Virginia Health Information Washington State Department of Health West Virginia Department of Health and Human Resources, West Virginia Health Care Authority Wisconsin Department of Health Services Wyoming Hospital Association About the NIS The HCUP National (Nationwide) Inpatient Sample (NIS) is a nationwide database of hospital inpatient stays. The NIS is nationally representative of all community hospitals (i.e., short-term, non-Federal, nonrehabilitation hospitals). The NIS includes all payers. It is drawn from a sampling frame that contains hospitals comprising more than 95 percent of all discharges in the United States. The vast size of the NIS allows the study of topics at the national and regional levels for specific subgroups of patients. In addition, NIS data are standardized across years to facilitate ease of use. Over time, the sampling frame for the NIS has changed; thus, the number of States contributing to the NIS varies from year to year. The NIS is intended for national estimates only; no State-level estimates can be produced. The unweighted sample size for the 2016 NIS is 7,135,090 (weighted, this represents 35,675,421 inpatient stays). For More Information For other information on mental and substance use disorders, including opioid-related hospitalizations, refer to the HCUP Statistical Briefs located at www.hcup-us.ahrq.gov/reports/statbriefs/sb_mhsa.jsp. For additional HCUP statistics, visit:
For a detailed description of HCUP and more information on the design of the National (Nationwide) Inpatient Sample (NIS), please refer to the following database documentation: Agency for Healthcare Research and Quality. Overview of the National (Nationwide) Inpatient Sample (NIS). Healthcare Cost and Utilization Project (HCUP). Rockville, MD: Agency for Healthcare Research and Quality. Updated August 2018. www.hcup-us.ahrq.gov/nisoverview.jsp. Accessed January 4, 2019. Suggested Citation Weiss AJ (IBM Watson Health), Heslin KC (George Washington University), Stocks C (West Virginia University), Owens PL (AHRQ). Hospital Inpatient Stays Related to Opioid Use Disorder and Endocarditis, 2016. HCUP Statistical Brief #256. April 2020. Agency for Healthcare Research and Quality, Rockville, MD. www.hcup-us.ahrq.gov/reports/statbriefs/sb256-Opioids-Endocarditis-Inpatient-Stays-2016.pdf. Acknowledgments The authors would like to acknowledge the contributions of Minya Sheng of IBM Watson Health. *** AHRQ welcomes questions and comments from readers of this publication who are interested in obtaining more information about access, cost, use, financing, and quality of healthcare in the United States. We also invite you to tell us how you are using this Statistical Brief and other HCUP data and tools, and to share suggestions on how HCUP products might be enhanced to further meet your needs. Please e-mail us at hcup@ahrq.gov or send a letter to the address below:Joel W. Cohen, Ph.D., Director Center for Financing, Access and Cost Trends Agency for Healthcare Research and Quality 5600 Fishers Lane Rockville, MD 20857 This Statistical Brief was posted online on April 14, 2020. 1 U.S. Department of Health and Human Services. What is the U.S. Opioid Epidemic? Updated September 4, 2019. www.hhs.gov/opioids/about-the-epidemic/index.html. Accessed February 11, 2020. 2 Scholl L, Seth P, Kariisa M, Wilson N, Baldwin G. Drug and opioid-involved overdose deaths - United States, 2013-2017. Morbidity and Mortality Weekly Report. 2019;67:1419-27. 3 Weiss AJ, Elixhauser A, Barrett ML, Steiner CA, Bailey MK, O'Malley L. Opioid-Related Inpatient Stays and Emergency Department Visits by State, 2009-2014. HCUP Statistical Brief #219. December 2016. Agency for Healthcare Research and Quality, Rockville, MD. www.hcup-us.ahrq.gov/reports/statbriefs/sb219-Opioid-Hospital-Stays-ED-Visits-by-State.pdf. Accessed March 22, 2019. 4 Ibid. 5 McCarthy NL, Baggs J, Jernigan JA, Reddy SJ, See I, Fiore AE. National Trends of Infective Endocarditis and Other Infections Associated With Substance Use Disorder. AcademyHealth Annual Research Meeting, Washington, DC, June 2019. 6 Ronan MV, Herzig SJ. Hospitalizations related to opioid abuse/dependence and associated serious infections increased sharply, 2002-12. Health Affairs. 2016;35(5):832-7. 7 Ibid. 8 Mayo Clinic. Endocarditis. www.mayoclinic.org/diseases-conditions/endocarditis/symptoms-causes/syc-20352576. 9Yang E, Frazee BW. Infective endocarditis. Emergency Medicine Clinics of North America. 2018;36:645-63. 10 Prendergast BD, Tornos P. Surgery for infective endocarditis: who and when? Circulation. 2010;121(9):1141-52. 11 Cleveland Clinic. Infective endocarditis surgery. Updated July 19, 2019. my.clevelandclinic.org/health/treatments/17125-infective-endocarditis-surgery. 12 Because of the change in clinical coding system in 2015, from the International Classification of Diseases Ninth Revision, Clinical Modification (ICD-9-CM) to the International Classification of Diseases, Tenth Revision, Clinical Modification (ICD-10-CM), the coding and identification of stays related to opioid use disorder and/or endocarditis changed. For example, beginning in 2016, ICD-10-CM codes became available to identify cases with opioid use and opiate long-term use. Thus, we describe the trends based on data from the period 2005-2014 and 2016 separately. 13 Barrett M, Coffey R, Levit K. Population Denominator Data for Use with the HCUP Databases (Updated with 2016 Population Data). HCUP Methods Series Report #2017-04. October 17, 2017. U.S. Agency for Healthcare Research and Quality. www.hcup-us.ahrq.gov/reports/methods/2017-04.pdf. Accessed January 4, 2019. 14 Agency for Healthcare Research and Quality. HCUP Clinical Classifications Software Refined (CCSR) for ICD-10-CM Diagnoses. Healthcare Cost and Utilization Project (HCUP). Agency for Healthcare Research and Quality. Updated January 2020. www.hcup-us.ahrq.gov/toolssoftware/ccs/ccs.jsp. Accessed February 3, 2020. 15 United States Department of Agriculture. Rural-Urban Continuum Codes. Updated October 25,2019. www.ers.usda.gov/data-products/rural-urban-continuum-codes/. Accessed June 26, 2019. 16 Claritas. Claritas Demographic Profile by ZIP Code. https://claritas360.claritas.com/mybestsegments/. |
| Supplemental Table 1. Number of inpatient stays related to opioid use disorder and/or endocarditis, 2005-2016, for data presented in Figure 1. | |||
| Year | OUD-endocarditis | OUD | Endocarditis |
|---|---|---|---|
| 2005 | 3,007 | 416,173 | 61,081 |
| 2010 | 3,232 | 643,933 | 62,671 |
| 2014 | 6,685 | 747,735 | 66,210 |
| 2016 | 13,125 | 1,313,314 | 80,695 |
| Supplemental Table 2. Expected primary payer of inpatient stays related to opioid use disorder and/or endocarditis, 2016, for data presented in Figure 2. | |||
| Expected primary payer | OUD-endocarditis, % | OUD, % | Endocarditis, % |
|---|---|---|---|
| Medicare | 17.4 | 40.2 | 62.0 |
| Medicaid | 54.1 | 30.9 | 14.2 |
| Private insurance | 12.6 | 20.2 | 17.2 |
| Self-pay/no charge | 13.3 | 5.5 | 4.1 |
| Other payers | 2.4 | 3.1 | 2.3 |
| Supplemental Table 3. Discharge status of inpatient stays related to opioid use disorder and/or endocarditis, 2016, for data presented in Figure 3. | |||
| Discharge disposition | OUD-endocarditis, % | OUD, % | Endocarditis, % |
|---|---|---|---|
| Routine and home health | 37.5 | 74.2 | 48.6 |
| Transfer to acute care hospital | 11.2 | 2.0 | 9.0 |
| Transfer to other facilities | 27.8 | 16.7 | 31.6 |
| Died in the hospital | 5.6 | 1.5 | 8.9 |
| Against medical advice | 17.8 | 5.4 | 1.9 |
| Internet Citation: Statistical Brief #256. Healthcare Cost and Utilization Project (HCUP). April 2020. Agency for Healthcare Research and Quality, Rockville, MD. hcup-us.ahrq.gov/reports/statbriefs/sb256-Opioids-Endocarditis-Inpatient-Stays-2016.jsp. |
| Are you having problems viewing or printing pages on this website? |
| If you have comments, suggestions, and/or questions, please contact hcup@ahrq.gov. |
| If you are experiencing issues related to Section 508 accessibility of information on this website, please contact hcup@ahrq.gov. |
| Privacy Notice, Viewers & Players |
| Last modified 4/14/20 |