|
STATISTICAL BRIEF #280
August 2021
Pamela L. Owens, Ph.D., Richard J. Manski, D.D.S., M.B.A., Ph.D., and Audrey J. Weiss, Ph.D. Introduction Oral health contributes to overall wellbeing and improved quality of life. Untreated poor dental health also can lead to negative general health outcomes.1 Most oral diseases tend to be progressive and cumulative without intervention.2 Tooth decay and periodontal disease are among the most prevalent chronic diseases worldwide and have been shown to be associated with a number of life-threatening conditions, including sepsis, diabetes, and heart disease.2,3 Despite the increasing need for dental care, many Americans delay or do not receive it. Failure to receive treatment may make necessary the provision of less definitive and more costly care. Individuals who lack a usual source for dental care may visit hospital emergency departments (EDs) to seek relief for dental pain and related conditions.4,5 The cost of dental-related visits to the ED is high, totaling more than $2 billion nationally in 2017.6 This Healthcare Cost and Utilization Project (HCUP) Statistical Brief presents statistics on ED visits involving dental conditions using weighted estimates from the 2018 Nationwide Emergency Department Sample (NEDS). Characteristics of dental-related ED visits, including visits that result in discharge from the ED (treat and release) and visits that result in admission to the hospital, are presented. The most common dental conditions are identified by type of ED visit. For ED visits with a dental condition as a secondary diagnosis, the most frequent first-listed or principal nondental conditions are presented. Because of the large sample size of the NEDS data, small differences can be statistically significant but not clinically important. Thus, only differences greater than or equal to 10 percent are discussed in the text. Findings Characteristics of ED visits related to dental conditions, 2018 Table 1 presents characteristics of ED visits related to dental conditions by type of ED visit—all ED visits, treat-and-release ED visits, and ED visits resulting in hospital admission—compared with all other non-dental-related ED visits. |
| Table 1. Characteristics of dental-related ED visits, by type of ED visit, 2018 | ||||
| Characteristic | ED visits related to dental conditions | All other non-dental-related ED visits | ||
|---|---|---|---|---|
| All ED visits | Treat-and-release ED visits | ED visits resulting in hospital admission | ||
| Number | 2,009,800 | 1,899,500 | 110,300 | 141,444,600 |
| Rate per 100,000 population | ||||
| Overall | 615.5 | 581.7 | 33.8 | 43,317.1 |
| Age group, years | ||||
| 0-17 | 290.0 | 276.8 | 13.2 | 38,532.5 |
| 18-44 | 1,107.4 | 1,073.9 | 33.5 | 43,599.2 |
| 45-64 | 473.5 | 429.9 | 43.6 | 39,354.5 |
| 65-84 | 201.7 | 156.7 | 45.0 | 50,529.9 |
| 85 and older | 197.6 | 129.7 | 67.8 | 94,206.1 |
| Sex | ||||
| Male | 594.1 | 556.3 | 37.8 | 39,309.7 |
| Female | 636.3 | 606.3 | 29.9 | 47,198.8 |
| Race/Ethnicity | ||||
| Black, non-Hispanic | 1,362.4 | 1,306.9 | 55.6 | 69,407.1 |
| Hispanic | 406.3 | 383.0 | 23.4 | 39,186.2 |
| White, non-Hispanic | 520.9 | 489.4 | 31.4 | 37,907.0 |
| Other, non-Hispanic | 454.6 | 423.8 | 30.8 | 38,749.9 |
| Patient residence | ||||
| Large metropolitan | 506.3 | 473.7 | 32.6 | 39,983.1 |
| Medium/small metropolitan | 680.9 | 646.1 | 34.8 | 44,329.6 |
| Micropolitan | 931.0 | 897.1 | 33.8 | 53,398.4 |
| Noncore (rural) | 808.3 | 777.7 | 30.6 | 51,216.2 |
| Community-level income | ||||
| Quartile 1 (lowest) | 1,069.1 | 1,018.3 | 50.8 | 62,982.1 |
| Quartile 2 | 705.7 | 670.9 | 34.8 | 45,847.4 |
| Quartile 3 | 412.2 | 386.5 | 25.7 | 34,216.3 |
| Quartile 4 (highest) | 245.9 | 225.3 | 20.6 | 27,864.4 |
| Abbreviation: ED, emergency department Notes: Number of stays is rounded to the nearest hundred. Age, sex, and location of patient residence were each missing for less than 1% of ED visits, race/ethnicity was missing for less than 3% of ED visits, and community-level income was missing for less than 2% of ED visits. Source: Agency for Healthcare Research and Quality (AHRQ), Healthcare Cost and Utilization Project (HCUP), Nationwide Emergency Department Sample (NEDS), 2018 | ||||
|
|
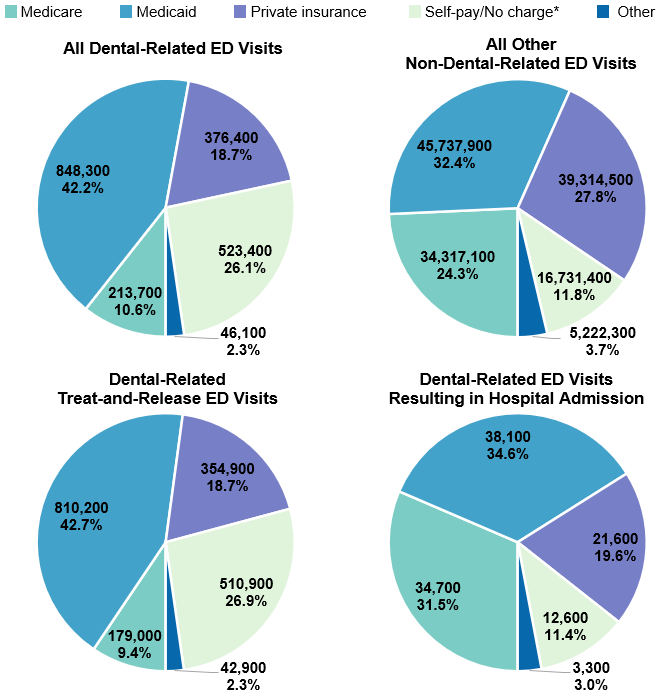
Figure 1. Number and percentage of dental-related ED visits for each expected payer, by type of ED visit, 2018
Abbreviation: ED, emergency department Pie charts that show the primary expected payer mix of dental-related emergency department (ED) visits versus all other nondental-related ED visits, by type of ED visit (all dental-related visits, treat-and-release visits, and visits resulting in hospital admission), in 2018. All dental-related ED visits: Medicare, 213,700 (10.6%); Medicaid, 848,300 (42.2%); private insurance, 376,400 (18.7%); self-pay/no charge, 523,400 (26.1%); other, 46,100 (2.3%). All other nondental-related ED visits: Medicare, 34,317,100 (24.3%); Medicaid, 45,737,900 (32.4%); private insurance, 39,314,500 (27.8%); self-pay/no charge, 16,731,400 (11.8%); other, 5,222,300 (3.7%). Treat-and-release dental-related ED visits: Medicare, 179,000 (9.4%); Medicaid, 810,200 (42.7%); private insurance, 354,900 (18.7%); self-pay/no charge, 510,900 (26.9%); other, 42,900 (2.3%). Dental-related ED visits resulting in hospital admission: Medicare, 34,700 (31.5%); Medicaid, 38,100 (34.6%); private insurance, 21,600 (19.6%); self-pay/no charge, 12,600 (11.4%); other, 3,300 (3.0%).
|
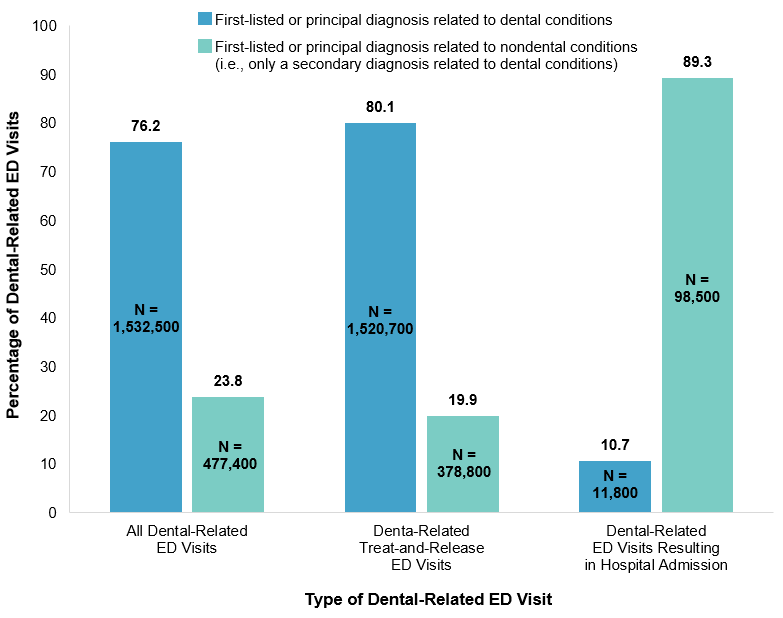
Figure 2 displays the percentage of ED visits specifically for a dental condition (i.e., the dental condition was the first-listed diagnosis for treat-and-release ED visits or the principal diagnosis for ED visits resulting in hospital admission) versus those ED visits primarily for a nondental condition where a dental condition was a secondary diagnosis, by type of ED visit. |
|
Figure 2. Percentage of dental-related ED visits, by first-listed or principal versus secondary diagnosis and type of ED visit, 2018
Abbreviations: ED, emergency department; N, number of ED visits Bar chart that shows the number and percentage of dental-related ED visits in 2018 broken out (1) by principal diagnosis related to dental conditions versus principal diagnosis related to nondental conditions and (2) by type of ED visit (all dental-related visits, treat-and-release visits, and visits resulting in hospital admission). All dental-related ED visits: dental-related first-listed diagnosis, 1,532,500 (76.2%); nondental-related first-listed diagnosis, 477,400 (23.8%). Dental-related treat-and-release ED visits: dental-related first-listed diagnosis, 1,520,700 (80.1%); nondental-related first-listed diagnosis, 378,800 (19.9%). Dental-related ED visits resulting in hospital admission: dental-related first-listed diagnosis, 11,800 (10.7%); nondental-related first-listed diagnosis, 98,500 (89.3%).
|
|
| Table 2. Top five most common groups of dental conditions among ED visits, by type of ED visit, 2018 | ||||||
| Diagnosis by dental condition group* | All dental-related ED visits | Dental-related treat-and-release ED visits | Dental-related ED visits resulting in hospital admission | |||
|---|---|---|---|---|---|---|
| Number | Percent | Number | Percent | Number | Percent | |
| First-listed or principal diagnosis | 1,532,500 | 100.0 | 1,520,700 | 100.0 | 11,800 | 100.0 |
| Loss of teeth and similar disorders of teeth and supporting structures | 584,400 | 38.1 | 584,300 | 38.4 | 100 | 1.2 |
| Diseases of pulp and periapical tissues | 513,900 | 33.5 | 503,800 | 33.1 | 10,100 | 85.3 |
| Dental caries | 323,300 | 21.1 | 322,900 | 21.2 | 400 | 3.1 |
| Gingival disorders | 45,400 | 3.0 | 44,900 | 3.0 | 500 | 4.2 |
| Cracked tooth and other diseases of hard tissues of teeth | 20,300 | 1.3 | 20,300 | 1.3 | - | - |
| Periodontitis | - | - | - | - | 700 | 5.6 |
| Secondary diagnosis only | 477,300 | 100.0 | 378,800 | 100.0 | 98,500 | 100.0 |
| Loss of teeth and similar disorders of teeth and supporting structures | 318,100 | 66.6 | 295,400 | 78.0 | 22,700 | 23.1 |
| Diseases of pulp and periapical tissues | 150,400 | 31.5 | 118,900 | 31.4 | 31,500 | 31.9 |
| Dental caries | 292,000 | 61.2 | 255,400 | 67.4 | 36,600 | 37.1 |
| Gingival disorders | 50,700 | 10.6 | 41,600 | 11.0 | 9,100 | 9.2 |
| Cracked tooth and other diseases of hard tissues of teeth | 33,100 | 6.9 | 31,300 | 8.3 | - | - |
| Periodontitis | - | - | - | - | 7,700 | 7.8 |
| Any-listed diagnosis | 2,009,800 | 100.0 | 1,899,500 | 100.0 | 110,300 | 100.0 |
| Loss of teeth and similar disorders of teeth and supporting structures | 902,500 | 44.9 | 879,600 | 46.3 | 22,900 | 20.7 |
| Diseases of pulp and periapical tissues | 664,300 | 33.1 | 622,700 | 32.8 | 41,600 | 37.7 |
| Dental caries | 615,300 | 30.6 | 578,300 | 30.4 | 36,900 | 33.5 |
| Gingival disorders | 96,100 | 4.8 | 86,500 | 4.6 | 9,600 | 8.7 |
| Cracked tooth and other diseases of hard tissues of teeth | 53,400 | 2.7 | 51,600 | 2.7 | - | - |
| Periodontitis | - | - | - | - | 8,400 | 7.6 |
| Abbreviations: ED, emergency department; ICD-10-CM, International Classification of Diseases, Tenth Revision, Clinical Modification Notes: Number of stays is rounded to the nearest hundred. Percentages are calculated from unrounded values. Counts of stays with any-listed dental diagnosis include those stays with a first-listed or principal dental diagnosis. Condition groups that were not in the top five for the type of ED visit are denoted with a "-". For secondary diagnosis only and any-listed diagnosis, the sum across dental-related condition groups may exceed 100% because an ED visit may include more than one dental-related condition group. * See Appendix A for a list of ICD-10-CM diagnoses by dental condition grouping. Source: Agency for Healthcare Research and Quality (AHRQ), Healthcare Cost and Utilization Project (HCUP), Nationwide Emergency Department Sample (NEDS), 2018 | ||||||
|
| Table 3. Top five first-listed or principal nondental conditions among ED visits with a dental condition as a secondary diagnosis only, by type of ED visit, 2018 | ||||||
| First-listed or principal diagnosis (CCSR) | All dental-related ED visits | Dental-related treat-and-release ED visits | Dental-related ED visits resulting in hospital admission | |||
|---|---|---|---|---|---|---|
| Number | Percent | Number | Percent | Number | Percent | |
| First-listed or principal diagnosis of a nondental condition | 477,400 | 100.0 | 378,800 | 100.0 | 98,500 | 100.0 |
| Fracture of head and neck, initial encounter (INJ001) | 28,300 | 5.9 | 24,700> | 6.5 | 3,600 | 3.6 |
| Skin and subcutaneous tissue infections (SKN001) | 26,300 | 5.5 | 19,500 | 5.2 | 6,800 | 6.9 |
| Other specified complications in pregnancy (PRG028)* | 21,800 | 4.6 | 21,300 | 5.6 | - | - |
| Other specified upper respiratory infections (RSP006)† | 20,100 | 4.2 | 19,400 | 5.1 | - | - |
| Headache; including migraine (NVS010) | 17,800 | 3.7 | 17,700 | 4.7 | - | - |
| Septicemia (INF002) | - | - | - | - | 13,000 | 13.2 |
| Diseases of mouth; excluding dental (DIG003) | - | - | - | - | 4,200 | 4.2 |
| Diabetes mellitus with complication (END003) | - | - | - | - | 3,600 | 3.6 |
| Abbreviations: CCSR, Clinical Classifications Software Refined for ICD-10-CM Diagnoses, v.2021.1; ED, emergency department; ICD-10-CM, International Classification of Diseases, Tenth Revision, Clinical Modification Notes: Diagnoses are grouped using the Clinical Classifications Software Refined (CCSR) for ICD-10-CM Diagnoses. First-listed or principal diagnosis is assigned to a single default CCSR category. Number of stays is rounded to the nearest hundred. Percentages are calculated from unrounded values. Diagnoses that were not in the top five for the type of ED visit are denoted with a "-". * Includes diseases of the digestive system complicating pregnancy and childbirth and other complications of pregnancy. † Includes acute upper respiratory infection, acute and streptococcal pharyngitis, and acute nasopharyngitis (the common cold). Source: Agency for Healthcare Research and Quality (AHRQ), Healthcare Cost and Utilization Project (HCUP), Nationwide Emergency Department Sample (NEDS), 2018 | ||||||
|
| Appendix A. ICD-10-CM dental-related diagnosis codes in CCSR DIG002, Disorders of Teeth and Gingiva, by groups of dental conditions | ||||||
| ICD-10-CM code | ICD-10-CM code description | ICD-10-CM code | ICD-10-CM code description | |||
|---|---|---|---|---|---|---|
| Disorders of tooth development and eruption | ||||||
| K000 | Anodontia | K005 | Hereditary disturbances in tooth structure, not elsewhere classified | |||
| K001 | Supernumerary teeth | K006 | Disturbances in tooth eruption | |||
| K002 | Abnormalities of size and form of teeth | K007 | Teething syndrome | |||
| K003 | Mottled teeth | K008 | Other disorders of tooth development | |||
| K004 | Disturbances in tooth formation | K009 | Disorder of tooth development, unspecified | |||
| Embedded and impacted teeth | ||||||
| K010 | Embedded teeth | K011 | Impacted teeth | |||
| Dental caries | ||||||
| K023 | Arrested dental caries | K0262 | Dental caries on smooth surface penetrating into dentin | |||
| K0251 | Dental caries on pit and fissure surface limited to enamel | K0263 | Dental caries on smooth surface penetrating into pulp | |||
| K0252 | Dental caries on pit and fissure surface penetrating into dentin | K027 | Dental root caries | |||
| K0253 | Dental caries on pit and fissure surface penetrating into pulp | K029 | Dental caries, unspecified | |||
| K0261 | Dental caries on smooth surface limited to enamel | |||||
| Cracked tooth and other diseases of hard tissues of teeth | ||||||
| K030 | Excessive attrition of teeth | K036 | Deposits [accretions] on teeth | |||
| K031 | Abrasion of teeth | K037 | Posteruptive color changes of dental hard tissues | |||
| K032 | Erosion of teeth | K0381 | Cracked tooth | |||
| K033 | Pathological resorption of teeth | K0389 | Other specified diseases of hard tissues of teeth | |||
| K034 | Hypercementosis | K039 | Disease of hard tissues of teeth, unspecified | |||
| K035 | Ankylosis of teeth | |||||
| Dislocation of tooth | ||||||
| S032XXA | Dislocation of tooth, initial encounter | S032XXS | Dislocation of tooth, sequela | |||
| S032XXD | Dislocation of tooth, subsequent encounter | |||||
| Diseases of pulp and periapical tissues | ||||||
| K040 | Pulpitis | K045 | Chronic apical periodontitis | |||
| K0401 | Reversible pulpitis | K046 | Periapical abscess with sinus | |||
| K0402 | Irreversible pulpitis | K047 | Periapical abscess without sinus | |||
| K041 | Necrosis of pulp | K048 | Radicular cyst | |||
| K042 | Pulp degeneration | K0490 | Unspecified diseases of pulp and periapical tissues | |||
| K043 | Abnormal hard tissue formation in pulp | K0499 | Other diseases of pulp and periapical tissues | |||
| K044 | Acute apical periodontitis of pulpal origin | |||||
| Gingival disorders | ||||||
| K0500 | Acute gingivitis, plaque induced | K06020 | Generalized gingival recession, unspecified | |||
| K0501 | Acute gingivitis, non-plaque induced | K06021 | Generalized gingival recession, minimal | |||
| K0510 | Chronic gingivitis, plaque induced | K06022 | Generalized gingival recession, moderate | |||
| K0511 | Chronic gingivitis, non-plaque induced | K06023 | Generalized gingival recession, severe | |||
| K060 | Gingival recession | K061 | Gingival enlargement | |||
| K06010 | Localized gingival recession, unspecified | K062 | Gingival and edentulous alveolar ridge lesions associated with trauma | |||
| K06011 | Localized gingival recession, minimal | K063 | Horizontal alveolar bone loss | |||
| K06012 | Localized gingival recession, moderate | K068 | Other specified disorders of gingiva and edentulous alveolar ridge | |||
| K06013 | Localized gingival recession, severe | K069 | Disorder of gingiva and edentulous alveolar ridge, unspecified | |||
| Periodontitis | ||||||
| K0520 | Aggressive periodontitis, unspecified | K05311 | Chronic periodontitis, localized, slight | |||
| K0521 | Aggressive periodontitis, localized | K05312 | Chronic periodontitis, localized, moderate | |||
| K0521 | Aggressive periodontitis, localized, slight | K05313 | Chronic periodontitis, localized, severe | |||
| K05212 | Aggressive periodontitis, localized, moderate | K05319 | Chronic periodontitis, localized, unspecified severity | |||
| K05213 | Aggressive periodontitis, localized, severe | K0532 | Chronic periodontitis, generalized | |||
| K05219 | Aggressive periodontitis, localized, unspecified severity | K05321 | Chronic periodontitis, generalized, slight | |||
| K0522 | Aggressive periodontitis, generalized | K05322 | Chronic periodontitis, generalized, moderate | |||
| K05221 | Aggressive periodontitis, generalized, slight | K05323 | Chronic periodontitis, generalized, severe | |||
| K05222 | Aggressive periodontitis, generalized, moderate | K05329 | Chronic periodontitis, generalized, unspecified severity | |||
| K05223 | Aggressive periodontitis, generalized, severe | K054 | Periodontosis | |||
| K05229 | Aggressive periodontitis, generalized, unspecified severity | K055 | Other periodontal diseases | |||
| K0530 | Chronic periodontitis, unspecified | K056 | Periodontal disease, unspecified | |||
| K0531 | Chronic periodontitis, localized | |||||
| Loss of teeth and similar disorders of teeth and supporting structures | ||||||
| K080 | Exfoliation of teeth due to systemic causes | K08404 | Partial loss of teeth, unspecified cause, class IV | |||
| K08101 | Complete loss of teeth, unspecified cause, class I | K08409 | Partial loss of teeth, unspecified cause, unspecified class | |||
| K08102 | Complete loss of teeth, unspecified cause, class II | K08411 | Partial loss of teeth due to trauma, class I | |||
| K08103 | Complete loss of teeth, unspecified cause, class III | K08412 | Partial loss of teeth due to trauma, class II | |||
| K08104 | Complete loss of teeth, unspecified cause, class IV | K08413 | Partial loss of teeth due to trauma, class III | |||
| K08109 | Complete loss of teeth, unspecified cause, unspecified class | K08414 | Partial loss of teeth due to trauma, class IV | |||
| K08111 | Complete loss of teeth due to trauma, class I | K08419 | Partial loss of teeth due to trauma, unspecified class | |||
| K08112 | Complete loss of teeth due to trauma, class II | K08421 | Partial loss of teeth due to periodontal diseases, class I | |||
| K08113 | Complete loss of teeth due to trauma, class III | K08422 | Partial loss of teeth due to periodontal diseases, class II | |||
| K08114 | Complete loss of teeth due to trauma, class IV | K08423 | Partial loss of teeth due to periodontal diseases, class III | |||
| K08119 | Complete loss of teeth due to trauma, unspecified class | K08424 | Partial loss of teeth due to periodontal diseases, class IV | |||
| K08121 | Complete loss of teeth due to periodontal diseases, class I | K08429 | Partial loss of teeth due to periodontal diseases, unspecified class | |||
| K08122 | Complete loss of teeth due to periodontal diseases, class II | K08431 | Partial loss of teeth due to caries, class I | |||
| K08123 | Complete loss of teeth due to periodontal diseases, class III | K08432 | Partial loss of teeth due to caries, class II | |||
| K08124 | Complete loss of teeth due to periodontal diseases, class IV | K08433 | Partial loss of teeth due to caries, class III | |||
| K08129 | Complete loss of teeth due to periodontal diseases, unspecified class | K08434 | Partial loss of teeth due to caries, class IV | |||
| K08131 | Complete loss of teeth due to caries, class I | K08439 | Partial loss of teeth due to caries, unspecified class | |||
| K08132 | Complete loss of teeth due to caries, class II | K08491 | Partial loss of teeth due to other specified cause, class I | |||
| K08133 | Complete loss of teeth due to caries, class III | K08492 | Partial loss of teeth due to other specified cause, class II | |||
| K08134 | Complete loss of teeth due to caries, class IV | K08493 | Partial loss of teeth due to other specified cause, class III | |||
| K08139 | Complete loss of teeth due to caries, unspecified class | K08494 | Partial loss of teeth due to other specified cause, class IV | |||
| K08191 | Complete loss of teeth due to other specified cause, class I | K08499 | Partial loss of teeth due to other specified cause, unspecified class | |||
| K08192 | Complete loss of teeth due to other specified cause, class II | K0850 | Unsatisfactory restoration of tooth, unspecified | |||
| K08193 | Complete loss of teeth due to other specified cause, class III | K0851 | Open restoration margins of tooth | |||
| K08194 | Complete loss of teeth due to other specified cause, class IV | K0852 | Unrepairable overhanging of dental restorative materials | |||
| K08199 | Complete loss of teeth due to other specified cause, unspecified class | K08530 | Fractured dental restorative material without loss of material | |||
| K0820 | Unspecified atrophy of edentulous alveolar ridge | K08531 | Fractured dental restorative material with loss of material | |||
| K0821 | Minimal atrophy of the mandible | K08539 | Fractured dental restorative material, unspecified | |||
| K0822 | Moderate atrophy of the mandible | K0854 | Contour of existing restoration of tooth biologically incompatible with oral health | |||
| K0823 | Severe atrophy of the mandible | K0855 | Allergy to existing dental restorative material | |||
| K0824 | Minimal atrophy of maxilla | K0856 | Poor aesthetic of existing restoration of tooth | |||
| K0825 | Moderate atrophy of the maxilla | K0859 | Other unsatisfactory restoration of tooth | |||
| K0826 | Severe atrophy of the maxilla | K088 | Other specified disorders of teeth and supporting structures | |||
| K083 | Retained dental root | K0881 | Primary occlusal trauma | |||
| K08401 | Partial loss of teeth, unspecified cause, class I | K0882 | Secondary occlusal trauma | |||
| K08402 | Partial loss of teeth, unspecified cause, class II | K0889 | Other specified disorders of teeth and supporting structures | |||
| K08403 | Partial loss of teeth, unspecified cause, class III | K089 | Disorder of teeth and supporting structures, unspecified | |||
| Cysts of oral region, not elsewhere classified | ||||||
| K090 | Developmental odontogenic cysts | K091 | Developmental (nonodontogenic) cysts of oral region | |||
| Dentofacial anomalies | ||||||
| M2600 | Unspecified anomaly of jaw size | M2633 | Horizontal displacement of fully erupted tooth or teeth | |||
| M2601 | Maxillary hyperplasia | M2634 | Vertical displacement of fully erupted tooth or teeth | |||
| M2602 | Maxillary hypoplasia | M2635 | Rotation of fully erupted tooth or teeth | |||
| M2603 | Mandibular hyperplasia | M2636 | Insufficient interocclusal distance of fully erupted teeth (ridge) | |||
| M2604 | Mandibular hypoplasia | M2637 | Excessive interocclusal distance of fully erupted teeth | |||
| M2605 | Macrogenia | M2639 | Other anomalies of tooth position of fully erupted tooth or teeth | |||
| M2606 | Microgenia | M264 | Malocclusion, unspecified | |||
| M2607 | Excessive tuberosity of jaw | M2650 | Dentofacial functional abnormalities, unspecified | |||
| M2609 | Other specified anomalies of jaw size | M2651 | Abnormal jaw closure | |||
| M2610 | Unspecified anomaly of jaw-cranial base relationship | M2652 | Limited mandibular range of motion | |||
| M2611 | Maxillary asymmetry | M2653 | Deviation in opening and closing of the mandible | |||
| M2612 | Other jaw asymmetry | M2654 | Insufficient anterior guidance | |||
| M2619 | Other specified anomalies of jaw-cranial base relationship | M2655 | Centric occlusion maximum intercuspation discrepancy | |||
| M2620 | Unspecified anomaly of dental arch relationship | M2656 | Non-working side interference | |||
| M26211 | Malocclusion, Angles class I | M2657 | Lack of posterior occlusal support | |||
| M26212 | Malocclusion, Angles class II | M2659 | Other dentofacial functional abnormalities | |||
| M26213 | Malocclusion, Angles class III | M2670 | Unspecified alveolar anomaly | |||
| M26219 | Malocclusion, Angles class, unspecified | M2671 | Alveolar maxillary hyperplasia | |||
| M26220 | Open anterior occlusal relationship | M2672 | Alveolar mandibular hyperplasia | |||
| M26221 | Open posterior occlusal relationship | M2673 | Alveolar maxillary hypoplasia | |||
| M2623 | Excessive horizontal overlap | M2674 | Alveolar mandibular hypoplasia | |||
| M2624 | Reverse articulation | M2679 | Other specified alveolar anomalies | |||
| M2625 | Anomalies of interarch distance | M2681 | Anterior soft tissue impingement | |||
| M2629 | Other anomalies of dental arch relationship | M2682 | Posterior soft tissue impingement | |||
| M2630 | Unspecified anomaly of tooth position of fully erupted tooth or teeth | M2689 | Other dentofacial anomalies | |||
| M2631 | Crowding of fully erupted teeth | M269 | Dentofacial anomaly, unspecified | |||
| M2632 | Excessive spacing of fully erupted teeth | |||||
| Other diseases of jaws | ||||||
| M273 | Alveolitis of jaws | M2761 | Osseointegration failure of dental implant | |||
| M2751 | Perforation of root canal space due to endodontic treatment | M2762 | Post-osseointegration biological failure of dental implant | |||
| M2752 | Endodontic overfill | M2763 | Post-osseointegration mechanical failure of dental implant | |||
| M2753 | Endodontic underfill | M2769 | Other endosseous dental implant failure | |||
| M2759 | Other periradicular pathology associated with previous endodontic treatment | |||||
| Abbreviations: CCSR, Clinical Classifications Software Refined for ICD-10-CM Diagnoses, v.2021.1; ICD-10-CM, International Classification of Diseases, Tenth Revision, Clinical Modification | ||||||
References
1 Joshipura KJ, Rimm EB, Douglass CW, Trichopoulos D, Ascherio A, Willett WC. Poor oral health and coronary heart disease. Journal of Dental Research. 1996;75(9):1631-6 2 National Institute of Dental and Craniofacial Research. Oral Health in America: A Report of the Surgeon General. 2000. Rockville, MD: U.S. Department of Health and Human Services, National Institutes of Health, National Institute of Dental and Craniofacial Research. www.nidcr.nih.gov/sites/default/files/2017-10/hck1ocv.%40www.surgeon.fullrpt.pdf. Accessed June 30, 2021. 3 Eke PI, Dye BA, Wei L, Slade GD, Thornton-Evans GO, Borgnakke WS, et al. Update on prevalence of periodontitis in adults in the United States: NHANES 2009-2012. Journal of Periodontology. 2015;86(5):611-22. 4 Cohen LA, Manski RJ, Magder LS, Mullins D. A Medicaid population's use of physicians' offices for dental problems. American Journal of Public Health. 2003;93(8):1297-301. 5 Cohen LA, Manski RJ, Magder LS, Mullins D. Dental visits to hospital emergency departments by adults receiving Medicaid: assessing their use. Journal of the American Dental Association. 2002;133(6):715-24. 6 American Dental Association Health Policy Institute. Emergency Department Visits for Dental Conditions - A Snapshot. April 2020. www.ada.org/~/media/ADA/Science%20and%20Research/HPI/Files/HPIgraphic_0420_1.pdf?la=en. Accessed June 29, 2021. About Statistical Briefs Healthcare Cost and Utilization Project (HCUP) Statistical Briefs provide basic descriptive statistics on a variety of topics using HCUP administrative healthcare data. Topics include hospital inpatient, ambulatory surgery, and emergency department use and costs, quality of care, access to care, medical conditions, procedures, and patient populations, among other topics. The reports are intended to generate hypotheses that can be further explored in other research; the reports are not designed to answer in-depth research questions using multivariate methods. Data Source The estimates in this Statistical Brief are based upon data from the HCUP 2018 Nationwide Emergency Department Sample (NEDS).a Supplemental sources included population denominator data for use with HCUP databases, derived from information available from Claritas, a vendor that produces population estimates and projections based on data from the U.S. Census Bureau.b Definitions Diagnoses, ICD-10-CM, and Clinical Classifications Software Refined (CCSR) for ICD-10-CM Diagnoses For emergency department (ED) visits that are treated and released, the first-listed diagnosis represents the condition, symptom, or problem identified in the medical record to be chiefly responsible for the ED services provided. In cases where the first-listed diagnosis is a symptom or problem, a diagnosis has not been established (confirmed) by the provider. For ED visits that result in an inpatient admission, the first-listed diagnosis is the principal diagnosis, the condition established after study to be chiefly responsible for the patient's admission to the hospital. Secondary diagnoses are conditions that coexist at the time of the ED visit or inpatient admission, that require or affect patient care treatment received or management, or that develop during the inpatient stay. All-listed diagnoses include the first-listed (principal) diagnosis plus the secondary conditions. ICD-10-CM is the International Classification of Diseases, Tenth Revision, Clinical Modification. There are over 70,000 ICD-10-CM diagnosis codes. The CCSR aggregates ICD-10-CM diagnosis codes into a manageable number of clinically meaningful categories.c The CCSR is intended to be used analytically to examine patterns of healthcare in terms of cost, utilization, and outcomes; rank utilization by diagnoses; and risk-adjust by clinical condition. The CCSR capitalizes on the specificity of the ICD-10-CM coding scheme and allows ICD-10-CM codes to be classified in more than one category. Approximately 10 percent of diagnosis codes are associated with more than one CCSR category because the diagnosis code documents either multiple conditions or a condition along with a common symptom or manifestation. For this Statistical Brief, the principal diagnosis code is assigned to a single default CCSR based on clinical coding guidelines, etiology and pathology of diseases, and standards set by other Federal agencies. The assignment of the default CCSR for the first-listed diagnosis for outpatient data is available starting with version v2021.1 of the software tool. ICD-10-CM coding definitions for each CCSR category presented in this Statistical Brief can be found in the CCSR reference file, available at www.hcup-us.ahrq.gov/toolssoftware/ccsr/ccs_refined.jsp#download. For this Statistical Brief, v2021.1 of the CCSR was used. Case definition Dental-related ED visits were defined as those with any ICD-10-CM diagnosis code in CCSR DIG002, Disorders of Teeth and Gingiva. DIG002 includes 229 ICD-10-CM diagnosis codes related to dental caries, cysts in the oral region, dentofacial anomalies, periodontitis, diseases of pulp and periapical tissues, dislocation of a tooth, disorders of tooth development and eruption, embedded or impacted teeth, gingival disorders, cracked tooth and other disease of hard tissues of teeth, other diseases of the jaw, and loss of teeth and similar disorders of teeth and supporting structures (Appendix A). Types of hospitals included in the HCUP Nationwide Emergency Department Sample The Nationwide Emergency Department Sample (NEDS) is based on ED data from community acute care hospitals, which are defined as short-term, non-Federal, general, and other specialty hospitals available to the public. Included among community hospitals are pediatric institutions and hospitals that are part of academic medical centers. Excluded are long-term care facilities such as rehabilitation, psychiatric, and alcoholism and chemical dependency hospitals. Hospitals included in the NEDS have EDs, and no more than 90 percent of their ED visits result in admission. Unit of analysis The unit of analysis is the ED visit, not a person or patient. This means that a person who is seen in the ED multiple times in 1 year will be counted each time as a separate visit in the ED. Population rates Rates of ED visits per 100,000 population were calculated using 2018 ED visit totals in the numerator and Claritasd estimates of the 2018 U.S. population in the denominator. Individual patients seen in the ED multiple times are counted more than once in the numerator. Population rate of ED visits related to dental conditions equals number of dental-related ED visits divided by the number of U.S. residents times 100,000 Reporting of race and ethnicity Data on Hispanic ethnicity are collected differently among the States and also can differ from the census methodology of collecting information on race (White, Black, Asian/Pacific Islander, American Indian/Alaska Native, Other [including mixed race]) separately from ethnicity (Hispanic, non-Hispanic). State data organizations often collect Hispanic ethnicity as one of several categories that include race. Therefore, for multistate analyses, HCUP creates the combined categorization of race and ethnicity for data from States that report ethnicity separately. When a State data organization collects Hispanic ethnicity separately from race, HCUP uses Hispanic ethnicity to override any other race category to create a Hispanic category for the uniformly coded race/ethnicity data element, while also retaining the original race and ethnicity data. This Statistical Brief reports race/ethnicity for the following categories: Hispanic, non-Hispanic Black, non-Hispanic White, and non-Hispanic Other. Location of patients' residence Place of residence is based on the urban-rural classification scheme for U.S. counties developed by the National Center for Health Statistics (NCHS) and based on the Office of Management and Budget (OMB) definition of a metropolitan service area as including a city and a population of at least 50,000 residents:
Community-level income Community-level income is based on the median household income of the patient's ZIP Code of residence. Quartiles are defined so that the total U.S. population is evenly distributed. Cut-offs for the quartiles are determined annually using ZIP Code demographic data obtained from Claritas, a vendor that produces population estimates and projections based on data from the U.S. Census Bureau.e The value ranges for the income quartiles vary by year. The income quartile is missing for patients who are homeless or foreign. Expected payer To make coding uniform across all HCUP data sources, the primary expected payer for the ED visit combines detailed categories into general groups:
For this Statistical Brief, when more than one payer is listed for an ED visit, the first-listed payer is used. About HCUP The Healthcare Cost and Utilization Project (HCUP, pronounced "H-Cup") is a family of healthcare databases and related software tools and products developed through a Federal-State-Industry partnership and sponsored by the Agency for Healthcare Research and Quality (AHRQ). HCUP databases bring together the data collection efforts of State data organizations, hospital associations, and private data organizations (HCUP Partners) and the Federal government to create a national information resource of encounter-level healthcare data. HCUP includes the largest collection of longitudinal hospital care data in the United States, with all-payer, encounter-level information beginning in 1988. These databases enable research on a broad range of health policy issues, including cost and quality of health services, medical practice patterns, access to healthcare programs, and outcomes of treatments at the national, State, and local market levels. HCUP would not be possible without the contributions of the following data collection Partners from across the United States: |
|
Alaska Department of Health and Social Services Alaska State Hospital and Nursing Home Association Arizona Department of Health Services Arkansas Department of Health California Office of Statewide Health Planning and Development Colorado Hospital Association Connecticut Hospital Association Delaware Division of Public Health District of Columbia Hospital Association Florida Agency for Health Care Administration Georgia Hospital Association Hawaii Laulima Data Alliance Hawaii University of Hawai'i at Hilo Illinois Department of Public Health Indiana Hospital Association Iowa Hospital Association Kansas Hospital Association Kentucky Cabinet for Health and Family Services Louisiana Department of Health Maine Health Data Organization Maryland Health Services Cost Review Commission Massachusetts Center for Health Information and Analysis Michigan Health & Hospital Association Minnesota Hospital Association Mississippi State Department of Health Missouri Hospital Industry Data Institute |
Montana Hospital Association Nebraska Hospital Association Nevada Department of Health and Human Services New Hampshire Department of Health & Human Services New Jersey Department of Health New Mexico Department of Health New York State Department of Health North Carolina Department of Health and Human Services North Dakota (data provided by the Minnesota Hospital Association) Ohio Hospital Association Oklahoma State Department of Health Oregon Association of Hospitals and Health Systems Oregon Office of Health Analytics Pennsylvania Health Care Cost Containment Council Rhode Island Department of Health South Carolina Revenue and Fiscal Affairs Office South Dakota Association of Healthcare Organizations Tennessee Hospital Association Texas Department of State Health Services Utah Department of Health Vermont Association of Hospitals and Health Systems Virginia Health Information Washington State Department of Health West Virginia Department of Health and Human Resources, West Virginia Health Care Authority Wisconsin Department of Health Services Wyoming Hospital Association |
|
About the NEDS
The HCUP Nationwide Emergency Department Sample (NEDS) is a unique and powerful database that yields national estimates of emergency department (ED) visits. The NEDS was constructed using records from both the HCUP State Emergency Department Databases (SEDD) and the State Inpatient Databases (SID). The SEDD capture information on ED visits that do not result in an admission (i.e., patients who were treated in the ED and then released from the ED, or patients who were transferred to another hospital); the SID contain information on patients initially seen in the ED and then admitted to the same hospital. The NEDS was created to enable analyses of ED utilization patterns and support public health professionals, administrators, policymakers, and clinicians in their decision making regarding this critical source of care. The NEDS is produced annually beginning in 2006. Over time, the sampling frame for the NEDS has changed; thus, the number of States contributing to the NEDS varies from year to year. The NEDS is intended for national estimates only; no State-level estimates can be produced. The unweighted sample size for the 2018 NEDS is 35,807,950 (weighted, this represents 143,454,430 ED visits). For More Information For previous information on ED visits related to dental conditions, refer to the HCUP Statistical Brief located at www.hcup-us.ahrq.gov/reports/statbriefs/sb143.pdf. For additional HCUP statistics, visit:
For a detailed description of HCUP and more information on the design of the Nationwide Emergency Department Sample (NEDS), please refer to the following database documentation: Agency for Healthcare Research and Quality. Overview of the Nationwide Emergency Department Sample (NEDS). Healthcare Cost and Utilization Project (HCUP). Rockville, MD: Agency for Healthcare Research and Quality. Updated November 2020. www.hcup-us.ahrq.gov/nedsoverview.jsp. Accessed January 22, 2021. Suggested Citation Owens PL (AHRQ), Manski RJ (AHRQ), Weiss AJ (IBM Watson Health). Emergency Department Visits Involving Dental Conditions, 2018. HCUP Statistical Brief #280. August 2021. Agency for Healthcare Research and Quality, Rockville, MD. www.hcup-us.ahrq.gov/reports/statbriefs/sb280-Dental-ED-Visits-2018.pdf. Acknowledgments The authors would like to acknowledge the contributions of Minya Sheng of IBM Watson Health and Marguerite Barrett of M.L. Barrett, Inc. *** AHRQ welcomes questions and comments from readers of this publication who are interested in obtaining more information about access, cost, use, financing, and quality of healthcare in the United States. We also invite you to tell us how you are using this Statistical Brief and other HCUP data and tools, and to share suggestions on how HCUP products might be enhanced to further meet your needs. Please email us at hcup@ahrq.gov or send a letter to the address below:Joel W. Cohen, Ph.D., Director Center for Financing, Access and Cost Trends Agency for Healthcare Research and Quality 5600 Fishers Lane Rockville, MD 20857 This Statistical Brief was posted online on August 19, 2021. a Note that race/ethnicity data are not included on the publicly available NEDS. b Claritas. Claritas Demographic Profile by ZIP Code. https://claritas360.claritas.com/mybestsegments/. c Agency for Healthcare Research and Quality. HCUP Clinical Classifications Software Refined (CCSR) for ICD-10-CM Diagnoses. Healthcare Cost and Utilization Project (HCUP). Agency for Healthcare Research and Quality. Updated March 2021. www.hcup-us.ahrq.gov/toolssoftware/ccsr/dxccsr.jsp. Accessed June 14, 2021. d Claritas. Claritas Demographic Profile by ZIP Code. https://claritas360.claritas.com/mybestsegments/. e Claritas. Claritas Demographic Profile by ZIP Code. https://claritas360.claritas.com/mybestsegments/. |
| Internet Citation: Statistical Brief #280. Healthcare Cost and Utilization Project (HCUP). August 2021. Agency for Healthcare Research and Quality, Rockville, MD. hcup-us.ahrq.gov/reports/statbriefs/sb280-Dental-ED-Visits-2018.jsp. |
| Are you having problems viewing or printing pages on this website? |
| If you have comments, suggestions, and/or questions, please contact hcup@ahrq.gov. |
| If you are experiencing issues related to Section 508 accessibility of information on this website, please contact hcup@ahrq.gov. |
| Privacy Notice, Viewers & Players |
| Last modified 8/26/21 |