|
STATISTICAL BRIEF #281
August 2021
Kimberly W. McDermott, Ph.D., and Lan Liang, Ph.D. Introduction More than one-quarter of inpatient stays in the United States involve at least one operating room (OR) procedure.1 On average, these stays are more than twice as costly as stays without OR procedures.1 With surgical care accounting for nearly one-third of healthcare spending in the United States,2 identifying the volume, costs, and characteristics of OR procedures can help guide cost reduction efforts and provide baseline data for assessing the potential impact of changes in reimbursement policy and advances in medical technology. This Healthcare Cost and Utilization Project (HCUP) Statistical Brief presents statistics on OR procedures performed during inpatient stays using the 2018 National Inpatient Sample (NIS).a Inpatient stays with and without OR procedures are compared in terms of patient characteristics, utilization characteristics, and outcomes. Additionally, the most common all-listed and most costly principal OR procedures are presented overall and by patient sex-age group. Because of the large sample size of the NIS data, small differences can be statistically significant. Thus, only differences greater than or equal to 10 percent are discussed in the text. Findings Inpatient stays with and without OR procedures, 2018 Figure 1 shows the percentage of all inpatient stays with OR procedures and the percentage of aggregate costs attributed to stays involving OR procedures in 2018. |
|
Figure 1. Percentage of inpatient stays and aggregate costs for stays with and without OR procedures, 2018
Abbreviation: OR, operating room Bar chart that shows the percentage of inpatient stays with and without operating room (OR) procedures and aggregate costs attributed to stays with and without OR procedures in 2018. Inpatient stays (N = 35,527,500): 27.0% of inpatient stays with OR procedures and 73.0% of stays without OR procedures. Aggregate costs ($448,811 million): 47.3 percent of costs attributed to stays with OR procedures and 52.7% attributed to stays without OR procedures.
|
|
| Table 1. Utilization and outcomes for inpatient stays with and without OR procedures, 2018 | |||
| Characteristic or outcome | Stays with OR procedures | Stays without OR procedures | |
|---|---|---|---|
| Any OR procedure | Principal OR procedure | ||
| Number of stays, N | 9,605,500 | 8,425,900 | 25,922,000 |
| All hospital stays, % | 27.0 | 23.7 | 73.0 |
| Rate of stays per 100,000 population | 2,941.7 | 2,580.4 | 7,938.6 |
| Aggregate costs, $ millions | 210,312 | 188,512 | 234,498 |
| Aggregate costs, % | 47.3 | 42.4 | 52.7 |
| Mean cost per stay, $ | 21,900 | 22,400 | 9,000 |
| Mean length of stay, days | 5.1 | 5.1 | 4.5 |
| Admitted from emergency department, % | 33.1 | 33.5 | 63.3 |
| Discharge status, % | |||
| Routine (to home) or to home healthcare | 82.8 | 81.9 | 79.7 |
| Transfer to another short-term hospital | 0.7 | 0.7 | 2.4 |
| Transfer to other type of facility | 14.8 | 15.8 | 13.8 |
| Died in the hospital | 1.3 | 1.2 | 2.2 |
| Other* | 0.3 | 0.3 | 1.8 |
| Abbreviation: OR, operating room Notes: Number of stays and mean cost per stay are rounded to the nearest hundred. Discharge status was missing for less than 1 percent of stays. * Other discharges include alive/destination unknown and against medical advice. Source: Agency for Healthcare Research and Quality (AHRQ), Healthcare Cost and Utilization Project (HCUP), National Inpatient Sample (NIS), 2018 | |||
|
|
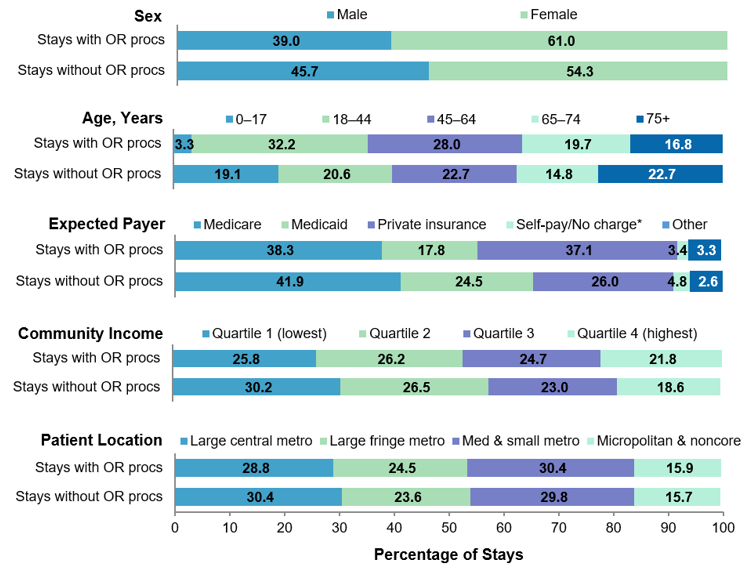
Figure 2. Inpatient stays with and without OR procedures, by patient characteristic, 2018
Abbreviations: Med, medium; metro, metropolitan; OR, operating room; procs, procedures Bar chart that shows the distribution of inpatient stays with and without operating room (OR) procedures in 2018 by patient sex, age group, primary expected payer, community-level income, and patient location. Data are provided in Supplemental Table 1.
|
Table 2 presents the 20 most common all-listed OR procedures during inpatient stays in 2018. Specifically, the total number of procedures and the population rate are provided, as well as the percentage of all OR procedures and the percentage of stays with an OR procedure that the procedures represent. Because more than one OR procedure can be performed during an inpatient stay, the denominators for these two percentage calculations are distinct. |
| Table 2. Most frequent all-listed OR procedures, 2018 | |||||
| Rank | All-listed OR procedure | Number of procedures | Rate per 100,000 population | Percent of all OR procedures | Percent of stays with an OR procedure |
|---|---|---|---|---|---|
| 1 | Cesarean section | 1,167,700 | 357.6 | 8.1 | 12.2 |
| 2 | Knee arthroplasty | 715,200 | 219.0 | 5.0 | 7.4 |
| 3 | Perineal muscle laceration repair (second-degree or greater obstetrical and other) | 688,400 | 210.8 | 4.8 | 7.2 |
| 4 | Hip arthroplasty | 599,500 | 183.6 | 4.2 | 6.2 |
| 5 | Percutaneous coronary intervention | 481,800 | 147.5 | 3.4 | 5.0 |
| 6 | Spine fusion | 455,500 | 139.5 | 3.2 | 4.7 |
| 7 | Cholecystectomy | 335,200 | 102.7 | 2.3 | 3.5 |
| 8 | Femur fixation | 307,300 | 94.1 | 2.1 | 3.2 |
| 9 | Colectomy | 298,600 | 91.5 | 2.1 | 3.1 |
| 10 | Vertebral discectomy | 285,600 | 87.5 | 2.0 | 3.0 |
| 11 | Subcutaneous tissue and fascia excision | 241,100 | 73.8 | 1.7 | 2.5 |
| 12 | Gastrointestinal system lysis of adhesions | 238,000 | 72.9 | 1.7 | 2.5 |
| 13 | Bone excision | 277,700 | 69.7 | 1.6 | 2.4 |
| 14 | Saphenous vein harvest and other therapeutic vessel removal | 223,900 | 68.6 | 1.6 | 2.3 |
| 15 | Fallopian tube ligation and excision | 223,000 | 68.3 | 1.6 | 2.3 |
| 16 | Angioplasty and related vessel procedures (endovascular; excluding carotid) | 201,800 | 61.8 | 1.4 | 2.1 |
| 17 | Coronary artery bypass graft | 201,600 | 61.7 | 1.4 | 2.1 |
| 18 | Salpingectomy | 191,200 | 58.6 | 1.3 | 2.0 |
| 19 | Appendectomy | 190,000 | 58.2 | 1.3 | 2.0 |
| 20 | Musculoskeletal procedures, not elsewhere classified | 184,800 | 56.6 | 1.3 | 1.9 |
| Top 20 OR procedures (6,501,000 stays) | 7,457,900 | 2,284.0 | 51.9 | 67.7 | |
| All OR procedures (9,605,500 stays) | 14,365,200 | 4,399.3 | 100.0 | 100.0 | |
| Abbreviations: ICD-10-PCS, International Classification of Diseases, Tenth Revision, Procedure Coding System; OR, operating room Notes: Number of procedures is rounded to the nearest hundred. Percentage is based on unrounded data values. Procedures were identified using the Clinical Classifications Software Refined (CCSR) for ICD-10-PCS Procedures. Procedure totals include only one occurrence of a CCSR category per inpatient stay because multiple codes may be used for related procedures performed during a single operation. The overall number of procedures represents the sum of all CCSR category totals. Although some procedures are specific to the female population (e.g., cesarean section and perineal muscle laceration repair), the population denominator used to calculate the rate includes both sexes. Source: Agency for Healthcare Research and Quality (AHRQ), Healthcare Cost and Utilization Project (HCUP), National Inpatient Sample (NIS), 2018 | |||||
|
| Table 3. Most frequent all-listed OR procedures by sex-age group, 2018 | |||||||
| Males | Females | ||||||
|---|---|---|---|---|---|---|---|
| Rank | All-listed OR procedure | Number of OR procedures | Rate per 100,000 population | Rank | All-listed OR procedure | Number of OR procedures | Rate per 100,000 population |
| Ages 0-17 years | 270,100 | 717.3 | Ages 0-17 years | 228,500 | 633.3 | ||
| 1 | Appendectomy | 26,000 | 69.1 | 1 | Appendectomy | 17,400 | 48.1 |
| 2 | Bone fixation excluding extremities | 8,800 | 23.4 | 2 | Perineal muscle laceration repair* | 9,700 | 26.8 |
| 3 | Musculoskeletal procedures, not elsewhere classified | 8,500 | 22.6 | 3 | Spine fusion | 8,800 | 24.4 |
| 4 | Upper GI therapeutic procedures, not elsewhere classified | 8,500 | 22.6 | 4 | Bone fixation, excluding extremities | 8,100 | 22.3 |
| 5 | Femur fixation | 8,300 | 22.0 | 5 | Cesarean section | 7,700 | 21.4 |
| Ages 18-44 years | 818,500 | 1,386.4 | Ages 18-44 years | 3,328,700 | 5,769.3 | ||
| 1 | Fixation of leg and foot bones | 34,100 | 57.7 | 1 | Cesarean section | 1,154,700 | 2,001.3 |
| 2 | Appendectomy | 33,300 | 56.4 | 2 | Perineal muscle laceration repair* | 676,500 | 1,172.5 |
| 3 | Subcutaneous tissue and fascia excision | 29,500 | 50.0 | 3 | Fallopian tube ligation, excision | 216.600 | 375.4 |
| 4 | Bone excision | 28,900 | 48.9 | 4 | Salpingectomy | 84,100 | 145.8 |
| 5 | Spine fusion | 27,900 | 47.2 | 5 | Cholecystectomy | 77,300 | 134.0 |
| Ages 45-64 years | 2,233,000 | 5,432.3 | Ages 45-64 years | 2,202,400 | 5,102.5 | ||
| 1 | PCI | 146,400 | 356.2 | 1 | Knee arthroplasty | 164,200 | 380.5 |
| 2 | Knee arthroplasty | 110,500 | 268.8 | 2 | Spine fusion | 103,100 | 238.9 |
| 3 | Hip arthroplasty | 99,400 | 241.9 | 3 | Hip arthroplasty | 99,200 | 229.7 |
| 4 | Spine fusion | 96,000 | 233.6 | 4 | Hysterectomy | 77,200 | 178.8 |
| 5 | Vertebral discectomy | 65,000 | 158.1 | 5 | Salpingectomy | 76,000 | 176.1 |
| Ages 65-74 years | 1,512,800 | 10,568.3 | Ages 65-74 years | 1,454,300 | 8,930.9 | ||
| 1 | Knee arthroplasty | 107,100 | 748.3 | 1 | Knee arthroplasty | 170,200 | 1,045.0 |
| 2 | PCI | 90,800 | 634.2 | 2 | Hip arthroplasty | 112,100 | 688.3 |
| 3 | Hip arthroplasty | 77,800 | 534.8 | 3 | Spine fusion | 66,800 | 410.4 |
| 4 | Spine fusion | 61,400 | 428.6 | 4 | PCI | 46,600 | 286.0 |
| 5 | Saphenous vein harvest† | 60,000 | 418.9 | 5 | Colectomy | 42,600 | 261.5 |
| Age 75+ years | 1,065,500 | 12,330.6 | Ages 65-74 years | 1,248,400 | 9,958.1 | ||
| 1 | PCI | 69,500 | 804.2 | 1 | Hip arthroplasty | 127,000 | 1,012.8 |
| 2 | Hip arthroplasty | 65,000 | 752.7 | 2 | Femur fixation | 122,100 | 974.0 |
| 3 | Knee arthroplasty | 57,000 | 659.2 | 3 | Knee arthroplasty | 96,300 | 768.0 |
| 4 | Femur fixation | 42,900 | 496.8 | 4 | PCI | 51,400 | 410.0 |
| 5 | Saphenous vein harvest† | 32,900 | 380.8 | 5 | Colectomy | 38,700 | 308.5 |
| Abbreviations: GI, gastrointestinal; ICD-10-PCS, International Classification of Diseases, Tenth Revision, Procedure Coding System; OR, operating room; PCI, percutaneous coronary intervention Notes: Number of procedures is rounded to the nearest hundred. Procedures were identified using the Clinical Classifications Software Refined (CCSR) for ICD-10-PCS Procedures. Procedure totals include only one occurrence of a CCSR category per inpatient stay because multiple codes may be used for related procedures performed during a single operation. The overall number of procedures represents the sum of all CCSR category totals. The population denominators used to calculate rates are sex and age-group specific. * Includes second-degree obstetrical and other repair. † Includes other therapeutic vessel removal, such as destruction of superior vena cava and excision of coronary vein. Source: Agency for Healthcare Research and Quality (AHRQ), Healthcare Cost and Utilization Project (HCUP), National Inpatient Sample (NIS), 2018 | |||||||
Because hospital costs represent an overall inpatient stay and are not specific to a single procedure, the following tables focus on OR procedures that are the principal procedure for the stay. Because a stay has only one principal procedure, the total number of stays with a principal procedure is equivalent to the total number of principal procedures. Table 4 presents the 20 most costly principal OR procedures in 2018. For stays with each principal OR procedure, the aggregate cost, mean cost per stay, and total number of stays are presented. OR procedures are ranked by aggregate cost on the left side of the table and by mean cost per stay on the right side. Stays with a non-OR principal procedure, including those involving an OR procedure (e.g., principal procedure of spontaneous vaginal delivery with secondary procedure of perineal muscle laceration repair), are excluded. |
| Table 4. Most costly stays with a principal OR procedure, 2018 | |||||||||
| Ranked by aggregate cost | Ranked by mean cost per stay | ||||||||
|---|---|---|---|---|---|---|---|---|---|
| Rank | Principal OR procedure | Aggregate cost, $ millions | Mean cost per stay, $ | Number of stays | Rank | Principal OR procedure | Aggregate cost, $ millions | Mean cost per stay, $ | Number of stays |
| 1 | Spine fusion | 14,145 | 33,800 | 418,700 | 1 | Heart transplant | 1,012 | 304,300 | 3,300 |
| 2 | Knee arthroplasty | 11,877 | 16,800 | 705,100 | 2 | Lung transplant | 476 | 220,700 | 2,200 |
| 3 | Hip arthroplasty | 10,468 | 17,700 | 591,700 | 3 | Heart and great vessel bypass | 738 | 159,100 | 4,600 |
| 4 | PCI | 9,391 | 23,500 | 399,000 | 4 | Liver transplant | 1,119 | 149,400 | 7,500 |
| 5 | Cesarean section | 8,598 | 7,500 | 1,150,200 | 5 | Heart assist device procs | 1,924 | 128,400 | 15,000 |
| 6 | CABG | 7,322 | 46,800 | 156,600 | 6 | Tracheostomy | 3,583 | 107,600 | 33,300 |
| 7 | Colectomy | 6,080 | 25,900 | 234,600 | 7 | Ventriculostomy (percutaneous) | 861 | 67,200 | 12,800 |
| 8 | Heart valve replacement (non-endovascular)* | 5,627 | 60,400 | 93,200 | 8 | Kidney transplant | 1,326 | 65,600 | 20,200 |
| 9 | Femur fixation | 5,455 | 20,000 | 272,500 | 9 | Heart valve replacement (non-endovascular)* | 5,627 | 60,400 | 93,200 |
| 10 | Cholecystectomy | 4,332 | 15,100 | 286,500 | 10 | Septal repair† | 971 | 60,300 | 16,100 |
| 11 | Angioplasty‡ | 4,010 | 31,600 | 126,900 | 11 | Vessel repair, replacement | 1,523 | 58,900 | 25,800 |
| 12 | Tracheostomy | 3,583 | 107,600 | 33,300 | 12 | Select CNS drainage procs§ | 758 | 54,800 | 13,800 |
| 13 | Heart valve replacement (endovascular)* | 3,440 | 48,100 | 71,600 | 13 | Other coronary artery procs (not PCI or CABG) | 165 | 50,600 | 3,300 |
| 14 | Aneurysm repair | 2,839 | 44,100 | 64,300 | 14 | Esophagectomy | 197 | 50,000 | 4,000 |
| 15 | Subcutaneous tissue and fascia excision | 2,789 | 19,700 | 141,800 | 15 | Heart valve replacement (endovascular)* | 3,440 | 48,100 | 71,600 |
| 16 | Arthroplasty of joint other than knee or hip | 2,768 | 19,300 | 143,100 | 16 | CABG | 7,322 | 46,800 | 156,600 |
| 17 | Pacemaker, defibrillator procs | 2,703 | 40,900 | 66,100 | 17 | Decompressive craniectomy | 437 | 46,700 | 9,400 |
| 18 | Fixation of leg and foot bones | 2,673 | 20,000 | 133,600 | 18 | Ligation and embolization of vessels | 2,133 | 46,500 | 45,900 |
| 19 | CNS excision procs | 2,587 | 30,600 | 70,700 | 19 | Gastrostomy | 193 | 44,300 | 4,400 |
| 20 | Small bowel resection | 2,322 | 29,600 | 78,400 | 20 | Aneurysm repair | 2,839 | 44,100 | 64,300 |
| Top 20 | 113,009 | 21,600 | 5,237,900 | Top 20 | 36,646 | 60,400 | 607,200 | ||
| All principal OR procs | 188,512 | 22,400 | 8,425,900 | All principal OR procs | 188,512 | 22,400 | 8,425,900 | ||
| Abbreviations: CABG, coronary artery bypass graft; CNS, central nervous system; ICD-10-PCS, International Classification of Diseases, Tenth Revision, Procedure Coding System; OR, operating room; PCI, percutaneous coronary intervention; procs, procedures Notes: A minimum volume threshold of 1,000 stays was applied for top procedures by mean cost. Mean cost per stay and number of stays are rounded to the nearest hundred. Procedures were identified using the Clinical Classifications Software Refined (CCSR) for ICD-10-PCS Procedures. * Includes heart valve replacement and other valve procedures. † Includes septal repair and other therapeutic heart procedures. ‡ Includes angioplasty and related vessel procedures (endovascular, excluding carotid). § Includes CNS drainage procedures other than minimally invasive CNS biopsy, lumbar puncture, spinal canal and spinal cord drainage, intracranial epidural and subdural space drainage, and percutaneous ventriculostomy. Source: Agency for Healthcare Research and Quality (AHRQ), Healthcare Cost and Utilization Project (HCUP), National Inpatient Sample (NIS), 2018 | |||||||||
|
| Table 5. Most costly stays with a principal OR procedure by sex-age group, 2018 | |||||||||
| Males | Females | ||||||||
|---|---|---|---|---|---|---|---|---|---|
| Rank | Principal OR procedure | Aggregate cost, $ millions | Percent of all aggregate costs | Number of stays | Rank | Principal OR procedure | Aggregate cost, $ millions | Percent of all aggregate costs | Number of stays |
| Ages 0-17 years | 6,201 | 100.0 | 153,400 | Ages 0-17 years | 5,014 | 100.0 | 127,200 | ||
| 1 | Heart and great vessel bypass | 406 | 6.6 | 2,500 | 1 | Spine fusion | 472 | 9.4 | 8,300 |
| 2 | Tracheostomy | 338 | 5.5 | 1,000 | 2 | Heart and great vessel bypass | 302 | 6.0 | 1,700 |
| 3 | Appendectomy | 298 | 4.8 | 23,800 | 3 | Septal repair* | 295 | 5.9 | 3,700 |
| 4 | Septal repair* | 285 | 4.6 | 3,500 | 4 | Tracheostomy | 220 | 4.4 | 700 |
| 5 | Spine fusion | 252 | 4.1 | 4,100 | 5 | Appendectomy | 194 | 3.9 | 15,500 |
| Ages 18-44 years | 12,082 | 100.0 | 463,300 | Ages 18-44 years | 20,104 | 100.0 | 1,798,500 | ||
| 1 | Spine fusion | 851 | 7.0 | 24,400 | 1 | Cesarean section | 8,491 | 42.2 | 1,137,500 |
| 2 | Fixation of leg and foot bones | 567 | 4.7 | 25,500 | 2 | Cholecystectomy | 858 | 4.3 | 70,300 |
| 3 | Bone fixation† | 446 | 3.7 | 16,700 | 3 | Spine fusion | 742 | 3.7 | 23,900 |
| 4 | Femur fixation | 443 | 3.7 | 14,300 | 4 | Gastrectomy | 678 | 3.4 | 59,800 |
| 5 | Colectomy | 429 | 3.5 | 15,800 | 5 | Hysterectomy | 521 | 2.6 | 46,700 |
| Ages 45-64 years | 34,925 | 100.0 | 1,309,400 | Ages 45-64 years | 27,770 | 100.0 | 1,244,200 | ||
| 1 | Spine fusion | 2,852 | 8.2 | 87,600 | 1 | Spine fusion | 2,940 | 10.6 | 95,200 |
| 2 | PCI | 2,766 | 7.9 | 123,200 | 2 | Knee arthroplasty | 2,718 | 9.8 | 162,100 |
| 3 | CABG | 2,204 | 6.3 | 49,100 | 3 | Hip arthroplasty | 1,702 | 6.1 | 98,200 |
| 4 | Knee arthroplasty | 1,856 | 5.3 | 108,700 | 4 | Colectomy | 1,066 | 3.8 | 45,700 |
| 5 | Hip arthroplasty | 1,716 | 4.9 | 98,400 | 5 | PCI | 1,038 | 3.7 | 46,000 |
| Ages 65-74 years | 24,147 | 100.0 | 905,700 | Ages 65-74 years | 20,857 | 100.0 | 895,700 | ||
| 1 | CABG | 2,060 | 8.5 | 44,800 | 1 | Knee arthroplasty | 2,782 | 13.3 | 168,500 |
| 2 | Spine fusion | 1,990 | 8.2 | 56,800 | 2 | Spine fusion | 2,117 | 10.2 | 62,300 |
| 3 | PCI | 1,790 | 7.4 | 74,800 | 3 | Hip arthroplasty | 1,905 | 9.1 | 110,900 |
| 4 | Knee arthroplasty | 1,768 | 7.3 | 105,600 | 4 | PCI | 939 | 4.5 | 38,600 |
| 5 | Hip arthroplasty | 1,333 | 5.5 | 77,000 | 5 | Colectomy | 826 | 4.0 | 33,900 |
| Age 75+ years | 18,084 | 100.0 | 684,400 | Age 75+ years | 19,308 | 100.0 | 843,300 | ||
| 1 | PCI | 1,393 | 7.7 | 55,400 | 1 | Hip arthroplasty | 2,267 | 11.7 | 124,800 |
| 2 | Heart valve replacement (endovascular)‡ | 1,274 | 7.0 | 26,800 | 2 | Femur fixation | 2,023 | 10.5 | 113,500 |
| 3 | Hip arthroplasty | 1,201 | 6.6 | 63,900 | 3 | Knee arthroplasty | 1,612 | 8.4 | 95,100 |
| 4 | CABG | 1,118 | 6.2 | 22,400 | 4 | Heart valve replacement (endovascular)‡ | 1,147 | 5.9 | 24,500 |
| 5 | Knee arthroplasty | 949 | 5.2 | 56,100 | 5 | PCI | 1,041 | 5.4 | 41,400 |
| Abbreviations: CABG, coronary artery bypass graft; ICD-10-PCS, International Classification of Diseases, Tenth Revision, Procedure Coding System; OR, operating room; PCI, percutaneous coronary intervention Notes: Number of stays is rounded to the nearest hundred. Percentage is based on unrounded data values. Procedures were identified using the Clinical Classifications Software Refined (CCSR) for ICD-10-PCS Procedures. * Includes septal repair and other therapeutic heart procedures. † Excludes extremities. ‡ Includes heart valve replacement and other valve procedures (endovascular). Source: Agency for Healthcare Research and Quality (AHRQ), Healthcare Cost and Utilization Project (HCUP), National Inpatient Sample (NIS), 2018 | |||||||||
|
References
1 McDermott KW, Freeman WJ, Elixhauser A. Overview of Operating Room Procedures During Inpatient Stays in U.S. Hospitals, 2014. HCUP Statistical Brief #233. December 2017. Agency for Healthcare Research and Quality, Rockville, MD. www.hcup-us.ahrq.gov/reports/statbriefs/sb233-Operating-Room-Procedures-United-States-2014.pdf. Accessed March 5, 2021. 2 Mũnoz E, Mũnoz W III, Wise L. National and surgical health care expenditures, 2005-2025. Annals of Surgery. 2010;251(2):195-200. About Statistical Briefs Healthcare Cost and Utilization Project (HCUP) Statistical Briefs provide basic descriptive statistics on a variety of topics using HCUP administrative healthcare data. Topics include hospital inpatient, ambulatory surgery, and emergency department use and costs, quality of care, access to care, medical conditions, procedures, and patient populations, among other topics. The reports are intended to generate hypotheses that can be further explored in other research; the reports are not designed to answer in-depth research questions using multivariate methods. Data Source The estimates in this Statistical Brief are based upon data from the HCUP 2018 National Inpatient Sample (NIS). Supplemental sources included population denominator data for use with HCUP databases, derived from information available from Claritas, a vendor that produces population estimates and projections based on data from the U.S. Census Bureau.b Definitions Procedures, ICD-10-PCS, Clinical Classifications Software Refined (CCSR) for ICD-10-PCS Procedures, diagnosis-related groups (DRGs), Procedure Classes All-listed procedures include all procedures performed during the hospital stay, whether for definitive treatment or for diagnostic or exploratory purposes. The first-listed procedure is the procedure that is listed first on the discharge record. Inpatient data define this as the principal procedure—the procedure that is performed for definitive treatment rather than for diagnostic or exploratory purposes (i.e., the procedure that was necessary to take care of a complication). ICD-10-PCS is the International Classification of Diseases, Tenth Revision, Procedure Coding System, which went into effect on October 1, 2015. There are over 75,000 ICD-10-PCS procedure codes. The CCSR aggregates ICD-10-PCS procedure codes into a manageable number of clinically meaningful categories.c The CCSR is intended to be used analytically to examine patterns of healthcare in terms of cost, utilization, and outcomes, as well as to perform rank utilization by procedures. ICD-10-PCS coding definitions for each CCSR category presented in this Statistical Brief can be found in the CCSR reference file, available at www.hcup-us.ahrq.gov/toolssoftware/ccsr/prccsr.jsp. For this Statistical Brief, v2021.1 of the CCSR was used. DRGs comprise a patient classification system that categorizes patients into groups that are clinically coherent and homogeneous with respect to resource use. DRGs group patients according to diagnosis, type of treatment (procedure), age, and other relevant criteria. Each hospital stay has one assigned DRG. Major operating room (OR) procedures were defined using the Procedure Classes Refined for ICD-10-PCS software, which categorizes each ICD-10-PCS procedure code as either major therapeutic, major diagnostic, minor therapeutic, or minor diagnostic.d If at least one major diagnostic or major therapeutic procedure was on a hospital record, the hospital stay was classified as involving a major OR procedure. Unit of analysis The unit of analysis is the hospital discharge (i.e., the hospital stay), not a person or patient. This means that a person who is admitted to the hospital multiple times in 1 year will be counted each time as a separate discharge from the hospital. Population rates Rates of stays per 100,000 population were calculated using 2018 hospital discharge totals in the numerator and Claritase estimates of the corresponding 2018 U.S. population (e.g., the population for a specific sex-age group) in the denominator. Individuals hospitalized multiple times are counted more than once in the numerator. Costs and charges Total hospital charges were converted to costs using HCUP Cost-to-Charge Ratios based on hospital accounting reports from the Centers for Medicare & Medicaid Services (CMS).f Costs reflect the actual expenses incurred in the production of hospital services, such as wages, supplies, and utility costs; charges represent the amount a hospital billed for the case. For each hospital, a hospital-wide cost-to-charge ratio is used. Hospital charges reflect the amount the hospital billed for the entire hospital stay and do not include professional (physician) fees. For the purposes of this Statistical Brief, missing charges were imputed using the mean charge for the DRG before converting charges to costs. Costs are reported to the nearest hundred dollars. How HCUP estimates of costs differ from National Health Expenditure Accounts There are a number of differences between the costs cited in this Statistical Brief and spending as measured in the National Health Expenditure Accounts (NHEA), which are produced annually by CMS.g The largest source of difference comes from the HCUP coverage of inpatient treatment only in contrast to the NHEA inclusion of outpatient costs associated with emergency departments and other hospital-based outpatient clinics and departments as well. The outpatient portion of hospitals' activities has been growing steadily and may exceed half of all hospital revenue in recent years. On the basis of the American Hospital Association Annual Survey, 2018 outpatient gross revenues (or charges) were about 49 percent of total hospital gross revenues.h Smaller sources of differences come from the inclusion in the NHEA of hospitals that are excluded from HCUP. These include Federal hospitals (Department of Defense, Veterans Administration, Indian Health Services, and Department of Justice [prison] hospitals) as well as psychiatric, substance abuse, and long-term care hospitals. A third source of difference lies in the HCUP reliance on billed charges from hospitals to payers, adjusted to provide estimates of costs using hospital-wide cost-to-charge ratios, in contrast to the NHEA measurement of spending or revenue. HCUP costs estimate the amount of money required to produce hospital services, including expenses for wages, salaries, and benefits paid to staff as well as utilities, maintenance, and other similar expenses required to run a hospital. NHEA spending or revenue measures the amount of income received by the hospital for treatment and other services provided, including payments by insurers, patients, or government programs. The difference between revenues and costs includes profit for for-profit hospitals or surpluses for nonprofit hospitals. Location of patients' residence Place of residence is based on the urban-rural classification scheme for U.S. counties developed by the National Center for Health Statistics (NCHS) and based on the Office of Management and Budget (OMB) definition of a metropolitan service area as including a city and a population of at least 50,000 residents:
Community-level income Community-level income is based on the median household income of the patient's ZIP Code of residence. Quartiles are defined so that the total U.S. population is evenly distributed. Cut-offs for the quartiles are determined annually using ZIP Code demographic data obtained from Claritas, a vendor that produces population estimates and projections based on data from the U.S. Census Bureau.i The value ranges for the income quartiles vary by year. The income quartile is missing for patients who are homeless or foreign. Expected payer To make coding uniform across all HCUP data sources, the primary expected payer for the hospital stay combines detailed categories into general groups:
For this Statistical Brief, when more than one payer is listed for a hospital discharge, the first-listed payer is used. Admission source or point of origin Admission source (now known as the patient's point of origin) indicates where the patient was located prior to admission to the hospital. Emergency admission indicates that the patient was admitted to the hospital through the emergency department. Discharge status Discharge status reflects the disposition of the patient at discharge from the hospital and includes the following five categories: routine (to home) or to home healthcare; transfer to another short-term hospital; other transfers (including skilled nursing facility, intermediate care, and another type of facility such as a nursing home); died in the hospital; or other (including against medical advice [AMA] or discharge alive, destination unknown). About HCUP The Healthcare Cost and Utilization Project (HCUP, pronounced "H-Cup") is a family of healthcare databases and related software tools and products developed through a Federal-State-Industry partnership and sponsored by the Agency for Healthcare Research and Quality (AHRQ). HCUP databases bring together the data collection efforts of State data organizations, hospital associations, and private data organizations (HCUP Partners) and the Federal government to create a national information resource of encounter-level healthcare data. HCUP includes the largest collection of longitudinal hospital care data in the United States, with all-payer, encounter-level information beginning in 1988. These databases enable research on a broad range of health policy issues, including cost and quality of health services, medical practice patterns, access to healthcare programs, and outcomes of treatments at the national, State, and local market levels. HCUP would not be possible without the contributions of the following data collection Partners from across the United States: |
|
Alaska Department of Health and Social Services Alaska State Hospital and Nursing Home Association Arizona Department of Health Services Arkansas Department of Health California Office of Statewide Health Planning and Development Colorado Hospital Association Connecticut Hospital Association Delaware Division of Public Health District of Columbia Hospital Association Florida Agency for Health Care Administration Georgia Hospital Association Hawaii Laulima Data Alliance Hawaii University of Hawai'i at Hilo Illinois Department of Public Health Indiana Hospital Association Iowa Hospital Association Kansas Hospital Association Kentucky Cabinet for Health and Family Services Louisiana Department of Health Maine Health Data Organization Maryland Health Services Cost Review Commission Massachusetts Center for Health Information and Analysis Michigan Health & Hospital Association Minnesota Hospital Association Mississippi State Department of Health Missouri Hospital Industry Data Institute |
Montana Hospital Association Nebraska Hospital Association Nevada Department of Health and Human Services New Hampshire Department of Health & Human Services New Jersey Department of Health New Mexico Department of Health New York State Department of Health North Carolina Department of Health and Human Services North Dakota (data provided by the Minnesota Hospital Association) Ohio Hospital Association Oklahoma State Department of Health Oregon Association of Hospitals and Health Systems Oregon Office of Health Analytics Pennsylvania Health Care Cost Containment Council Rhode Island Department of Health South Carolina Revenue and Fiscal Affairs Office South Dakota Association of Healthcare Organizations Tennessee Hospital Association Texas Department of State Health Services Utah Department of Health Vermont Association of Hospitals and Health Systems Virginia Health Information Washington State Department of Health West Virginia Department of Health and Human Resources, West Virginia Health Care Authority Wisconsin Department of Health Services Wyoming Hospital Association |
|
About the NIS
The HCUP National (Nationwide) Inpatient Sample (NIS) is a nationwide database of hospital inpatient stays. The NIS is nationally representative of all community hospitals (i.e., short-term, non-Federal, nonrehabilitation hospitals). The NIS includes all payers. It is drawn from a sampling frame that contains hospitals comprising more than 96 percent of all discharges in the United States. The vast size of the NIS allows the study of topics at the national and regional levels for specific subgroups of patients. In addition, NIS data are standardized across years to facilitate ease of use. Over time, the sampling frame for the NIS has changed; thus, the number of States contributing to the NIS varies from year to year. The NIS is intended for national estimates only; no State-level estimates can be produced. The unweighted sample size for the 2018 NIS is 7,105,498 (weighted, this represents 35,527,481 inpatient stays). For More Information For other information on hospital inpatient procedures, refer to the HCUP Statistical Briefs located at www.hcup-us.ahrq.gov/reports/statbriefs/sb_procedures.jsp. For additional HCUP statistics, visit:
For a detailed description of HCUP and more information on the design of the National Inpatient Sample (NIS), please refer to the following database documentation: Agency for Healthcare Research and Quality. Overview of the National (Nationwide) Inpatient Sample (NIS). Healthcare Cost and Utilization Project (HCUP). Rockville, MD: Agency for Healthcare Research and Quality. Updated December 2020. www.hcup-us.ahrq.gov/nisoverview.jsp. Accessed January 22, 2021. Suggested Citation McDermott KW (IBM Watson Health), Liang L (AHRQ). Overview of Operating Room Procedures During Inpatient Stays in U.S. Hospitals, 2018. HCUP Statistical Brief #281. August 2021. Agency for Healthcare Research and Quality, Rockville, MD. www.hcup-us.ahrq.gov/reports/statbriefs/sb281-Operating-Room-Procedures-During-Hospitalization-2018.pdf. Acknowledgments The authors would like to acknowledge the contributions of Nils Nordstrand of IBM Watson Health. *** AHRQ welcomes questions and comments from readers of this publication who are interested in obtaining more information about access, cost, use, financing, and quality of healthcare in the United States. We also invite you to tell us how you are using this Statistical Brief and other HCUP data and tools, and to share suggestions on how HCUP products might be enhanced to further meet your needs. Please email us at hcup@ahrq.gov or send a letter to the address below:Joel W. Cohen, Ph.D., Director Center for Financing, Access and Cost Trends Agency for Healthcare Research and Quality 5600 Fishers Lane Rockville, MD 20857 This Statistical Brief was posted online on August 31, 2021. a This Statistical Brief represents an update to HCUP Statistical Brief #233, Overview of Operating Room Procedures During Inpatient Stays in U.S. Hospitals, 2014. However, Statistical Brief #233 applied earlier versions of HCUP software designed for use with International Classification of Diseases, Ninth Revision, Clinical Modification (ICD-9-CM) procedure codes (i.e., HCUP Clinical Classifications Software [CCS] for ICD-9-CM and HCUP Procedure Classes for ICD-9-CM). The present Statistical Brief applies updated tools for International Classification of Diseases, Tenth Revision, Procedure Coding System (ICD-10-PCS) codes, which in many cases use distinct terminology and clinical concepts to classify procedures. Because of these distinctions, direct comparisons of the estimates provided in the two reports are not recommended. b Claritas. Claritas Demographic Profile by ZIP Code. https://claritas360.claritas.com/mybestsegments/. c Agency for Healthcare Research and Quality. HCUP Clinical Classifications Software Refined (CCSR) for ICD-10-PCS Procedures. Healthcare Cost and Utilization Project (HCUP). Agency for Healthcare Research and Quality. Updated November 2020. www.hcup-us.ahrq.gov/toolssoftware/ccsr/prccsr.jsp. Accessed June 14, 2021. d Procedure Classes Refined for ICD-10-PCS. Healthcare Cost and Utilization Project (HCUP). U.S. Agency for Healthcare Research and Quality. Rockville, MD. Updated March 2021. www.hcup-us.ahrq.gov/toolssoftware/procedureicd10/procedure_icd10.jsp Accessed June 28, 2021. e Claritas. Claritas Demographic Profile by ZIP Code. https://claritas360.claritas.com/mybestsegments/. f Agency for Healthcare Research and Quality. HCUP Cost-to-Charge Ratio (CCR) Files. Healthcare Cost and Utilization Project (HCUP). 2001-2017. Agency for Healthcare Research and Quality. Updated September 2020. www.hcup-us.ahrq.gov/db/state/costtocharge.jsp. Accessed January 22, 2021. g For additional information about the NHEA, see Centers for Medicare & Medicaid Services (CMS). National Health Expenditure Data. CMS website. Updated December 17, 2019. www.cms.gov/Research-Statistics-Data-and-Systems/Statistics-Trends-and-Reports/NationalHealthExpendData/index.html?redirect=/NationalHealthExpendData/. Accessed January 22, 2021. h American Hospital Association. TrendWatch Chartbook, 2020. Table 4.2. Distribution of Inpatient vs. Outpatient Revenues, 1995-2018. www.aha.org/system/files/media/file/2020/10/TrendwatchChartbook-2020-Appendix.pdf. i Claritas. Claritas Demographic Profile by ZIP Code. https://claritas360.claritas.com/mybestsegments/. |
| Supplemental Table 1. Inpatient stays with and without OR procedures, by patient characteristic, 2018, for data presented in Figure 2 | ||
| Characteristic | Stays with OR procs | Stays without OR procs |
|---|---|---|
| Sex | ||
| Male | 39.0 | 45.7 |
| Female | 61.0 | 54.3 |
| Age, years | ||
| 0-17 | 3.3 | 19.1 |
| 18-44 | 32.2 | 20.6 |
| 45-64 | 28.0 | 22.7 |
| 65-74 | 19.7 | 14.8 |
| 75+ | 16.8 | 22.7 |
| Expected payer | ||
| Medicare | 38.3 | 41.9 |
| Medicaid | 17.8 | 24.5 |
| Private insurance | 37.1 | 26.0 |
| Self-pay/No charge* | 3.4 | 4.8 |
| Other | 3.3 | 2.6 |
| Community-level income | ||
| Quartile 1 (lowest) | 25.8 | 30.2 |
| Quartile 2 | 26.2 | 26.5 |
| Quartile 3 | 24.7 | 23.0 |
| Quartile 4 (highest) | 21.8 | 18.6 |
| Patient location | ||
| Large central metro | 28.8 | 30.4 |
| Large fringe metro | 24.5 | 23.6 |
| Med & small metro | 30.4 | 29.8 |
| Micropolitan & noncore | 15.9 | 15.7 |
| *Self-pay/No charge: includes self-pay, no charge, charity, and no expected payment. | ||
| Internet Citation: Statistical Brief #281. Healthcare Cost and Utilization Project (HCUP). August 2021. Agency for Healthcare Research and Quality, Rockville, MD. hcup-us.ahrq.gov/reports/statbriefs/sb281-Operating-Room-Procedures-During-Hospitalization-2018.jsp. |
| Are you having problems viewing or printing pages on this website? |
| If you have comments, suggestions, and/or questions, please contact hcup@ahrq.gov. |
| If you are experiencing issues related to Section 508 accessibility of information on this website, please contact hcup@ahrq.gov. |
| Privacy Notice, Viewers & Players |
| Last modified 8/30/21 |