STATISTICAL BRIEF #187 |
December 2014
Whitney P. Witt, Ph.D. M.P.H., Audrey J. Weiss, Ph.D., and Anne Elixhauser, Ph.D. Introduction Nearly one out of every six discharges from U.S. hospitals in 2012 was for children aged 17 years and younger, the majority of whom were infants, including newborns.1 Between 2008 and 2012, the rate of hospitalization decreased by 0.6 percent per year among infants and 0.9 percent per year among children aged 1-17 years.2 During this same time period, average annual growth in mean hospital costs per stay was 6.7 percent for infants and 6.4 percent for children aged 1-17 years, more than three times the rate of cost growth of any other age group.3 A variety of factors may explain the recent trends in children's hospitalizations, including changes in the conditions for which children are being treated. One recent study of children's inpatient stays in pediatric hospitals found that the number of patients, aggregate hospital charges, and number of hospital days grew more rapidly between 2004 and 2009 among children with chronic conditions than among those without chronic conditions.4 Children with multiple chronic conditions also were more likely to be covered by Medicaid than were those without a chronic condition.5 Understanding the reasons why children are hospitalized and examining trends over time is critical to inform clinical practice and health policy. This Healthcare Cost and Utilization Project (HCUP) Statistical Brief presents data on hospital inpatient stays among children aged 17 years and younger in 2012. Data were taken from the HCUP Kids' Inpatient Database (KID), which is created once every 3 years. The KID is the only database specifically developed to study hospitalizations among children. This Statistical Brief updates previously published information6,7 using the KID and examines trends over time. In this Statistical Brief, we present characteristics of hospital stays among children aged 0-17 years, in comparison to hospital stays among adults aged 18-44 years. The distribution of hospital stays and aggregate hospital costs by pediatric age group is provided. Trends in the distribution of stays among children by primary payer from 2000 to 2012 also are shown. Finally, the most common types of conditions and operating room (OR) procedures for hospital stays among children are presented. All differences between mean estimates noted in the text are statistically significant at the .001 level or better. Differences between proportions noted in the text differ by at least 10 percent. Findings Characteristics of hospital stays among children, 2012 Table 1 presents characteristics of inpatient hospitalizations among children (aged 0-17 years) compared with adults (aged 18-44 years). |
|
| Table 1. Characteristics of hospital stays among children aged 0-17 years versus adults aged 18-44 years, 2012 | ||||
| Characteristic | All hospital stays | Nonneonatal and nonmaternal stays | ||
|---|---|---|---|---|
| Children aged 0-17 years | Adults aged 18-44 years | Children aged 0-17 years | Adults aged 18-44 years | |
| Stays, n | 5,850,200 | 8,996,400 | 1,848,800 | 4,943,100 |
| Rate of stays per 100,000 population | 7,928 | 7,888 | 2,505 | 4,334 |
| Mean length of stay, days | 3.9 | 3.6 | 4.2 | 4.4 |
| Mean hospital costs, $ | 6,415 | 7,612 | 11,143 | 10,214 |
| Aggregate hospital costs, $ millions | 37,400 | 68,400 | 20,700 | 50,500 |
| Expected primary payer, % of stays | ||||
| Private insurance | 43.6 | 42.9 | 40.0 | 38.1 |
| Medicaid | 48.6 | 34.4 | 51.6 | 26.4 |
| Medicare | 0.4 | 6.8 | 0.4 | 11.7 |
| Uninsured | 3.5 | 10.5 | 2.7 | 16.9 |
| Source: Agency for Healthcare Research and Quality (AHRQ), Center for Delivery, Organization, and Markets, Healthcare Cost and Utilization Project (HCUP), Kids' Inpatient Database (KID), 2012, and National Inpatient Sample (NIS), 2012 | ||||
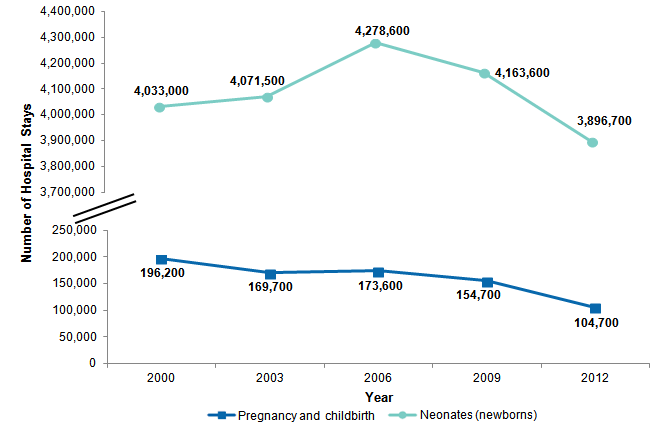
Figure 1 shows the number of hospital stays for neonates (newborns) and for pregnancy and childbirth among teenagers for the 2000-2012 time period. |
|
Figure 1. Neonatal and maternal hospital stays among children aged 0-17 years, 2000-2012
Source: Agency for Healthcare Research and Quality (AHRQ), Center for Delivery, Organization, and Markets, Healthcare Cost and Utilization Project (HCUP), Kids' Inpatient Database (KID), 2000, 2003, 2006, 2009, and 2012 Figure 1 is a line graph that shows the number of hospital stays for pregnancy and childbirth and for neonates between 2000 and 2012, in 3-year increments. The number of hospital stays for pregnancy and childbirth was 196,200 in 2000. By 2003, it had decreased to 169,700, and it increased slightly to 173,600 in 2006. There was a steady decrease to 104,700 between 2006 and 2012. The number of hospital stays for neonates was 4,033,000 in 2000. It increased to 4,071,600 in 2003 and increased sharply to 4,278,600 in 2006. After that it declined steadily, reaching 3,896,700 in 2012. |
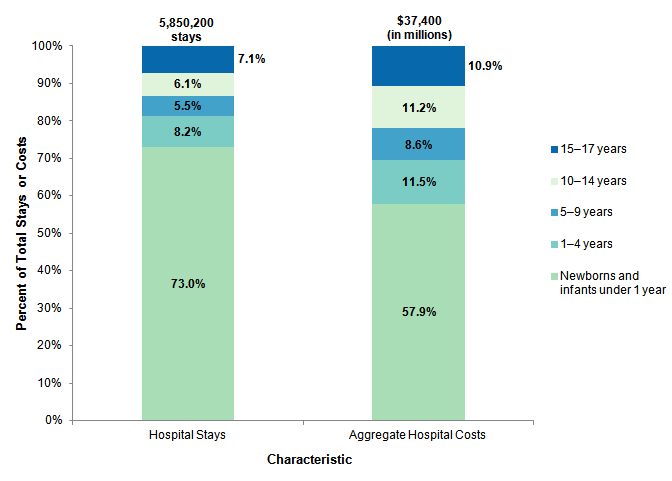
Figure 2 shows total hospital stays and aggregate hospital costs among children for different age groups in 2012. |
|
Figure 2. Hospital inpatient stays and aggregate hospital costs among children aged 0-17 years by age group, 2012
Source: Agency for Healthcare Research and Quality (AHRQ), Center for Delivery, Organization, and Markets, Healthcare Cost and Utilization Project (HCUP), Kids' Inpatient Database (KID), 2012 Figure 2 is a bar chart that shows the percentage of hospital stays and the percentage of hospital costs for infants and children aged 0-17 years in 2012. Of the 5,850,200 hospital stays for children in 2012, 73.0% were for newborns and infants under 1 year, 8.2% were for children between 1 and 4 years of age, 5.5% were for children between 5 and 9 years of age, 6.1% were for children between 10 and 14 years of age, and 7.1% were for children between 15 and 17 years of age. Of the $37,400,000 in aggregate hospital costs for stays for children in 2012, 57.9% were for newborns and infants under 1 year, 11.5% were for children between 1 and 4 years of age, 8.6% were for children between 5 and 9 years of age, 11.2% were for children between 10 and 14 years of age, and 10.9% were for children between 15 and 17 years of age. |
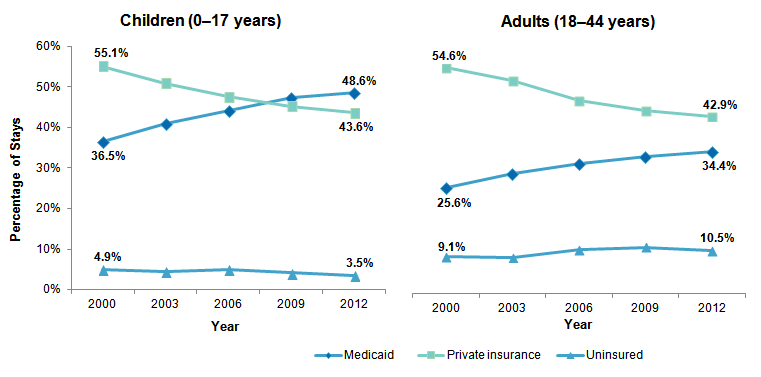
Figure 3 examines primary payer for hospital stays among children compared with adults from 2000 to 2012. |
|
Figure 3. Hospital inpatient stays among children aged 0-17 years versus adults aged 18-44 years by expected primary payer, 2000-2012
Note: Hospital stays for children and adults (aged 18-44 years) who were covered by Medicare, were covered by other types of insurance, or were missing primary payer information were excluded from this figure, and thus percentages do not total 100. Figure 3 is made up of two line graphs—one for children and one for adults—that show the percentage of stays that were uninsured or were covered by Medicaid or private insurance between 2000 and 2012. For children 0-17 years, the percentage of stays that were uninsured was 4.9% in 2000, and except for a slight increase in 2006, the percentage of stays that were uninsured decreased steadily to 3.5% in 2012. For children 0-17 years, the percentage of stays covered by Medicaid increased steadily from 36.5% in 2000 to 48.6% in 2012. For children 0-17 years, the percentage of stays covered by private insurance decreased steadily from 55.1% in 2000 to 43.6% in 2012. For adults 18-44 years, the percentage of stays that were uninsured was 9.1% in 2000, decreased slightly between 2000 and 2003, increased slightly between 2003 and 2009, and then decreased slightly to 10.5% in 2012. For adults 18-44 years, the percentage of stays that were covered by Medicaid increased steadily from 25.6% in 2000 to 34.4% in 2012. For adults 18-44 years, the percentage of stays that were covered by private insurance decreased steadily from 54.6% in 2000 to 42.9% in 2012. Note: Hospital stays for children and adults (aged 18-44 years) who were covered by Medicare, were covered by other types of insurance, or were missing primary payer information were excluded from this figure, and thus percentages do not total 100. |
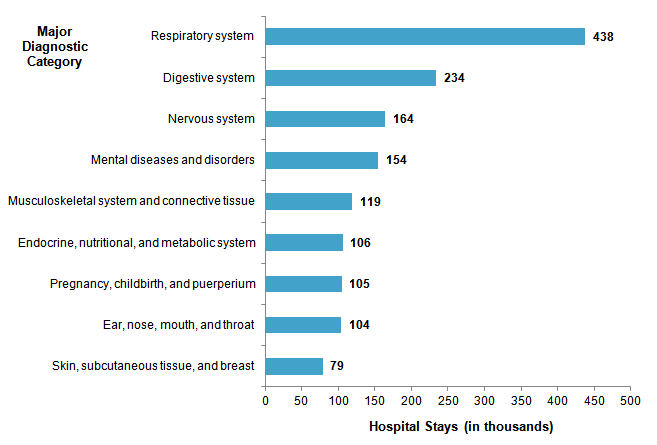
Most common types of conditions and procedures for hospitalizations among children, 2012 Figure 4 shows the 10 most common major diagnostic categories (MDCs), excluding newborns, for hospital inpatient stays among children in 2012. |
|
Figure 4. Top 10 major diagnostic categories (MDCs), excluding newborns, for hospital stays among children aged 0-17 years, 2012
Note: This figure includes all hospital stays but excludes MDC code 15, corresponding to Newborns and other neonates with condtn orig in perinatal period, for which there were 3.9 million total hospital stays. Figure 4 is a bar chart that shows in descending order of number of stays, the diagnostic categories for which children aged 0-17 excluding newborns were hospitalized in 2012. There were 438,000 stays for respiratory system; 234,000 stays for digestive system; 164,000 stays for nervous system; 154,000 stays for mental diseases and disorders; 119,000 stays for musculoskeletal system and connective tissue; 106,000 stays for endocrine, nutritional, and metabolic system; 105,000 stays for pregnancy, childbirth, and puerperium; 104,000 stays for ear, nose, mouth, and throat; and 79,000 stays for skin, subcutaneous tissue, and breast. Note: This figure includes all hospital stays but excludes MDC code 15, corresponding to Newborns and other neonates with condtn orig in perinatal period, for which there were 3.9 million total hospital stays. Figure 5. Change in rates of major diagnostic categories (MDCs) for hospital stays among children aged 0-17 years, 2000-2012. |
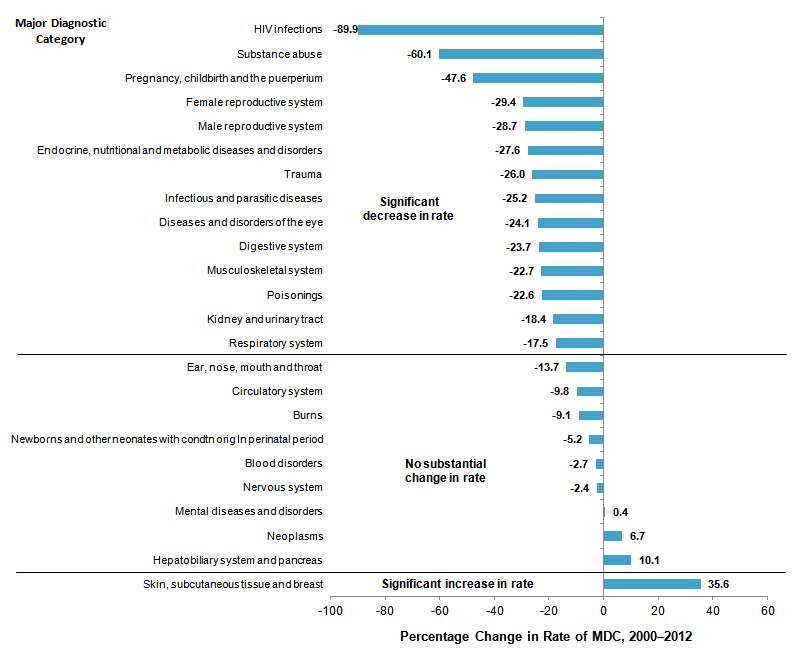
The percentage change in rates of hospital stays for major diagnostic categories (MDCs) among children between 2000 and 2012 is shown in Figure 5. |
|
Figure 5. Change in rates of major diagnostic categories (MDCs) for hospital stays among children aged 0-17 years, 2000-2012
Note: MDCs with a change in rate of at least 15 percent between 2000 and 2012 were significantly different at the p<.001 level. Source: Agency for Healthcare Research and Quality (AHRQ), Center for Delivery, Organization, and Markets, Healthcare Cost and Utilization Project (HCUP), Kids' Inpatient Database (KID), 2000 and 2012 Figure 5 is a bar chart that shows, in descending order starting with the largest decline, the change in rates of hospital stays between 2000 and 2012 for 24 major diagnostic categories. Among the rates that declined significantly, the rate of hospital stays for HIV infections declined by 89.9%; for substance abuse the rate declined by 60.1%; for pregnancy, childbirth and the puerperium the rate decined by 47.6%; for female reproductive system the rate declined by 29.4%; for male reproductive system the rate declined by 28.7%; for endocrine, nutritional and metabolic diseases and disorders the rate declined by 27.6%; for trauma the rate declined by 26.0%; for infectious and parasitic diseases the rate declined by 25.2%; for diseases and disorders of the eye the rate declined by 24.1%; for digestive system the rate declined by 23.7%; for musculoskeletal system the rate declined by 22.7%; for poisonings the rate declined by 22.6%; for kidney and urinary tract the rate declined by 18.4%; and for respiratory system the rate declined by 17.5%. There was no substantial change in the rate of hospital stays for nine diagnostic categories: for ear, nose, mouth and throat the rate declined by 13.7%; for circulatory system the rate declined by 9.8%; for burns the rate declined by 9.1%; for newborns and other neonates with condition originating in perinatal period the rate declined by 5.2%; for blood disorders the rate declined by 2.7%; for nervous system the rate declined by 2.4%; for mental disease and disorders the rate increased by 0.4%; for neoplasms the rate increased by 6.7%; and for hepatobiliary system and pancreas the rate increased by 10.1%. There was a significant increase of 35.6% in the rate for skin, subcutaneous tissue and breast. Note: MDCs with a change in rate of at least 15 percent between 2000 and 2012 were significantly different at the p<.001 level. |
Table 2 expands on the findings by MDC by presenting the 10 most common principal diagnoses for nonneonatal and nonmaternal stays among children compared with adults in 2012. |
| Table 2. Most common principal diagnoses for nonneonatal and nonmaternal hospital inpatient stays among children aged 0-17 years versus adults aged 18-44 years, 2012 | |||||||
| Children aged 0-17 years | Adults aged 18-44 years | ||||||
|---|---|---|---|---|---|---|---|
| Rank | Principal diagnosis | Stays, n | Rate of stays per 100,000 population | Rank | Principal diagnosis | Stays, n | Rate of stays per 100,000 population |
| 1 | Pneumonia (except that caused by tuberculosis and sexually transmitted diseases) | 124,900 | 169.2 | 1 | Mood disorders | 412,900 | 362.0 |
| 2 | Acute bronchitis | 123,600 | 167.6 | 2 | Schizophrenia and other psychotic disorders | 190,700 | 167.2 |
| 3 | Asthma | 123,100 | 166.8 | 3 | Skin and subcutaneous tissue infections | 162,600 | 142.6 |
| 4 | Mood disorders | 106,600 | 144.4 | 4 | Diabetes mellitus with complications | 160,500 | 140.7 |
| 5 | Appendicitis and other appendiceal conditions | 71,900 | 97.4 | 5 | Biliary tract disease | 139,200 | 122.1 |
| 6 | Epilepsy, convulsions | 69,900 | 94.7 | 6 | Septicemia (except in labor) | 123,500 | 108.3 |
| 7 | Skin and subcutaneous tissue infections | 59,300 | 80.4 | 7 | Substance-related disorders | 121,000 | 106.1 |
| 8 | Fluid and electrolyte disorders | 47,600 | 64.5 | 8 | Spondylosis, intervertebral disc disorders, other back problems | 109,100 | 95.6 |
| 9 | Maintenance chemotherapy, radiotherapy | 41,500 | 56.3 | 9 | Appendicitis and other appendiceal conditions | 104,600 | 91.7 |
| 10 | Urinary tract infections | 41,200 | 55.8 | 10 | Pancreatic disorders (not diabetes) | 101,300 | 88.8 |
| Note: This table is limited to nonmaternal and nonneonatal stays in the child and adult populations. Principal diagnosis is identified using Clinical Classifications Software (CCS) diagnosis categories. Source: Agency for Healthcare Research and Quality (AHRQ), Center for Delivery, Organization, and Markets, Healthcare Cost and Utilization Project (HCUP), Kids' Inpatient Database (KID), 2012, and National Inpatient Sample (NIS), 2012 | |||||||
Table 3 presents the 10 most common operating room (OR) procedures among children in 2012. |
| Table 3. Most common operating room (OR) procedures during hospital inpatient stays among children aged 0-17 years, 2012 | |||
| Rank | All-listed OR procedure | Stays, n | Rate of stays per 100,000 population |
|---|---|---|---|
| 1 | Circumcision | 1,063,200 | 1,440.8 |
| 2 | Appendectomy | 76,200 | 103.3 |
| 3 | Cesarean section | 18,300 | 24.8 |
| 4 | Partial excision bone | 15,400 | 20.9 |
| 5 | Treatment, fracture or dislocation of hip and femur | 14,600 | 19.8 |
| 6 | Tonsillectomy and/or adenoidectomy | 14,500 | 19.7 |
| 7 | Spinal fusion | 12,600 | 17.0 |
| 8 | Insertion, replacement, or removal of extracranial ventricular shunt | 12,000 | 16.2 |
| 9 | Treatment, fracture or dislocation of lower extremity (other than hip or femur) | 11,200 | 15.2 |
| 10 | Incision and excision of CNS | 10,900 | 14.7 |
| Note: All-listed OR procedures are identified using Clinical Classifications Software (CCS) procedure categories. Procedures designated as "Other" are not reported; these represent miscellaneous procedures that may be difficult to interpret as a group. Source: Agency for Healthcare Research and Quality (AHRQ), Center for Delivery, Organization, and Markets, Healthcare Cost and Utilization Project (HCUP), Kids' Inpatient Database (KID), 2012 | |||
Data Source The estimates in this Statistical Brief are based on data from the Healthcare Cost and Utilization Project (HCUP) 2012 Kids' Inpatient Database (KID). Comparative data for adults were taken from the 2012 National Inpatient Sample (NIS). Historical data were drawn from the 2000, 2003, 2006, and 2009 KID and NIS. The statistics were generated from HCUPnet, a free, online query system that provides users with immediate access to the largest set of publicly available, all-payer national, regional, and State-level hospital care databases from HCUP.8 The proportion of nonmaternal and nonneonatal stays by primary payer among adults aged 18-44 years was calculated from the NIS. Supplemental sources included population denominator data for use with HCUP databases, derived from information available from the Bureau of the Census.9 This analysis was limited to pediatric discharges from the KID for children aged 0-17 years and adult discharges from the NIS for adults aged 18-44 years. Definitions Diagnoses, procedures, ICD-9-CM, Clinical Classifications Software (CCS), diagnosis-related groups (DRGs), and major diagnostic categories (MDCs) The principal diagnosis is that condition established after study to be chiefly responsible for the patient's admission to the hospital. All-listed procedures were limited to surgical stays with "valid OR procedures" based on DRG coding principles. ICD-9-CM is the International Classification of Diseases, Ninth Revision, Clinical Modification, which assigns numeric codes to diagnoses and procedures. There are approximately 14,000 ICD-9-CM diagnosis codes and 4,000 ICD-9-CM procedure codes. CCS categorizes ICD-9-CM diagnoses and procedures into a manageable number of clinically meaningful categories.10 This clinical grouper makes it easier to quickly understand patterns of diagnoses and procedure use. CCS categories identified as "Other" typically are not reported; these categories include miscellaneous, otherwise unclassifiable diagnoses and procedures that may be difficult to interpret as a group. DRGs comprise a patient classification system that categorizes patients into groups that are clinically coherent and homogeneous with respect to resource use. DRGs group patients according to diagnosis, type of treatment (procedure), age, and other relevant criteria. Each hospital stay has one assigned DRG. For this report, major operating room (OR) procedures were defined using procedure classes, which categorize each ICD-9-CM procedure code as either major therapeutic, major diagnostic, minor therapeutic, or minor diagnostic.11 Major OR procedures are considered to be valid OR procedures based on DRGs. This classification scheme relies on physician panels that classify ICD-9-CM procedure codes according to whether the procedure would be performed in a hospital OR in most hospitals. Major OR procedures were identified using all procedure fields (first-listed and secondary) that were available on the discharge record. MDCs are derived from the DRG reimbursement system. A patient's hospital record is assigned a single MDC that designates the body system (e.g., respiratory system) or etiology (e.g., trauma) of the principal diagnosis for that hospital stay. Types of hospitals included in the HCUP Kids' Inpatient Database (KID) and National (Nationwide) Inpatient Sample (NIS) The Kids' Inpatient Database (KID) and the National (Nationwide) Inpatient Sample (NIS) are based on data from community hospitals, which are defined as short-term, non-Federal, general, and other hospitals, excluding hospital units of other institutions (e.g., prisons). The KID and NIS include obstetrics and gynecology, otolaryngology, orthopedic, cancer, pediatric, public, and academic medical hospitals. Excluded are long-term care facilities such as rehabilitation, psychiatric, and alcoholism and chemical dependency hospitals. Beginning in 2012, long-term acute care hospitals are also excluded from the NIS. However, if a patient received long-term care, rehabilitation, or treatment for psychiatric or chemical dependency conditions in a community hospital, the discharge record for that stay will be included in the KID or NIS. Unit of analysis The unit of analysis is the hospital discharge (i.e., the hospital stay), not a person or patient. This means that a person who is admitted to the hospital multiple times in 1 year will be counted each time as a separate discharge from the hospital. Costs and charges Total hospital charges were converted to costs using HCUP Cost-to-Charge Ratios based on hospital accounting reports from the Centers for Medicare & Medicaid Services (CMS). Costs reflect the actual expenses incurred in the production of hospital services, such as wages, supplies, and utility costs; charges represent the amount a hospital billed for the case. For each hospital, a hospital-wide cost-to-charge ratio is used. Hospital charges reflect the amount the hospital billed for the entire hospital stay and do not include professional (physician) fees. For the purposes of this Statistical Brief, costs are reported to the nearest hundred. How HCUP estimates of costs differ from National Health Expenditure Accounts There are a number of differences between the costs cited in this Statistical Brief and spending as measured in the National Health Expenditure Accounts (NHEA), which are produced annually by the Centers for Medicare & Medicaid Services (CMS).13 The largest source of difference comes from the HCUP coverage of inpatient treatment only in contrast to the NHEA inclusion of outpatient costs associated with emergency departments and other hospital-based outpatient clinics and departments as well. The outpatient portion of hospitals' activities has been growing steadily and may exceed half of all hospital revenue in recent years. On the basis of the American Hospital Association Annual Survey, 2012 outpatient gross revenues (or charges) were about 44 percent of total hospital gross revenues.14 Smaller sources of differences come from the inclusion in the NHEA of hospitals that are excluded from HCUP. These include Federal hospitals (Department of Defense, Veterans Administration, Indian Health Services, and Department of Justice [prison] hospitals) as well as psychiatric, substance abuse, and long-term care hospitals. A third source of difference lies in the HCUP reliance on billed charges from hospitals to payers, adjusted to provide estimates of costs using hospital-wide cost-to-charge ratios, in contrast to the NHEA measurement of spending or revenue. HCUP costs estimate the amount of money required to produce hospital services, including expenses for wages, salaries, and benefits paid to staff as well as utilities, maintenance, and other similar expenses required to run a hospital. NHEA spending or revenue measures the amount of income received by the hospital for treatment and other services provided, including payments by insurers, patients, or government programs. The difference between revenues and costs include profit for for-profit hospitals or surpluses for nonprofit hospitals. Payer Payer is the expected primary payer for the hospital stay. To make coding uniform across all HCUP data sources, payer combines detailed categories into general groups:
Hospital stays billed to the State Children's Health Insurance Program (SCHIP) may be classified as Medicaid, Private Insurance, or Other, depending on the structure of the State program. Because most State data do not identify patients in SCHIP specifically, it is not possible to present this information separately. When more than one payer is listed for a hospital discharge, the first-listed payer is used. About HCUP The Healthcare Cost and Utilization Project (HCUP, pronounced "H-Cup") is a family of databases and related software tools and products developed through a Federal-State-Industry partnership and sponsored by the Agency for Healthcare Research and Quality (AHRQ). HCUP databases bring together the data collection efforts of State data organizations, hospital associations, and private data organizations and the Federal government to create a national information resource of encounter-level data (HCUP Partners). HCUP includes the largest collection of longitudinal hospital care data in the United States, with all-payer, encounter-level information beginning in 1988. These databases enable research on a broad range of health policy issues, including cost and quality of health services, medical practice patterns, access to programs, and outcomes of treatments at the national, State, and local market levels. HCUP would not be possible without the contributions of the following data collection Partners from across the United States: Alaska State Hospital and Nursing Home Association Arizona Department of Health Services Arkansas Department of Health California Office of Statewide Health Planning and Development Colorado Hospital Association Connecticut Hospital Association Florida Agency for Health Care Administration Georgia Hospital Association Hawaii Health Information Corporation Illinois Department of Public Health Indiana Hospital Association Iowa Hospital Association Kansas Hospital Association Kentucky Cabinet for Health and Family Services Louisiana Department of Health and Hospitals Maine Health Data Organization Maryland Health Services Cost Review Commission Massachusetts Center for Health Information and Analysis Michigan Health & Hospital Association Minnesota Hospital Association Mississippi Department of Health Missouri Hospital Industry Data Institute Montana MHA - An Association of Montana Health Care Providers Nebraska Hospital Association Nevada Department of Health and Human Services New Hampshire Department of Health & Human Services New Jersey Department of Health New Mexico Department of Health New York State Department of Health North Carolina Department of Health and Human Services North Dakota (data provided by the Minnesota Hospital Association) Ohio Hospital Association Oklahoma State Department of Health Oregon Association of Hospitals and Health Systems Oregon Health Policy and Research Pennsylvania Health Care Cost Containment Council Rhode Island Department of Health South Carolina Revenue and Fiscal Affairs Office South Dakota Association of Healthcare Organizations Tennessee Hospital Association Texas Department of State Health Services Utah Department of Health Vermont Association of Hospitals and Health Systems Virginia Health Information Washington State Department of Health West Virginia Health Care Authority Wisconsin Department of Health Services Wyoming Hospital Association About Statistical Briefs HCUP Statistical Briefs are descriptive summary reports presenting statistics on hospital inpatient and emergency department use and costs, quality of care, access to care, medical conditions, procedures, patient populations, and other topics. The reports use HCUP administrative data. About the KID The HCUP Kids' Inpatient Database (KID) is a nationwide database of hospital inpatient stays. The KID is the only dataset on hospital use, outcomes, and charges designed to study children's use of hospital services in the United States. The KID is a sample of discharges from all community, nonrehabilitation hospitals in States participating in HCUP. For the 1997 KID, hospital discharges for patients aged 18 years or younger were included in the database. Pediatric discharges are defined as all discharges where the patient was aged 20 years or younger at admission. The KID's large sample size enables analyses of rare conditions (such as congenital anomalies) and uncommon treatments (such as organ transplantation). It can be used to study a wide range of topics including the economic burden of pediatric conditions, access to services, quality of care and patient safety, and the impact of health policy changes. The KID is produced every 3 years; prior databases are available for 1997, 2000, 2003, 2006, 2009, and 2012. About the NIS The HCUP National (Nationwide) Inpatient Sample (NIS) is a national (nationwide) database of hospital inpatient stays. The NIS is nationally representative of all community hospitals (i.e., short-term, non-Federal, nonrehabilitation hospitals). The NIS is a sample of hospitals and includes all patients from each hospital, regardless of payer. It is drawn from a sampling frame that contains hospitals comprising more than 95 percent of all discharges in the United States. The vast size of the NIS allows the study of topics at the national and regional levels for specific subgroups of patients. In addition, NIS data are standardized across years to facilitate ease of use. The 2012 NIS was redesigned to optimize national estimates. The redesign incorporates two critical changes:
The new sampling strategy is expected to result in more precise estimates than those that resulted from the previous NIS design by reducing sampling error: for many estimates, confidence intervals under the new design are about half the length of confidence intervals under the previous design. The change in sample design for 2012 necessitates recomputation of prior years' NIS data to enable analysis of trends that uses the same definitions of discharges and hospitals. About HCUPnet HCUPnet is an online query system that offers instant access to the largest set of all-payer databases that are publicly available. HCUPnet has an easy step-by-step query system that creates tables and graphs of national and regional statistics as well as data trends for community hospitals in the United States. HCUPnet generates statistics using data from HCUP's National (Nationwide) Inpatient Sample (NIS), the Kids' Inpatient Database (KID), the Nationwide Emergency Department Sample (NEDS), the State Inpatient Databases (SID), and the State Emergency Department Databases (SEDD). For More Information For more information about HCUP, visit http://www.hcup-us.ahrq.gov/. For additional HCUP statistics, visit HCUPnet, our interactive query system, at https://datatools.ahrq.gov/hcupnet. For information on other hospitalizations in the United States, refer to the following HCUP Statistical Briefs located at http://www.hcup-us.ahrq.gov/reports/statbriefs/statbriefs.jsp:
For a detailed description of HCUP and more information on the design of the Kids' Inpatient Database (KID) or the National (Nationwide) Inpatient Sample (NIS), please refer to the following database documentation: Agency for Healthcare Research and Quality. Overview of the Kids' Inpatient Database (KID). Healthcare Cost and Utilization Project (HCUP). Rockville, MD: Agency for Healthcare Research and Quality. Updated August 2014. http://www.hcup-us.ahrq.gov/kidoverview.jsp. Accessed September 11, 2014. Agency for Healthcare Research and Quality. Overview of the National (Nationwide) Inpatient Sample (NIS). Healthcare Cost and Utilization Project (HCUP). Rockville, MD: Agency for Healthcare Research and Quality. Updated July 2014. http://www.hcup-us.ahrq.gov/nisoverview.jsp. Accessed September 11, 2014. Suggested Citation Witt WP (Truven Health Analytics), Weiss AJ (Truven Health Analytics), Elixhauser A (AHRQ). Overview of Hospital Stays for Children in the United States, 2012. HCUP Statistical Brief #187. December 2014. Agency for Healthcare Research and Quality, Rockville, MD. http://www.hcup-us.ahrq.gov/reports/statbriefs/sb187-Hospital-Stays-Children-2012.pdf. *** AHRQ welcomes questions and comments from readers of this publication who are interested in obtaining more information about access, cost, use, financing, and quality of in the United States. We also invite you to tell us how you are using this Statistical Brief and other HCUP data and tools, and to share suggestions on how HCUP products might be enhanced to further meet your needs. Please e-mail us at hcup@ahrq.gov or send a letter to the address below:Irene Fraser, Ph.D., Director Center for Delivery, Organization, and Markets Agency for Healthcare Research and Quality 540 Gaither Road Rockville, MD 20850 1 Weiss AJ, Elixhauser A. Overview of Hospital Stays in the United States, 2012. HCUP Statistical Brief #180. October 2014. Agency for Healthcare Research and Quality, Rockville, MD. http://www.hcup-us.ahrq.gov/reports/statbriefs/sb180-Hospitalizations-United-States-2012.pdf. Accessed October 10, 2014. 2 Moore B, Levit K, Elixhauser A. Costs for Hospital Stays in the United States, 2012. HCUP Statistical Brief #181. October 2014. Agency for Healthcare Research and Quality, Rockville, MD. http://www.hcup-us.ahrq.gov/reports/statbriefs/sb181-Hospital-Costs-United-States-2012.pdf. Accessed October 27, 2014. 3 Ibid. 4 Berry JG, Hall M, Hall DE, et al. Inpatient growth and resource use in 28 children's hospitals. JAMA Pediatrics. 2013;167(2):170-7. 5 Ibid. 6 Elixhauser A. Hospital Stays for Children, 2006. HCUP Statistical Brief #56. July 2008. Agency for Healthcare Research and Quality. Rockville, MD. http://www.hcup-us.ahrq.gov/reports/statbriefs/sb56.pdf. Accessed November 3, 2014. 7 Yu, H, Wier LM, Elixhauser A. Hospital Stays for Children, 2009. HCUP Statistical Brief #118. August 2001. Agency for Healthcare Research and Quality. Rockville, MD. http://www.hcup-us.ahrq.gov/reports/statbriefs/sb118.pdf. Accessed November 3, 2014. 8 Agency for Healthcare Research and Quality. HCUPnet website. https://datatools.ahrq.gov/hcupnet. Accessed September 11, 2014. 9 Barrett M, Lopez-Gonzalez L, Coffey R, Levit K. Population Denominator Data for Use with the HCUP Databases (Updated with 2013 Population Data). HCUP Methods Series Report #2014-02. August 18, 2014. U.S. Agency for Healthcare Research and Quality. http://www.hcup-us.ahrq.gov/reports/methods/2014-02.pdf. Accessed September 11, 2014. 10 Agency for Healthcare Research and Quality. HCUP Clinical Classifications Software (CCS). Healthcare Cost and Utilization Project (HCUP). Rockville, MD: Agency for Healthcare Research and Quality, Rockville, MD. Updated July 2014. http://www.hcup-us.ahrq.gov/toolssoftware/ccs/ccs.jsp. Accessed September 11, 2014. 11 Agency for Healthcare Research and Quality. HCUP Procedure Classes. Healthcare Cost and Utilization Project (HCUP). Rockville, MD: Agency for Healthcare Research and Quality. Updated March 2014. http://www.hcup-us.ahrq.gov/toolssoftware/procedure/procedure.jsp. Accessed September 30, 2014. 12 Agency for Healthcare Research and Quality. HCUP Cost-to-Charge Ratio (CCR) Files. Healthcare Cost and Utilization Project (HCUP). 2001-2011. Rockville, MD: Agency for Healthcare Research and Quality, Rockville, MD. Updated August 2014. http://www.hcup-us.ahrq.gov/db/state/costtocharge.jsp. Accessed September 11, 2014. 13 For additional information about the NHEA, see Centers for Medicare & Medicaid Services (CMS). National Health Expenditure Data. Updated May 2014. http://www.cms.gov/Research-Statistics-Data-and-Systems/Statistics-Trends-and-Reports/NationalHealthExpendData/index.html?redirect=/NationalHealthExpendData/. Accessed October 9, 2014. 14 American Hospital Association. TrendWatch Chartbook, 2014. Table 4.2. Distribution of Inpatient vs. Outpatient Revenues, 1992-2012. Original source is no longer available on the Web; for related information refer to TrendWatch Chartbook, 2018. Table 4.2. Distribution of Inpatient vs. Outpatient Revenues, 1995-2016. www.aha.org/system/files/2018-05/2018-chartbook-table-4-2.pdf. |
| Internet Citation: Statistical Brief #187. Healthcare Cost and Utilization Project (HCUP). May 2016. Agency for Healthcare Research and Quality, Rockville, MD. hcup-us.ahrq.gov/reports/statbriefs/sb187-Hospital-Stays-Children-2012.jsp. |
| Are you having problems viewing or printing pages on this website? |
| If you have comments, suggestions, and/or questions, please contact hcup@ahrq.gov. |
| If you are experiencing issues related to Section 508 accessibility of information on this website, please contact hcup@ahrq.gov. |
| Privacy Notice, Viewers & Players |
| Last modified 5/16/16 |