STATISTICAL BRIEF #40
|
|
November 2007
C. Allison Russo, M.P.H., Megan M. Hambrick, M.S.W., and Pamela L. Owens, Ph.D.
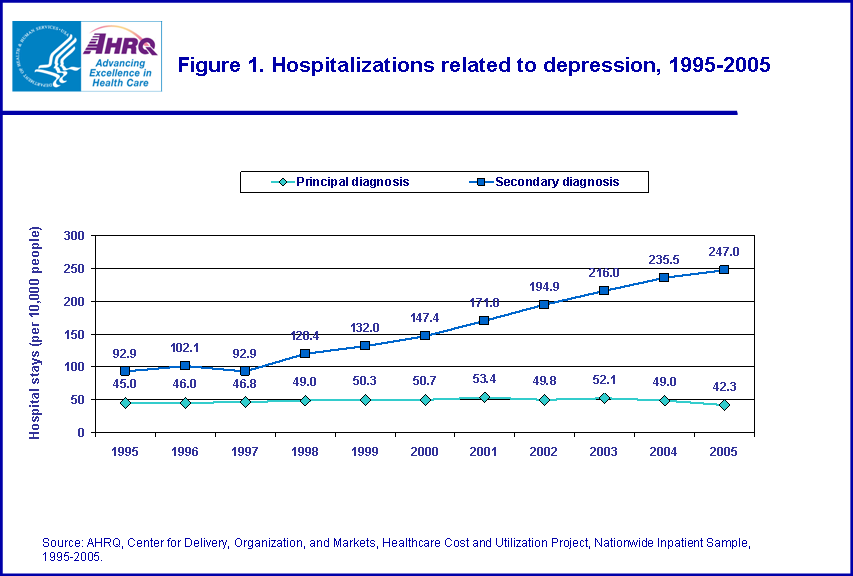
Introduction Approximately 9.5 percent of the adult population in the U.S. suffers from depression.1 Depression is characterized by a persistent low mood, profound sadness, and lack of interest in enjoyable activities. Although many individuals with depression do not seek treatment, among those who do receive care, the treatment settings are varied. The majority will seek care in outpatient or ambulatory settings, but others will need more intense treatment in an inpatient setting such as community hospitals or long-term, residential facilities. With the declining availability of psychiatric beds in specialty facilities, community hospitals have become the primary source of short-term inpatient care for mental health disorders such as depression.2,3 This Statistical Brief presents data from the Healthcare Cost and Utilization Project (HCUP) on hospital stays related to depression in 2005. Characteristics of these stays, including associated diagnoses, are compared to stays with no mention of depression.4 Additionally, trends in the number of hospitalizations for depression as a principal diagnosis and as a secondary diagnosis from 1995 to 2005 are discussed. Finally, utilization is examined by region and expected primary payer. All differences between estimates noted in the text are statistically significant at the 0.05 level or better. Findings In 2005, nearly one in ten hospitalizations�2.9 million�occurred among patients with depression (i.e., depression was a principal and/or coexisting condition). For about 15 percent (423,300) of these hospitalizations, depression was listed as the principal reason for admission. Although the number of stays principally for depression remained relatively stable between 1995 and 2005, the number of stays with depression as a secondary diagnosis rose by 166 percent over the same time period (figure 1). In 2005, hospital stays among patients principally admitted for depression cost $1.9 billion, while stays with depression as a secondary diagnosis totaled $19.9 billion. In total, 8 percent ($21.8 billion) of hospital costs in the U.S. were associated with a diagnosis of depression. General characteristics of hospital stays among patients with depression Table 1 compares the general characteristics of hospitalizations related to depression with the characteristics of hospital stays with no mention of depression in 2005. Compared to stays with no mention of depression, depression-related stays were more likely to occur among younger patients and among females. On average, patients hospitalized principally for depression were about 16 years younger than patients without depression (41.8 years versus 58.0 years). In fact, patients aged 18 to 44 years, accounted for nearly half of all hospitalizations in which depression was the principal reason for admission. Females accounted for 58.8 percent of all hospitalizations with a principal diagnosis of depression, and 68.3 percent of stays with depression as a secondary condition. In comparison, females accounted for 53.5 percent of hospitalizations with no mention of depression. |
|
In 2005, the hospital resources associated with depression as a secondary diagnosis and with stays unrelated to depression were similar. For example, stays with a secondary diagnosis of depression and stays with no mention of depression averaged approximately five days in length�1.5 days shorter than the mean length of stay for hospitalizations principally for depression (6.6 days). Similarly, the average hospital cost per stay was $8,100 for stays with a secondary diagnosis of depression and $9,600 for stays unrelated to depression, while average hospital costs were $4,500 among stays principally for depression. As a result, hospitalizations with a principal diagnosis of depression had an average cost per day that was 63.2 percent lower than the cost per day for stays unrelated to depression ($700 versus $1,900). The average cost per day of hospitalizations with depression listed as a secondary condition was $1,600, which is comparable to stays unrelated to depression. This pattern is likely a result of more resource intensive procedures and treatments related to the principal diagnoses in stays with depression as a coexisting condition.
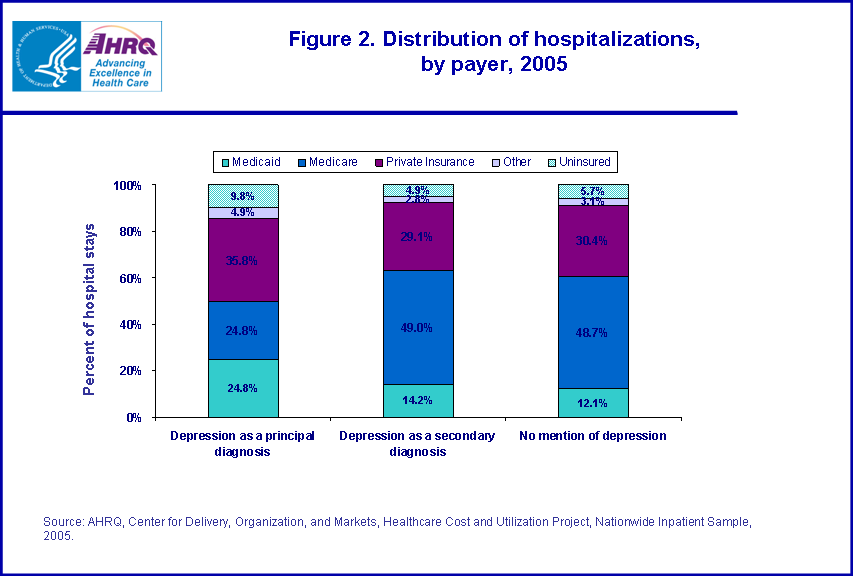
Differences in hospital stays among patients with depression, by region When adjusted for the population of each region, hospitalizations related to depression were most likely to occur in the Midwest and Northeast (table 1). Although the overall hospitalization rates for stays unrelated to depression were relatively similar in the Northeast, Midwest, and South (about 975 hospital stays per 10,000 people in each region), hospitalizations principally for depression in the Midwest (19.5 stays per 10,000 people) and Northeast (17.3 stays per 10,000 people) occurred more frequently than in the South (12.6 stays per 10,000 people). A similar pattern of hospitalization rates across regions was noted among stays with a secondary diagnosis of depression. The West had the lowest regional rate of hospitalizations related to depression (9.4 stays per 10,000 people with a principal diagnosis of depression and 62.2 stays per 10,000 people with depression as a secondary diagnosis), but also had a lower overall rate of hospitalization than the other regions (714.0 stays per 10,000 people). Differences in hospital stays among patients with depression, by primary payer Although the distribution of expected primary payer among stays with no mention of depression and stays with depression as a secondary condition was similar, stays principally for depression were more likely to be covered by Medicaid or be uninsured (figure 2). In 2005, Medicaid was the expected primary payer for nearly one in four hospitalizations (24.8 percent) principally for depression. In comparison, 14.2 percent of stays with depression as a secondary diagnosis and 12.1 percent of hospitalizations unrelated to depression were covered by Medicaid. Uninsured stays accounted for 9.8 percent of hospital stays principally for depression�about twice the percentage seen among stays with depression as a secondary diagnosis (4.9 percent) and stays with no mention of depression (5.7 percent). Medicare was the expected primary payer for only 24.8 percent of stays principally for depression, compared to nearly half of stays with a secondary diagnosis of depression and stays with no mention of depression (49.0 percent and 48.7 percent, respectively). Most common principal conditions associated with depression In approximately 85 percent of all hospital stays involving a diagnosis of depression, the patient was admitted principally for another condition. Table 2 lists the most common principal diagnoses for hospital stays where depression was a secondary diagnosis. One in ten depression-related stays was principally for cardio- and cerebrovascular conditions such as nonspecific chest pain, congestive heart failure, coronary atherosclerosis, cardiac dysrhythmias, and stroke. Common respiratory conditions such as pneumonia, chronic obstructive pulmonary disease, and asthma were the principal reason for admission in 7.8 percent of stays with a secondary diagnosis of depression. Alcohol and substance abuse was 3.5 times more likely to be a principal reason for admission among patients with depression than those without depression. Similarly, poisoning by psychotropic agents was 9 times more likely to be a principal reason for admission, and poisoning by other medications and drugs was 5 times more likely to be a principal reason for admission among patients with depression than among those without depression. Data Source The estimates in this Statistical Brief are based upon data from the HCUP 2005 Nationwide Inpatient Sample (NIS). Historical data were drawn from the 1995, 1996, 1997, 1998, 1999, 2000, 2001, 2002, 2003, and 2004 NIS. Supplemental sources included data on regional population estimates from Table 1: Annual Estimates of the Population for the United States, Regions, and States and for Puerto Rico: April 1, 2000 to July 1, 2006 (NST-EST2006-01), Population Division, U.S. Census Bureau, Release date: December 22, 2006 (http://www.census.gov/popest/). Definitions Diagnoses, ICD-9-CM, and Clinical Classifications Software (CCS) The principal diagnosis is that condition established after study to be chiefly responsible for the patient�s admission to the hospital. Secondary diagnoses are concomitant conditions that coexist at the time of admission or that develop during the stay. ICD-9-CM is the International Classification of Diseases, Ninth Revision, Clinical Modification, which assigns numeric codes to diagnoses. There are about 12,000 ICD-9-CM diagnosis codes. CCS categorizes ICD-9-CM diagnoses into 260 clinically meaningful categories.5 This "clinical grouper" makes it easier to quickly understand patterns of diagnoses and procedures. Case definition The ICD-9-CM codes defining depression include diagnosis codes in the following range: 293.83, 296.20-296.26, 296.30-296.36, 300.4, and 311. This analysis excludes any hospitalizations related to childbirth or the treatment of a neonate. Types of hospitals included in HCUP HCUP is based on data from community hospitals, defined as short-term, non-Federal, general and other hospitals, excluding hospital units of other institutions (e.g., prisons). HCUP data include OB-GYN, ENT, orthopedic, cancer, pediatric, public, and academic medical hospitals. They exclude long-term care, rehabilitation, psychiatric, and alcoholism and chemical dependency hospitals, but these types of discharges are included if they are from community hospitals. Unit of analysis The unit of analysis is the hospital discharge (i.e., the hospital stay), not a person or patient. This means that a person who is admitted to the hospital multiple times in one year will be counted each time as a separate "discharge" from the hospital. Costs and charges Total hospital charges were converted to costs using HCUP cost-to-charge ratios based on hospital accounting reports from the Centers for Medicare and Medicaid Services (CMS).6 Costs will tend to reflect the actual costs of production, while charges represent what the hospital billed for the case. For each hospital, a hospital-wide cost-to-charge ratio is used because detailed charges are not available across all HCUP States. Hospital charges reflect the amount the hospital charged for the entire hospital stay and does not include professional (physician) fees. For the purposes of this Statistical Brief, costs are reported to the nearest hundred. Payer Payer is the expected primary payer for the hospital stay. To make coding uniform across all HCUP data sources, payer combines detailed categories into more general groups: � Medicare includes fee-for-service and managed care Medicare patients. � Medicaid includes fee-for-service and managed care Medicaid patients. Patients covered by the State Children's Health Insurance Program (SCHIP) may be included here. Because most state data do not identify SCHIP patients specifically, it is not possible to present this information separately. � Private insurance includes Blue Cross, commercial carriers, and private HMOs and PPOs. � Other includes Worker's Compensation, TRICARE/CHAMPUS, CHAMPVA, Title V, and other government programs. � Uninsured includes an insurance status of "self-pay" and "no charge." When more than one payer is listed for a hospital discharge, the first-listed payer is used. Region Region is one of the four regions defined by the U.S. Census Bureau: � Northeast: Maine, New Hampshire, Vermont, Massachusetts, Rhode Island, Connecticut, New York, New Jersey, and Pennsylvania � Midwest: Ohio, Indiana, Illinois, Michigan, Wisconsin, Minnesota, Iowa, Missouri, North Dakota, South Dakota, Nebraska, and Kansas � South: Delaware, Maryland, District of Columbia, Virginia, West Virginia, North Carolina, South Carolina, Georgia, Florida, Kentucky, Tennessee, Alabama, Mississippi, Arkansas, Louisiana, Oklahoma, and Texas � West: Montana, Idaho, Wyoming, Colorado, New Mexico, Arizona, Utah, Nevada, Washington, Oregon, California, Alaska, and Hawaii About HCUP HCUP is a family of powerful healthcare databases, software tools, and products for advancing research. Sponsored by the Agency for Healthcare Research and Quality (AHRQ), HCUP includes the largest all-payer encounter-level collection of longitudinal healthcare data (inpatient, ambulatory surgery, and emergency department) in the United States, beginning in 1988. HCUP is a Federal-State-Industry Partnership that brings together the data collection efforts of many organizations�such as State data organizations, hospital associations, private data organizations, and the Federal government�to create a national information resource. HCUP would not be possible without the contributions of the following data collection Partners from across the United States: Arizona Department of Health Services Arkansas Department of Health & Human Services California Office of Statewide Health Planning & Development Colorado Health & Hospital Association Connecticut Integrated Health Information (Chime, Inc.) Florida Agency for Health Care Administration Georgia GHA: An Association of Hospitals & Health Systems Hawaii Health Information Corporation Illinois Health Care Cost Containment Council and Department of Public Health Indiana Hospital&Health Association Iowa Hospital Association Kansas Hospital Association Kentucky Cabinet for Health and Family Services Maryland Health Services Cost Review Commission Massachusetts Division of Health Care Finance and Policy Michigan Health & Hospital Association Minnesota Hospital Association Missouri Hospital Industry Data Institute Nebraska Hospital Association Nevada Division of Health Care Financing and Policy, Department of Human Resources New Hampshire Department of Health & Human Services New Jersey Department of Health and Senior Services New York State Department of Health North Carolina Department of Health and Human Services Ohio Hospital Association Oklahoma Health Care Information Center for Health Statistics Oregon Association of Hospitals and Health Systems Rhode Island Department of Health South Carolina State Budget & Control Board South Dakota Association of Healthcare Organizations Tennessee Hospital Association Texas Department of State Health Services Utah Department of Health Vermont Association of Hospitals and Health Systems Virginia Health Information Washington State Department of Health West Virginia Health Care Authority Wisconsin Department of Health & Family Services For additional HCUP statistics, visit HCUPnet, our interactive query system at datatools.ahrq.gov/hcupnet. About the NIS The HCUP Nationwide Inpatient Sample (NIS) is a nationwide database of hospital inpatient stays. The NIS is nationally representative of all community hospitals (i.e., short-term, non-Federal, non-rehabilitation hospitals). The NIS is a sample of hospitals and includes all patients from each hospital, regardless of payer. It is drawn from a sampling frame that contains hospitals comprising about 90 percent of all discharges in the United States. The vast size of the NIS allows the study of topics at both the national and regional levels for specific subgroups of patients. In addition, NIS data are standardized across years to facilitate ease of use. About HCUPnet HCUPnet is an online query system that offers instant access to the largest set of all-payer healthcare databases that are publicly available. HCUPnet has an easy step-by-step query system, allowing for tables and graphs to be generated on national and regional statistics, as well as trends for community hospitals in the U.S. HCUPnet generates statistics using data from HCUP's Nationwide Inpatient Sample (NIS), the Kids' Inpatient Database (KID), the State Inpatient Databases (SID) and the State Emergency Department Databases (SEDD). For More Information For more information about HCUP, visit www.hcup-us.ahrq.gov. For information on other hospitalizations in the U.S., download HCUP Facts and Figures: Statistics on Hospital-based Care in the United States in 2005, located at http://www.hcup-us.ahrq.gov/reports.jsp. For a detailed description of HCUP, more information on the design of the NIS, and methods to calculate estimates, please refer to the following publications: Steiner, C., Elixhauser, A., Schnaier, J. The Healthcare Cost and Utilization Project: An Overview. Effective Clinical Practice 5(3):143�51, 2002. Design of the HCUP Nationwide Inpatient Sample, 2005. Online. June 13, 2007. U.S. Agency for Healthcare Research and Quality.http://www.hcup-us.ahrq.gov/db/nation/nis/reports/NIS_2005_Design_Report.pdf Houchens, R., Elixhauser, A. Final Report on Calculating Nationwide Inpatient Sample (NIS) Variances, 2001. HCUP Methods Series Report #2003-2. Online. June 2005 (revised June 6, 2005). U.S. Agency for Healthcare Research and Quality. http://www.hcup-us.ahrq.gov/reports/methods/2003_02.pdf Houchens RL, Elixhauser A. Using the HCUP Nationwide Inpatient Sample to Estimate Trends. (Updated for 1988-2004). HCUP Methods Series Report #2006-05 Online. August 18, 2006. U.S. Agency for Healthcare Research and Quality. http://www.hcup-us.ahrq.gov/reports/methods/2006_05_NISTrendsReport_1988-2004.pdf Suggested Citation Russo, C. A. (Thomson Healthcare), Hambrick, M. M. (AHRQ), and Owens, P. L. (AHRQ). Hospital Stays Related to Depression, 2005. HCUP Statistical Brief #40. November 2007. Agency for Healthcare Research and Quality, Rockville, MD. http://www.hcup-us.ahrq.gov/reports/statbriefs/sb40.pdf *** AHRQ welcomes questions and comments from readers of this publication who are interested in obtaining more information about access, cost, use, financing, and quality of healthcare in the United States. We also invite you to tell us how you are using this Statistical Brief and other HCUP data and tools, and to share suggestions on how HCUP products might be enhanced to further meet your needs. Please e-mail us at hcup@ahrq.gov or send a letter to the address below:Irene Fraser, Ph.D., Director Center for Delivery, Organization, and Markets Agency for Healthcare Research and Quality 540 Gaither Road Rockville, MD 20850 1National Institutes of Health, National Institute of Mental Health, 2006. http://www.nimh.nih.gov/health/publications/depression-listing.shtml (Accessed on September 17, 2007). 2U.S. Department of Health and Human Services. Mental Health: A Report of the Surgeon General. Rockville, MD: Substance Abuse and Mental Health Services Administration, Center for Mental Health Services and National Institutes of Health, National Institute of Mental Health; 1999. 3U.S. Department of Health and Human Services. Mental Health, United States, 2002. Rockville, MD: Substance Abuse and Mental Health Services Administration, Center for Mental Health Services; 2004. 4All hospital stays related to childbirth and neonates were excluded from this analysis. 5HCUP CCS. Healthcare Cost and Utilization Project (HCUP). August 2006. U.S. Agency for Healthcare Research and Quality, Rockville, MD. www.hcup-us.ahrq.gov/db/state/costtocharge.jsp. 6HCUP Cost-to-Charge Ratio Files (CCR). Healthcare Cost and Utilization Project (HCUP). 2001�2005. U.S. Agency for Healthcare Research and Quality, Rockville, MD. www.hcup-us.ahrq.gov/db/state/costtocharge.jsp. |
| Table 1. Differences in hospital stays related to depression, 2005* | |||||||
| Depression as a principal diagnosis | Depression as a secondary diagnosis | No mention of depression | |||||
|---|---|---|---|---|---|---|---|
| Number of discharges (percentage of all hospital stays) |
423,300 (1.4%) |
2,470,000 (8.2%) |
27,169,200 (90.4%) |
||||
| Percentage of depression stays | 14.6% | 85.4% | -- | ||||
| Mean age, years | 41.8 | 58.1 | 58.0 | ||||
| Age distribution: | |||||||
| 17 years and younger | 9.7% | 1.7% | 6.7% | ||||
| 18-44 years | 48.7% | 24.0% | 19.4% | ||||
| 45-64 years | 29.0% | 34.8% | 28.3% | ||||
| 65 years and older | 12.4% | 39.5% | 45.5% | ||||
| Percentage female | 58.8% | 68.3% | 53.5% | ||||
| Mean length of stay, days | 6.6 | 5.1 | 5.0 | ||||
| Mean cost per day | $700 | $1,600 | $1,900 | ||||
| Mean cost per stay | $4,500 | $8,100 | $9,600 | ||||
| Aggregate costs | $1.9 billion | $19.9 billion | $261.8 billion | ||||
| Regional rates, hospitalizations per 10,000 population�: | |||||||
| Northeast | 17.3 | 97.4 | 995.4 | ||||
| Midwest | 19.5 | 102.4 | 959.1 | ||||
| South | 12.6 | 77.8 | 978.5 | ||||
| West | 9.4 | 62.2 | 714.0 | ||||
|
*Excludes hospital stays related to childbirth and neonates. �The denominator is the entire population in each region. Source: AHRQ, Center for Delivery, Organization, and Markets, Healthcare Cost and Utilization Project, Nationwide Inpatient Sample, 2005 and U.S. Census Bureau, Population Division, Census 2005. |
|||||||
| Table 2. Principal diagnoses for hospital stays with a secondary diagnosis of depression, 2005* | ||||
| Percent of stays with this principal diagnosis among stays with | ||||
|---|---|---|---|---|
| Rank | Principal diagnosis | Number of stays with depression as a secondary diagnosis | Depression as a secondary diagnosis | No mention of depression |
| 1 | Pneumonia | 109,700 | 3.8% | 4.4%� |
| 2 | Nonspecific chest pain | 83,500 | 2.9% | 2.7% |
| 3 | Chronic obstructive pulmonary disease and bronchiectasis | 78,400 | 2.7% | 2.0%� |
| 4 | Congestive heart failure | 69,100 | 2.4% | 3.8%� |
| 5 | Rehabilitation care; fitting of prostheses; and adjustment of devices | 62,200 | 2.2% | 1.7%� |
| 6 | Alcohol-related mental disorders | 61,900 | 2.1% | 0.6%� |
| 7 | Spondylosis; intervertebral disc disorders; other back problems | 60,200 | 2.1% | 2.2% |
| 8 | Osteoarthritis | 58,700 | 2.0% | 2.5%� |
| 9 | Coronary atherosclerosis | 57,400 | 2.0% | 3.9%� |
| 10 | Poisoning by other medications and drugs | 55,100 | 1.9% | 0.4%� |
| 11 | Fluid and electrolyte disorders | 51,500 | 1.8% | 1.8% |
| 12 | Urinary tract infections | 47,500 | 1.6% | 1.7% |
| 13 | Diabetes mellitus with complications | 44,600 | 1.5% | 1.6% |
| 14 | Complication of device; implant or graft | 42,300 | 1.5% | 2.1%� |
| 15 | Skin and subcutaneous tissue infections | 41,500 | 1.4% | 2.0%� |
| 16 | Cardiac dysrhythmias | 40,100 | 1.4% | 2.4%� |
| 17 | Substance-related mental disorders | 39,400 | 1.4% | 0.5%� |
| 18 | Acute cerebrovascular disease (stroke) | 38,400 | 1.3% | 1.8%� |
| 19 | Poisoning by psychotropic agents | 37,400 | 1.3% | 0.1%� |
| 20 | Asthma | 37,100 | 1.3% | 1.4% |
| Total for the top 20 principal diagnoses | 1,116,000 | 38.6% | 39.6% | |
| *Excludes hospital stays related to childbirth and neonates. �Significant difference between stays with depression and stays with no mention of depression at p<.05. Source: AHRQ, Center for Delivery, Organization, and Markets, Healthcare Cost and Utilization Project, Nationwide Inpatient Sample, 2005. | ||||
|
|
| Internet Citation: Statistical Brief #40. Healthcare Cost and Utilization Project (HCUP). November 2007. Agency for Healthcare Research and Quality, Rockville, MD. hcup-us.ahrq.gov/reports/statbriefs/sb40.jsp. |
| Are you having problems viewing or printing pages on this website? |
| If you have comments, suggestions, and/or questions, please contact hcup@ahrq.gov. |
| If you are experiencing issues related to Section 508 accessibility of information on this website, please contact hcup@ahrq.gov. |
| Privacy Notice, Viewers & Players |
| Last modified 11/16/07 |