![]() |
HCUP Visualization of Monthly Inpatient Trends
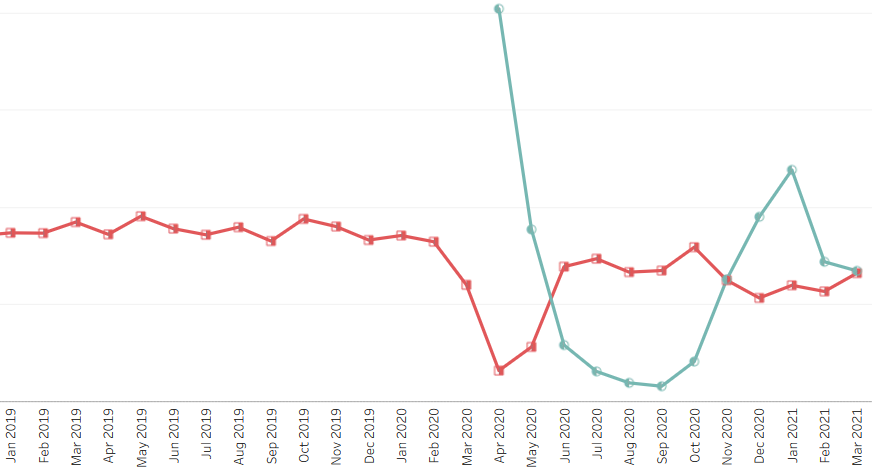
The HCUP Visualization of Monthly Inpatient Trends displays State-specific monthly trends in inpatient stays related to health conditions, and facilitates comparisons of the number of hospital discharges, the average length of stays, and in-hospital mortality rates across patient/stay characteristics and States. This information is based on the 2018-2020 State Inpatient Databases (SID), plus 2021 quarterly inpatient data, if available.
|
![]() |
HCUP Infographics
The HCUP infographics present a visual representation of data and information found in the HCUP Statistical Brief series and HCUP Findings-At-A-Glance.
|
Internet Citation: Data Visualizations. Healthcare Cost and Utilization Project (HCUP). February 2025. Agency for Healthcare Research and Quality, Rockville, MD. www.hcup-us.ahrq.gov/datavisualizations.jsp. |
Are you having problems viewing or printing pages on this website? |
If you have comments, suggestions, and/or questions, please contact hcup@ahrq.gov. |
Privacy Notice, Viewers & Players |
Last modified 2/6/25 |