
HEALTHCARE COST AND UTLIZATION PROJECT – HCUP
A FEDERAL-STATE-INDUSTRY PARTNERSHIP IN HEALTH DATA
Sponsored by the Agency for Healthcare Research and Quality
INTRODUCTION TO
THE HCUP NATIONWIDE EMERGENCY DEPARTMENT SAMPLE (NEDS)
2019
| Please read all documentation carefully.
THE NEDS CONTAINS A FULL YEAR OF INTERNATIONAL CLASSIFICATION OF DISEASES, TENTH REVISION, CLINICAL MODIFICATION/PROCEDURE CODING SYSTEM (ICD-10-CM/PCS) CODES BEGINNING WITH DATA YEAR 2016. |
| These pages provide an introduction to the 2018 NEDS.
For full documentation and notification of changes, visit the HCUP User Support (HCUP-US) website at www.hcup-us.ahrq.gov. |
Issued September 2021
Agency for Healthcare Research and Quality
Healthcare Cost and Utilization Project (HCUP)
NEDS Data and Documentation Distributed through the
HCUP Central Distributor
Phone: (866) 290-4287 (toll-free)
Email: HCUP@ahrq.gov
Table of Contents
Skip Table of ContentsIndex of Tables
Index of Figures
HCUP NATIONWIDE EMERGENCY DEPARTMENT SAMPLE (NEDS)
|
|
***** REMINDER ***** |
All users of the NEDS must take the online HCUP Data Use Agreement (DUA) Training Course as well as read and sign a DUA. Details and links may be found on the following page. Authorized users of HCUP data agree to the following restrictions:a
Any violation of the limitations in the DUA is punishable under Federal law by a fine, and up to 5 years in prison, or both. Violations may also be subject to penalties under State statutes. |
a This is a summary of key terms of the DUA for Nationwide Databases; please refer to the DUA for full terms and conditions. |
HCUP DATA USE AGREEMENT REQUIREMENTS
All HCUP data users, including data purchasers and collaborators, must complete the online HCUP Data Use Agreement (DUA) Training Course and read and sign the HCUP DUA. Proof of training completion and signed DUAs must be submitted to the HCUP Central Distributor.
Data purchasers will be required to provide their DUA training completion code and will execute their DUAs electronically as a part of the online ordering process. The DUAs and training certificates for collaborators and others with access to HCUP data should be submitted directly to the HCUP Central Distributor using the contact information below.
The online DUA Training Course is available at: www.hcup-us.ahrq.gov/tech_assist/dua.jsp.
The HCUP Nationwide DUA is available on the HCUP-US website at: www.hcup-us.ahrq.gov/team/NationwideDUA.pdf
HCUP CONTACT INFORMATION
HCUP Central Distributor and HCUP User Support
Information about the content of the HCUP databases is available on the HCUP User Support (HCUP-US) website (www.hcup-us.ahrq.gov).
If you have questions, please review the HCUP Frequently Asked Questions located at www.hcup-us.ahrq.gov/tech_assist/faq.jsp.
If you need further technical assistance, please contact the HCUP Central Distributor and User Support team at:
Phone: (866) 290-HCUP (4287) (toll free)
Email: HCUP@AHRQ.gov
Fax: (866) 792-5313 (toll free in the United States)
Mailing address:
HCUP Central Distributor
IBM Watson Health
5425 Hollister Avenue, Suite 140
Santa Barbara, CA 93111
|
WHAT IS THE NATIONWIDE EMERGENCY DEPARTMENT SAMPLE (NEDS)?
|
|
|
WHAT'S NEW IN THE 2019 NATIONWIDE EMERGENCY DEPARTMENT SAMPLE (NEDS)?
|
|
|
UNDERSTANDING THE NEDS
|
|
HEALTHCARE COST AND UTILIZATION PROJECT — HCUP
A FEDERAL-STATE-INDUSTRY PARTNERSHIP IN HEALTH DATA
Sponsored by the Agency for Healthcare Research and Quality
HCUP NATIONWIDE EMERGENCY DEPARTMENT SAMPLE (NEDS)
ABSTRACT
The Nationwide Emergency Department Sample (NEDS) is part of the Healthcare Cost and Utilization Project (HCUP) sponsored by the Agency for Healthcare Research and Quality (AHRQ). The NEDS was created to enable analyses of emergency department (ED) utilization patterns and to support researchers, public health professionals, administrators, policymakers, and clinicians in their decision-making regarding this critical source of care. The ED serves a dual role in the U.S. healthcare system infrastructure—as a point of entry for approximately 50 percent of inpatient hospital admissions and as a setting for treat-and-release outpatient visits.1 The NEDS has many research applications, because it contains information about geographic, hospital, and patient characteristics as well as descriptions of the nature of the visits (e.g., common reasons for ED visits, including injuries).
The NEDS is the largest all-payer ED database that is publicly available in the United States, containing information from 33.1 million ED visits at 989 sampled hospital-owned EDs in the U.S. Weights are provided to calculate national estimates representing about 143 million ED visits in the United States in 2019.
The NEDS is made possible by the voluntary participation of statewide data organizations that provide HCUP with data from ED visits that may or may not have resulted in a hospital admission. Forty-one HCUP Partner organizations participated in the 2019 NEDS. See Appendix A, Table A1 for a list of HCUP Partner organizations participating in the NEDS.
By stratifying on important hospital characteristics, the NEDS sample is designed to represent all U.S. hospital-owned EDs. The stratified sample design is based on the following five hospital characteristics:
Because the ICD-10-CM/PCS coding system was introduced on October 1, 2015, trends that rely on diagnoses and procedures may be interrupted. Analyses that do not rely on diagnosis and procedure coding should not be affected.
Access to the NEDS is open to users who sign a Data Use Agreement. Uses are limited to research and aggregate statistical reporting.
For more information on the NEDS, visit the AHRQ-sponsored HCUP User Support (HCUP-US) website at www.hcup-us.ahrq.gov/db/nation/neds/nedsdbdocumentation.jsp.
INTRODUCTION TO THE NATIONWIDE EMERGENCY DEPARTMENT SAMPLE (NEDS)
Overview of NEDS Data
The Healthcare Cost and Utilization Project (HCUP) Nationwide Emergency Department Sample (NEDS) was created to enable analyses of emergency department (ED) utilization patterns and to support researchers, public health professionals, administrators, policymakers, and clinicians in their decision-making regarding this critical source of care. The ED serves a dual role in the U.S. healthcare system infrastructure, as a point of entry for approximately 50 percent of inpatient hospital admissions and as a setting for treat-and-release outpatient visits.2 The NEDS supports many research applications, because it contains detailed information about geographic, hospital, and patient characteristics as well as the nature of visits (e.g., common reasons for ED visits, acute and chronic conditions, and injuries).
NEDS Data Sources, Hospitals, and ED Visits
The number of States, hospital-owned EDs, and ED visits included in the NEDS varies by year (Table 1). The names of the HCUP Partner organizations that contribute to the NEDS are in Appendix A, Table A1.
Table 1. Number of States, Hospital-Owned Emergency Departments, and Records in the NEDS by Year
| Data Year | Number of HCUP States in the NEDS | HCUP States in the NEDS | Number of Hospital-Owned EDs Sampled | Number of ED Visits in Sample (Unweighted) | Number of ED Visits, Weighted for National Estimates |
|---|---|---|---|---|---|
| 2019 | 41 | AK, AR, AZ, CA, CO, CT, DC, FL, GA, HI, IA, IL, IN, KS, KY, MA, MD, ME, MI, MN, MO, MS, MT, NC, ND, NE, NH, NJ, NV, NY, OH, OR, RI, SC, SD, TN, TX, UT, VT, WI, and WY (Added AK, HI, NH, and UT) | 989 | 33,147,251 | 143,432,284 |
| 2018 | 37 | AR, AZ, CA, CO, CT, DC, FL, GA, IA, IL, IN, KS, KY, MA, MD, ME, MI, MN, MO, MS, MT, NC, ND, NE, NJ, NV, NY, OH, OR, RI, SC, SD, TN, TX, VT, WI, and WY (Added MI; UT data were not available) | 990 | 35,807,950 | 143,454,430 |
| 2017 | 37 | AR, AZ, CA, CO, CT, DC, FL, GA, IA, IL, IN, KS, KY, MA, MD, ME, MN, MO, MS, MT, NC, ND, NE, NJ, NV, NY, OH, OR, RI, SC, SD, TN, TX, UT, VT, WI, and WY (Added CO; HI data were not available) | 984 | 33,506,645 | 144,814,803 |
| 2016 | 37 | AR, AZ, CA, CT, DC, FL, GA, HI, IA, IL, IN, KS, KY, MA, MD, ME, MN, MO, MS, MT, NC, ND, NE, NJ, NV, NY, OH, OR, RI, SC, SD, TN, TX, UT, VT, WI, and WY (Added OR and MS) | 953 | 32,680,232 | 144,842,742 |
| 2015 | 35 | AR, AZ, CA, CT, DC, FL, GA, HI, IA, IL, IN, KS, KY, MA, MD, ME, MN, MO, MT, NC, ND, NE, NJ, NV, NY, OH, RI, SC, SD, TN, TX, UT, VT, WI, and WY (Added TX) | 953 | 31,465,407 | 143,469,670 |
| 2014 | 34 | AR, AZ, CA, CT, DC, FL, GA, HI, IA, IN, KS, KY, IL, MA, MD, ME, MN, MO, MT, NC, ND, NE, NJ, NV, NY, OH, RI, SC, SD, TN, UT, VT, WI, and WY (Added DC, MT, and WY) | 945 | 31,026,417 | 137,807,901 |
| 2013 | 30 | AR, AZ, CA, CT, FL, GA, HI, IA, IN, KS, KY, IL, MA, MD, MN, MO, NC, ND, NE, NJ, NV, NY, OH, RI, SC, SD, TN, UT, VT, and WI (Added AR; ME data were not available) | 947 | 29,581,718 | 134,869,015 |
| 2012 | 30 | AZ, CA, CT, FL, GA, HI, IA, IN, KS, KY, IL, MA, MD, ME, MN, MO, NC, ND, NE, NJ, NV, NY, OH, RI, SC, SD, TN, UT, VT, and WI | 950 | 31,091,029 | 134,399,179 |
| 2011 | 30 | AZ, CA, CT, FL, GA, HI, IA, IN, KS, KY, IL, MA, MD, ME, MN, MO, NC, ND, NE, NJ, NV, NY, OH, RI, SC, SD, TN, UT, VT, and WI (Added ND; NH data were not available) | 951 | 29,421,411 | 131,048,605 |
| 2010 | 28 | AZ, CA, CT, FL, GA, HI, IA, IN, KS, KY, IL, MA, MD, MN, MO, NC, NE, NJ, NV, NY, OH, RI, SC, SD, TN, UT, VT, and WI (Added NV; ME and NH data were not available) | 961 | 28,584,301 | 128,970,364 |
| 2009 | 29 | AZ, CA, CT, FL, GA, HI, IA, IN, KS, KY, IL, MA, MD, ME, MN, MO, NC, NE, NH, NJ, NY, OH, RI, SC, SD, TN, UT, VT, and WI (Added IL) | 964 | 28,861,047 | 128,885,040 |
| 2008 | 28 | AZ, CA, CT, FL, GA, HI, IA, IN, KS, KY, MA, MD, ME, MN, MO, NC, NE, NH, NJ, NY, OH, RI, SC, SD, TN, UT, VT, and WI (Added KY) | 980 | 28,447,148 | 124,945,264 |
| 2007 | 27 | AZ, CA, CT, FL, GA, HI, IA, IN, KS, MA, MD, ME, MN, MO, NC, NE, NH, NJ, NY, OH, RI, SC, SD, TN, UT, VT, and WI (Added NC, NY, RI) | 966 | 26,627,923 | 122,331,739 |
| 2006 | 24 | AZ, CA, CT, FL, GA, HI, IA, IN, KS, MA, MD, ME, MN, MO, NE, NH, NJ, OH, SC, SD, TN, UT, VT, and WI | 955 | 25,702,597 | 120,033,570 |
| Abbreviations: ED, emergency department; HCUP, Healthcare Cost and Utilization Project; NEDS, Nationwide Emergency Department Sample. | |||||
Appendix A, Figure A1 represents the geographic distribution of the 41 HCUP Partner organizations participating in the 2019 NEDS. Based on U.S. Census Bureau data, the HCUP NEDS States (with the District of Columbia) account for 84.9 percent of the U.S. population in 2019. The 41 Partner organizations account for 83.9 percent of the ED visits reported in the 2019 American Hospital Association (AHA) Annual Survey Database. Details on the percentage of population and ED visits by region are provided in Appendix A, Table A2.
Identification of HCUP Records With Emergency Department Services
Records for ED visits are contained in two existing HCUP databases:
Both of these HCUP databases contain a core set of clinical and nonclinical data elements defined in a uniform scheme for all patients, regardless of payer. This scheme makes it possible to combine records across databases.
Selection of ED records from the SEDD and SID for the NEDS is based on evidence of ED services reported on the record. HCUP Partner organizations use differing methods to identify ED records. The HCUP criterion for identifying an ED record (i.e., a discharge record for a patient with an ED visit) is that it meets at least one of the following conditions:
Of the 41 HCUP Partner organizations contributing to the 2019 NEDS, 12 (Arkansas, Arizona, California, Connecticut, Florida, Massachusetts, Mississippi, Montana, New Hampshire, Nevada, Orgeon, and Utah) provided a source file that contained only ED treat-and-release records. Because the data source provided a dedicated outpatient ED file, all of the SEDD records were considered ED records, even though information may not have been available to determine whether HCUP criteria were met.
Partner-Specific Restrictions
Some HCUP Partner organizations that contributed data to the NEDS imposed restrictions on the release of certain data elements or on the number and types of hospitals that could be included in the database. In addition, because of confidentiality laws, some data sources were prohibited from providing HCUP with discharge records that indicated specific medical conditions, such as HIV/AIDS or behavioral health conditions. Detailed information on these Partner-specific restrictions is available in Appendix B, Table B1
ICD-10-CM/PCS Started October 1, 2015 at the Beginning of Fiscal Year 2016
On October 1, 2015, the United States transitioned from using the International Classification of Diseases, Ninth Revision, Clinical Modification (ICD-9-CM) to the Tenth Revision (ICD-10-CM/Procedure Coding System [PCS])code sets for reporting medical diagnoses and inpatient procedures. ICD-10-CM/PCS consists of two parts:
The HCUP User Support (HCUP-US) website has an ICD-10-CM/PCS Resources section that summarizes key issues for researchers using HCUP and other administrative databases that include ICD-9-CM and ICD-10-CM/PCS coding. The web page provides general guidance and forewarning to users analyzing outcomes that may be affected by the transition to the ICD-10-CM/PCS coding system and lists other related web resources.
File Structure of the NEDS
Because of the size of the NEDS and the difference in information collected on records for patients admitted into the hospital directly from the ED (SID records) and for ED patients that are not admitted (SEDD records), the NEDS is divided into five types of files:
File Structure of the NEDS in all years except 2015. The NEDS is an annual, calendar year file based on discharge date. Prior to 2015, the NEDS includes ICD-9-CM diagnosis and procedure codes. Starting in 2016, the NEDS includes ICD-10-CM/PCS codes.
File structure of the 2015 NEDS. The introduction of ICD-10-CM/PCS in the United States on October 1, 2015, means that the 2015 NEDS includes a combination of codes:
To alert users to this change in the ICD coding scheme, the file structure of the 2015 NEDS differs from the annual files for other data years in three primary ways:
More information about the file structure of the 2015 NEDS is available in the Introduction to the Nationwide Emergency Department Sample (NEDS), 2015, and on the NEDS Database Documentation page of the HCUP-US website.
NEDS Data Elements
The coding of data elements in the NEDS is consistent with other HCUP databases. The following three objectives guided the definition of data elements in all HCUP databases:
More information on the coding of HCUP data elements is available on the HCUP Coding Practices page of the HCUP-US website.
After analyzing the availability of information from the HCUP Partner organizations, a set of common fields to be available in the NEDS was created. The NEDS contains more than 100 clinical and nonclinical variables provided in a hospital discharge abstract, such as the following:
Appendix C identifies the data elements in each NEDS file:
The tables in Appendix C provide summary documentation for the data. Please refer to the NEDS Description of Data Elements page on the HCUP-US website for more comprehensive information about data elements.
Getting Started
The HCUP NEDS is distributed as comma-separated values (CSV) files delivered via secure digital download from the online HCUP Central Distributor. The files are compressed and encrypted with SecureZIP® from PKWARE®.
The NEDS product is downloaded in a single zipped file for each year that contains several data-related files and accompanying documentation. The five compressed data-related files are as follows:
The total size of the CSV version of the NEDS is 52 GB. The NEDS files loaded into SAS are about 12 GB. In SAS, the largest use of space typically occurs during PROC SORT, which requires workspace about three times the size of the file. Thus, the NEDS files would require at least 40 GB of available workspace to perform a sort procedure. Most SAS data steps will require twice the storage of the file, so that both the input and output files can coexist. The NEDS files loaded into SPSS are about 31 GB. Because Stata loads the entire file into memory, it may not be possible to load every data element in the NEDS Core file into Stata. Stata users will need to maximize memory and use the "_skip" option to select a subset of data elements. More details are provided in the Stata load programs.
With a file of this size and without careful planning, space could easily become a problem in a multistep program. It is not common to produce several versions of a file during data preparation, as well as further multiple versions for analysis. Therefore, the amount of space required could escalate rapidly.
Decompressing the NEDS Files
To extract the data files from the compressed download file, follow these steps:
Downloading and Running the Load Programs
Programs to load the data into SAS, SPSS, or Stata, are available on the HCUP-US website. To download and run the load programs, follow these steps:
NEDS Documentation
Comprehensive documentation for the NEDS files is available on the NEDS Database Documentation page of the HCUP-US website. Users of the NEDS can access complete file documentation, including variable notes, file layouts, summary statistics, and related technical reports. Data users can also download SAS, SPSS, and Stata load programs. These important resources help the user understand the structure and content of the NEDS and aid in using the database. Appendix A, Table A3 details the comprehensive NEDS documentation available on HCUP-US.
HCUP Online Tutorials
For additional assistance, AHRQ has created the HCUP Online Tutorial Series, a series of free, interactive courses that provide information on using HCUP data and tools and training on technical methods for conducting research with HCUP data. Topics include an HCUP Overview Course and these tutorials:
New tutorials are added periodically. The tutorials can be found on the HCUP Online Tutorial Series page of the HCUP-US website.
SAMPLING DESIGN OF THE NEDS
The NEDS is built using a 20-percent stratified sample of hospital-owned EDs in the United States. The main objective of a stratified sample is to ensure that it is representative of the target universe. By stratifying on important hospital characteristics, the NEDS represents a "microcosm" of EDs in the United States. For example, by including trauma center designation in the sampling strategy, the NEDS has the same percentage of trauma hospitals as the entire United States. The NEDS contains all of the ED visits that occurred at the hospital-owned EDs in the sample.
Universe of Hospital-Owned Emergency Departments
A feasibility study performed in 2008 assessed several possible data sources comprising the universe of hospital-owned EDs in the United States: the American Hospital Association (AHA) Annual Survey Database (Health Forum, LLC © 2007), Verispan, LLC databases (now called IMS Health, Inc.), and the Centers for Medicare & Medicaid Services Hospital Cost Reports. The AHA Annual Survey Database was chosen, for two main reasons. First, the AHA data provide the necessary hospital characteristics, such as ownership type and teaching status, and also report total ED visits for hospitals. Second, the crosswalk linkage from the HCUP databases to the AHA data is already established. The universe of hospital-owned EDs is therefore defined as the AHA community, nonrehabilitation hospitals that reported total ED visits. The AHA defines community hospitals as "all non-Federal, short-term, general, and other specialty hospitals open to the public."4 Included among community hospitals are pediatric institutions, public hospitals, and academic medical centers.
Sampling Frame of the NEDS
The sampling frame of the NEDS does not cover the entire target universe. The target universe consists of all the hospital-owned EDs in the U.S. (including the District of Columbia). The coverage of the sampling frame is limited because HCUP ED data (SID and SEDD) are not available in all States, the identification of HCUP hospitals in the AHA is imperfect, and the AHA data is incomplete. The sampling frame, a set of hospital-owned EDs, consists of AHA community, nonrehabilitation hospitals that report total ED visits and that could be accurately matched to the ED data provided to HCUP. If an ED in the AHA survey could not be matched to the ED data provided by the HCUP data source, it was eliminated from the sampling frame (but not from the target universe).
Stratification Variables
The following hospital characteristics were used for sample stratification: U.S. census region, trauma center designation, urban-rural location of the hospital, ownership, and teaching status. ED bed size was not used because no data source for this information could be identified. A number of data sources report the bed size of the hospital, but no source distinguishes between inpatient and ED beds.
The NEDS stratification variables are described below and detailed in Appendix A, Table A4.
U.S. Census Region
The four Census regions–Northeast, Midwest, South, and West–were used to stratify EDs by geographic location because practice patterns may vary substantially by region. Appendix A, Figure A1 shows the NEDS States by region.
Trauma Centers
A trauma center is a hospital equipped to provide comprehensive emergency medical services 24 hours a day, 365 days a year to patients with traumatic injuries. In 1976, the American College of Surgeons Committee on Trauma (ACS/COT) defined five levels of trauma centers:5
The ACS/COT verifies hospitals as trauma level I, II, or III.6 It is important to note that although all level I, II, and III trauma centers offer a high level of trauma care, there may be differences in the specific services and resources offered by hospitals between the different levels. Trauma levels IV and V are designated at the State level (and not by ACS/COT) with varying criteria applied across States.
The level of the trauma centers in the NEDS was identified using the Trauma Information Exchange Program (TIEP) database, a national inventory of trauma centers in the United States collected by the American Trauma Society (ATS).7 The TIEP database identifies all U.S. trauma centers that are level I, II, or III that treat both adults and children. TIEP includes some information on trauma centers within children's hospitals, but this is not the focus. To ensure that all trauma centers are identified for the NEDS, ATS reviews the ACS/COT list of trauma centers and all State-specific websites on emergency services to identify any additional trauma centers within children's hospitals and their associated trauma levels.
The stratum for trauma center in the NEDS was limited to trauma levels I, II, and III. The distinction between Level IV and V centers was not incorporated because the criteria for these designations varied across States. For hospital confidentiality purposes, a collapsed stratification was necessary if the stratum size in the universe or the frame was fewer than two hospitals. In such situations, the collapsed categories varied by data year:
The change between the 2010 and 2011 NEDS was prompted by differences between injury-related services provided by level I and II trauma centers versus injury-related services provided by level III trauma centers. Services at level III trauma centers were more similar to non-trauma hospitals.
Urban-Rural Location of the ED
The urban-rural location of hospital-owned EDs was determined by the county in which the hospital was located. The categorization is based on Urban Influence Codes (UIC).8 Starting in the 2014 NEDS, the categorization is a simplified adaptation of the 2013 version of the UIC. Prior to 2014, the categorization is a simplified adaptation of the 2003 version of the UIC. The 12 detailed UIC categories are combined into 4 broader categories:
If the stratum size in the universe or frame was fewer than two hospitals, a collapsed stratification of metropolitan (large and small), nonmetropolitan (micropolitan and nonurban residual), small metropolitan and micropolitan, 9 or all areas10 was necessary.
Teaching Status
A hospital-owned ED is considered a teaching hospital if it has one or more Accreditation Council for Graduate Medical Education (ACGME)-approved residency program, is a member of the Council of Teaching Hospitals, or has a ratio of full-time equivalent interns and residents to beds of 0.25 or higher. Beginning with the 2014 NEDS, there is an increase in the number of hospitals identified as teaching facilities because the AHA Annual Survey reported an increase in facilities with approved residency programs. About this time, the ACGME became the primary organization for residency training approval. Because there are very few teaching hospitals in micropolitan and rural areas, teaching status was only used to stratify EDs in metropolitan areas.
Hospital Ownership
Hospital ownership or control was categorized according to information reported in the AHA Annual Survey Database. The ownership categories include (1) public (government, non-Federal), (2) voluntary (private, not for profit), and (3) proprietary (private, investor owned/for profit).
When there were enough hospitals of each type, EDs were stratified into public, voluntary, and proprietary categories. If necessary, because of small stratum size in the universe, a collapsed stratification of public versus private was used; that is, the voluntary, nonprofit, and proprietary/for-profit hospitals were combined to form a single "private" category. Stratification based on ownership or control was not implemented in some regions (e.g., Northeast) because of the dominance of one hospital type.
Sample Weights
To enable nationwide estimates, weights were developed using the AHA universe as the standard. Two weights were developed to allow analysis of two distinct units of observation: facilities (hospital-owned EDs) and ED visits. Hospital-level weights expand the NEDS sample of EDs to represent the universe of hospital-owned EDs. Similarly, discharge-level weights expand the ED visits in the NEDS sample to represent the universe of ED visits.
Hospital Weights
Hospital weights were calculated by stratum. Hospital-owned EDs were stratified on the same variables that were used for sampling: geographic region, trauma center designation, urban-rural location, teaching status, and ownership or control. The strata that were collapsed for sampling were also collapsed for sample weight calculations. Within each stratum, s, each ED in the NEDS sample received a weight:
Discharge Weights
Discharge weights were also calculated by stratum. Hospital-owned EDs were stratified in a manner similar to that for universe hospital-weight calculations. Within stratum s for hospital i, the universe weight for each visit in the NEDS sample was calculated as follows:
Final NEDS Sample
The target universe for the NEDS was: (1) community, non-rehabilitation hospital-owned EDs in the United States that were included in the 2019 AHA Annual Survey Database, and (2) reported total ED visits. Excluded were 44 nonrural hospitals that reported fewer than 10 ED visits in data year 2019.
The NEDS sampling frame included hospital-owned ED visits from community, non-rehabilitation hospitals in the 41 HCUP Partner organizations that provided discharge abstracts on patients admitted to the hospital through the ED and on patients treated and released or transferred to another hospital from the ED. The HCUP hospitals were required to be represented in the AHA data and have no more than 90 percent of their ED visits resulting in admission. Appendix A, Table A5 lists the number of EDs and ED visits in the target universe, the sampling frame, and the sample.
The NEDS is a stratified probability sample of hospital-owned EDs in the frame. Sampling probabilities were calculated to select 20 percent of the universe contained in each stratum, which was defined by region, trauma designation, urban-rural location, teaching status, and hospital ownership or control. A sample size of 20 percent was based on previous experience with similar research databases. A larger sample would be cumbersome for data users, given that a 20-percent sample contains about 30 million records. A 20-percent sample also enables an analyst to split the NEDS into two 10-percent subsamples for estimation and validation of models.
Using the universe of U.S. hospital-owned EDs, strata were defined by region, trauma designation, urban-rural location, teaching status, and hospital ownership or control. Strata with fewer than two hospitals in the universe and frame were collapsed with adjacent strata on the dimensions of urban-rural location, trauma designation, or ownership or control. Prior to sampling, the list of frame hospitals within each stratum is sorted as follows to ensure geographic representation within strata: (1) sorted by the first three digits of the hospital's ZIP Code and (2) sorted by a random number within the three-digit ZIP Code 11 After stratifying and sorting the frame hospitals, a random sample of up to 20 percent of the total number of hospital-owned EDs in the United States was selected within each stratum. A stratum with a shortfall was defined as having an insufficient number of EDs in the frame to meet the threshold of 20 percent of the universe for that stratum. In strata with shortfalls, the sampling rate from the universe was less than 20 percent and all possible EDs in the frame were selected for the NEDS. In contrast, the sampling rate is larger than 20 percent in some strata because protecting hospital confidentiality required a minimum of two sampled EDs in each stratum. Appendix A, Table A6 lists the sampling rates by region and stratum for the NEDS.
HOW TO USE THE NEDS FOR DATA ANALYSIS
This section provides a brief synopsis of special considerations for analyzing NEDS data. For more details, refer to the comprehensive documentation on the NEDS Database Documentation page of the HCUP-US website.
Data Use Agreement
Anyone accessing the NEDS (whether or not they are the original recipient of the data) must complete the online HCUP Data Use Agreement Training available on the HCUP-US website and then read and sign a Data Use Agreement. A copy of the signed Data Use Agreements must be sent to the HCUP Central Distributor.
Limitations of the NEDS
The NEDS contains more than 30 million ED records and more than 100 clinical and nonclinical data elements. A multitude of research studies can be conducted with the data, but there are some limitations.
Identifying Different Types of ED Events
The HCUP data element ED event distinguishes among the different types of ED visits: Appendix A, Table A7 provides the number and percentage of records in the 2019 NEDS for each of the five ED event types.
Calculating National Estimates
To produce national estimates, weights MUST be applied to the sample.
Because the NEDS is a stratified sample, proper statistical techniques must be used to calculate standard errors and confidence intervals. For detailed instructions, refer to the HCUP Methods Series report #2003-02 Calculating Nationwide Inpatient Sample (NIS) Variances for Data Years 2011 and Earlier on the HCUP-US website. Prior to 2012, the NIS used a stratified sample design similar to the NEDS, so techniques appropriate for the NIS prior to 2012 are also appropriate for the NEDS.
When creating national estimates, it is advisable to check results against other data sources, if available. Summary independent benchmarks for NEDS estimates are in Appendix D. Other ED data sources include, for example, the National Hospital Ambulatory Medical Care Survey which has an ED component and publishes national health statistics annually.
To ensure that weights are applied appropriately and estimates and variances are calculated accurately, researchers can also access HCUPnet the free online query system. HCUPnet is a web-based query tool for identifying, tracking, analyzing, and comparing statistics on hospitals at the national, regional, and State levels. HCUPnet offers easy access to national statistics and trends as well as selected State statistics about hospital stays, ED visits, and ambulatory surgeries. This tool provides step-by-step guidance, helping researchers quickly obtain the statistics they need. HCUPnet generates statistics from the HCUP databases.
Choosing Data Elements for Analysis
For any data element of interest, the analyst should first examine descriptive statistics such as the range of values and the number of missing values. Summary statistics are also available on the NEDS Summary Statistics page of the HCUP-US website. When anomalies (e.g., a large amount of missing values) are detected, descriptive statistics by region or by hospital (HOSP_ED) may be informative.
ICD-9-CM and ICD-10-CM/PCS Diagnosis and Procedure Codes and CPT Procedure Codes
Missing Values
Missing data values can compromise the quality of estimates. For example, if the outcome for ED visits with missing values differs from the outcome for ED visits with valid values, then estimates for that outcome will be biased and inaccurately represent the ED utilization patterns. Several techniques are available to help overcome this bias. One strategy is to use imputation to replace missing values with acceptable values. Another strategy is to use sample weight adjustments to compensate for missing values. Descriptions of such data preparation and adjustment are outside the scope of this report; however, it is recommended that researchers evaluate and adjust for missing data, if necessary.
Alternatively, if the cases with and without missing values are assumed to be similar with respect to their outcomes, no adjustment may be necessary for estimates of means and rates because the nonmissing cases would be representative of the missing cases. However, some adjustment may still be necessary for the estimates of totals. Sums of data elements (e.g., aggregate ED charges) containing missing values would be incomplete because cases with missing values would be omitted from the calculations. Estimates of the sum of charges can be calculated as the product of the number of cases times the average charge to account for records with missing information.
Variance Calculations
It may be important for researchers to calculate a measure of precision for some estimates based on the NEDS sample data. Variance estimates must account for both the sampling design and the form of the statistic. The sampling design consisted of a stratified, single-stage cluster sample. A stratified random sample of hospital-owned EDs (clusters) was drawn, and then all ED visits were included from each selected hospital. To accurately calculate variances from the NEDS, appropriate statistical software and techniques must be used. For detailed instructions, refer to the HCUP Methods Series report #2003-02 Calculating Nationwide Inpatient Sample (NIS) Variances for Data Years 2011 and Earlier. Prior to 2012, the NIS used a stratified sample design similar to the NEDS, so techniques appropriate for the NIS prior to 2012 are also appropriate for the NEDS.
A multitude of statistics can be estimated from the NEDS data. Several computer programs that calculate statistics and their variances from sample survey data are listed in the next section. Some of these programs use general methods of variance calculations (e.g., the jackknife and balanced half-sample replications) that account for the sampling design. However, it may be desirable to calculate variances using formulas specifically developed for certain statistics.
Variance calculations that factor in the cluster and strata are based on finite-sample theory, which is an appropriate method for obtaining cross-sectional, nationwide estimates of outcomes. According to finite-sample theory, the intent of the estimation process is to obtain estimates that are precise representations of the nationwide population at a specific point in time. In the context of the NEDS, any estimates that attempt to accurately describe characteristics and interrelationships among hospitals and ED visits during a specific year should be governed by finite-sample theory. Examples would be estimates of expenditure and utilization patterns.
Alternatively, in the study of hypothetical population outcomes not limited to a specific point in time, the concept of a "superpopulation" may be useful. Analysts may be less interested in specific characteristics of the finite population (and period) from which the sample was drawn than they are in hypothetical characteristics of a conceptual superpopulation from which any particular finite population in a given year might have been drawn. According to this superpopulation model, the nationwide population in a given year is only a snapshot in time of the possible interrelationships between hospital, market, and discharge characteristics. In a given year, all possible interactions between such characteristics may not have been observed, but analysts may wish to predict or simulate interrelationships that may occur in the future.
Under the finite-population model, the variances of estimates approach zero as the sampling fraction approaches one. This is the case because the population is defined at that point in time and because the estimate is for a characteristic as it existed when sampled. The superpopulation model, in contrast, adopts a stochastic viewpoint rather than a deterministic viewpoint. That is, the nationwide population in a particular year is viewed as a random sample of some underlying superpopulation over time. Different methods are used for calculating variances under the two sample theories. The choice of an appropriate method for calculating variances for nationwide estimates depends on the type of measure and the intent of the estimation process.
Computer Software for Applying Weights and Calculating Variance
The hospital weights produce hospital-level statistics for analysis at the hospital-owned ED unit of analysis. In contrast, the discharge weights produce visit-level statistics for analysis that centers on the ED visit as the unit of analysis.
In most cases, computer programs are readily available to perform both types of calculations. Several statistical programming packages allow weighted analyses.12 For example, nearly all SAS procedures can incorporate weights. In addition, several statistical analysis programs have been developed to specifically calculate statistics and their standard errors from survey data. Version 8 or later of SAS contains procedures (PROC SURVEYMEANS and PROC SURVEYREG) for calculating statistics from complex sampling designs. Stata and SUDAAN® are two other common statistical software packages that perform calculations for numerous statistics arising from the stratified, single-stage cluster sampling design. Examples of the use of SAS, SUDAAN, and Stata to calculate NIS variances are presented in the special report Calculating Nationwide Inpatient Sample (NIS) Variances for Data Years 2011 and Earlier. Although the examples using the NIS also apply to the NEDS, it should be noted that the NEDS is a much larger dataset. Please consult the documentation for the different software packages concerning the use of large databases. For a review of programs to calculate statistics from survey data, visit the Summary of Survey Analysis Software page on the Harvard Medical School website.
The NEDS includes a Hospital Weights File with variables required by these programs to calculate finite-population statistics. The file includes hospital identifiers (Primary Sampling Units), stratification variables, and stratum-specific totals for the number of ED visits and hospitals so that finite-population corrections can be applied to variance estimates.
In addition to these subroutines, standard errors can be estimated by validation and cross-validation techniques. Given that a very large number of observations will be available for most NEDS analyses, it may be feasible to set aside a part of the data for validation purposes. Standard errors and confidence intervals then can be calculated from the validation data.
If the analytic file is too small to set aside a large validation sample, cross-validation techniques may be used. For example, 10-fold cross-validation would split the data into 10 subsets of equal size. The estimation would take place in 10 iterations. In each iteration, the outcome of interest is predicted for one-tenth of the observations by an estimate based on a model that is fit to the other nine-tenths of the observations. Unbiased estimates of error variance are then obtained by comparing the actual values to the predicted values obtained in this manner.
COMPARABLE ED DATA SOURCES
To aid in understanding the NEDS, analysts can compare national estimates from the NEDS to other available data sources (Table 2). Each of the ED data sources in Table 2 has potential for use in research addressing ED utilization and policy.
Table 2. Sources of Emergency Department (ED) Data by Type
| Type of ED Data | ED Data Source | Description |
|---|---|---|
| National inventories of EDs | AHA Annual Survey Data | Database containing characteristics and descriptions of hospitals in the United States reported by hospitals via survey. Owned by Health Forum. |
| National Emergency Department Inventory — USA | Inventory of ED locations in the United States and annual ED visit volume that integrates information from the AHA Annual Survey Database, the Hospital Market Profiling Solution© internet searches, and direct communication with hospital staff. Created by the Emergency Medicine Network. | |
| ED visit information from a sample of EDs | HCUP Nationwide Emergency Department Sample | Nationwide sample drawn from the HCUP SID and SEDD, stratified and weighted to be nationally representative of ED visits and facilities. Sponsored by AHRQ. |
| National Hospital Ambulatory Medical Care Survey | National probability sample survey of utilization and provision of ambulatory services in hospital emergency and outpatient departments. Sponsored by the National Center for Health Statistics of the CDC. | |
| National Electronic Injury Surveillance System - All Injury Program | National probability sample providing counts of injuries seen in the ED. Sponsored by the National Center for Injury Prevention and Control of the CDC and the U.S. Consumer Product Safety Commission. | |
| ED visit information from a sample of patients | National Health Interview Survey | A comprehensive survey of the civilian noninstitutionalized population residing in the United States at the time of the interview. Sponsored by the National Center for Health Statistics of the CDC. |
| Abbreviations: AHA, American Hospital Association; AHRQ, Agency for Healthcare Research and Quality; CDC, the Centers for Disease Control and Prevention; HCUP, Healthcare Cost and Utilization Project; SEDD, State Emergency Department Databases; SID, State Inpatient Databases. | ||
Information on total ED visits in 2019 for the United States was available from three data sources (AHA, NEDS, and National Health Interview Survey)13. Appendix D, Figure D1, displays the range of aggregate ED visits; Appendix D, Table D1 lists the total ED visits in the United States by census region. The total U.S. ED visit counts are relatively consistent across the data sources. The South consistently had the highest number of ED visits.
Estimates of the number of hospital-owned EDs by ED visit volume are available from two data sources (NEDS and AHA) and are displayed in Appendix D, Table D2.
Estimates of the number of ED visits related to nonfatal ED visits are available from two data sources (NEDS and National Electronic Injury Surveillance System - All Injury Program) and are displayed in Appendix D, Table D3.
Appendix A: NEDS States, Sampling Strata and Rates, and Website Resources
Table A1. States Data Organizations Providing SID and SEDD and Participating in the 2019 NEDS
| State | Data Organization |
|---|---|
| AK | Alaska Department of Health and Social Services |
| AR | Arkansas Department of Health |
| AZ | Arizona Department of Health Services |
| CA | California Office of Statewide Health Planning & Development |
| CO | Colorado Hospital Association |
| CT | Connecticut Hospital Association |
| DC | District of Columbia Hospital Association |
| FL | Florida Agency for Health Care Administration |
| GA | Georgia Hospital Association |
| HI | Hawaii Laulima Data Alliance |
| IA | Iowa Hospital Association |
| IL | Illinois Department of Public Health |
| IN | Indiana Hospital Association |
| KS | Kansas Hospital Association |
| KY | Kentucky Cabinet for Health and Family Services |
| MA | Massachusetts Center for Health Information and Analysis |
| MD | Maryland Health Services Cost Review Commission |
| ME | Maine Health Data Organization |
| MI | Michigan Health and Hospital Association |
| MN | Minnesota Hospital Association |
| MO | Missouri Hospital Industry Data Institute |
| MS | Mississippi State Department of Health |
| MT | Montana Hospital Association |
| NC | North Carolina Department of Health and Human Services |
| ND | North Dakota (data provided by the Minnesota Hospital Association) |
| NE | Nebraska Hospital Association |
| NJ | New Jersey Department of Health |
| NV | Nevada Department of Health and Human Services |
| NH | New Hampshire Department of Health & Human Services |
| NY | New York State Department of Health |
| OH | Ohio Hospital Association |
| OR | Oregon Association of Hospitals and Health Systems Oregon Office of Health Analytics |
| RI | Rhode Island Department of Health |
| SC | South Carolina Revenue and Fiscal Affairs Office |
| SD | South Dakota Association of Healthcare Organizations |
| TN | Tennessee Hospital Association |
| TX | Texas Health Care Information Collection |
| UT | Utah Department of Health |
| VT | Vermont Association of Hospitals and Health Systems |
| WI | Wisconsin Department of Health Services |
| WY | Wyoming Hospital Association |
| Abbreviation: NEDS, Nationwide Emergency Department Sample. | |
Figure A1. Map of States Providing SID and SEDD to HCUP and Participating in the 2019 NEDS
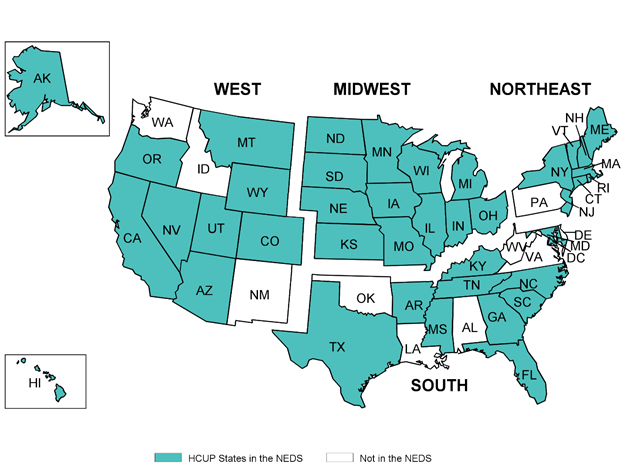
Abbreviations: HCUP, Healthcare Cost and Utilization Project; NEDS, Nationwide Emergency Department Sample.
The above graphic outlines 2019 states in the NEDS by Region. In the Western region, AK, AZ, CA, CO, HI, MT, NV, OR, UT, WY are in the HCUP NEDS. The following states are not in the NEDS in this region - ID, NM, WA. In the Midwestern region, IA, IN, IL, KS, MN, MO, ND, NE, OH, SD, WI are in the HCUP NEDS. In the Northeastern region, CT, MA, ME, NH, NJ, NY, RI, VT are in the HCUP NEDS. The following state is not in the NEDS in this region - PA. In the Southern region, AR, DC, FL, GA, KY, MD, MS, NC, SC, TN, TX are in the HCUP NEDS. The following states are not in the NEDS in this region - AL, DE, LA, OK, VA, WV.
Table A2. Coverage of the U.S. Population and AHA ED Visits by the 41 NEDS States, 2019
| Region | Population, 2019 | Population Residing in NEDS States | Percent of Population Residing in NEDS States | Number of AHA ED Visits, 2019 | Number of ED Visits in NEDS States | Percent of ED Visits in NEDS States |
|---|---|---|---|---|---|---|
| Northeast | 56,002,934 | 43,204,051 | 77.1 | 25,948,250 | 19,766,120 | 76.2 |
| Midwest | 68,340,091 | 68,340,091 | 100.0 | 32,150,039 | 32,150,039 | 100.0 |
| South | 125,686,544 | 100,831,045 | 80.2 | 58,360,575 | 45,970,596 | 78.8 |
| West | 78,300,384 | 66,217,550 | 84.6 | 26,973,420 | 22,482,095 | 83.3 |
| U.S. | 328,329,953 | 278,592,737 | 84.9 | 143,432,284 | 120,368,850 | 83.9 |
| Abbreviations: AHA, American Hospital Association; ED, emergency department; HCUP, Healthcare Cost and Utilization Project; NEDS, Nationwide Emergency Department Sample. Source: Population counts from the U.S. Census Bureau, Annual Estimates of the Population for the United States, Regions, States, and Puerto Rico: April 1, 2010 to July 1, 2020 (NST-EST2020-01, released December 2020). AHA ED visit counts from the American Hospital Association Annual Survey of Hospitals, 2019. ED visit counts for NEDS States from the HCUP SID and SEDD. | ||||||
Table A3. NEDS-Related Reports and Database Documentation Available on the HCUP-US Website
Description of the NEDS Database
Restrictions on Use
File Specifications and Load Programs
Data Elements
Additional Resources for NEDS Data Elements
|
ICD-10-CM/PCS Data Included in the NEDS Starting With 2015
Known Data Issues
HCUP Tools: Labels and Formats
Obtaining HCUP Data
|
|
| Abbreviations: DRG, diagnosis-related group; HCUP, Healthcare Cost and Utilization Project; HCUP-US, Healthcare Cost and Utilization Project User Support; ICD-9-CM, International Classification of Diseases, Ninth Revision, Clinical Modification; ICD-10-CM, International Classification of Diseases, Tenth Revision, Clinical Modification; NEDS, Nationwide Emergency Department Sample. | ||
Table A4. NEDS Sampling Stratifiers
| Stratifier | Values |
|---|---|
| Region | 1: Northeast 2: Midwest 3: South 4: West |
| Trauma | 0: Not a trauma center
1: Trauma center level I 2: Trauma center level II 3: Trauma center level III Collapsed categories used for strata with small sample sizes 4: Nontrauma or trauma center level III (beginning in the 2011 NEDS) 7: Trauma center level II or III (beginning in the 2018 NEDS) 8: Trauma center level I or II (in all years of the NEDS) 9: Trauma center level I, II or III (only in the 2006-2010 NEDS) |
| Urban-Rural | 1: Large metropolitan
2: Small metropolitan 3: Micropolitan 4: Non-urban residual Collapsed categories used for strata with small sample sizes 6: Any urban-rural location (used in the South in 2014) 7: Small metropolitan and micropolitan (used in the South in 2011-2015) 8: Metropolitan (large and small) 9: Nonmetropolitan (micropolitan and nonurban location) |
| Teaching | 0: Metropolitan nonteaching
1: Metropolitan teaching 2: Nonmetropolitan teaching and nonteaching |
| Control | 0: All (used for combining public, voluntary, and private)
1: Public – government, non-Federal 2: Voluntary – private, nonprofit 3: Proprietary – private, investor-owned/for-profit 4: Private (used for combining private voluntary and proprietary) |
| Abbreviation: NEDS, Nationwide Emergency Department Sample | |
Table A5. Size of NEDS Target Universe, Sampling Frame, and Sample, 2019
| Category | Description | Number of Hospital-Owned EDs, 2019 | Number of ED Events, 2019 |
|---|---|---|---|
| Target Universe | EDs in community, nonrehabilitation U.S. hospitals that reported total ED visits in the AHA Annual Survey Database | 4,549 | 143,432,284 |
| Sampling Frame | EDs in the 40 States and the District of Columbia that provide information on ED visits that result and do not result in admission | 3,531 | 118,649,230 |
| 2019 NEDS | 20 percent sample of target universe drawn from the sampling frame | 989 | 33,147,251 |
| Abbreviations: ED, emergency department; NEDS, Nationwide Emergency Department Sample. Source: Agency for Healthcare Research and Quality, Healthcare Cost and Utilization Project, Nationwide Emergency Department Sample, 2019. | |||
Table A6. NEDS Sampling Rates by Census Region and Stratum, 2019
| NEDS Stratum | Number of Hospital-Based EDs | Sampling Rate | |||||
|---|---|---|---|---|---|---|---|
| NEDS Stratum | AHA Universe | 20 % of Universe | Frame | Frame Shortfall | NEDS | NEDS to Universe | NEDS to Frame |
| Total | 4,549 | 910 | 3,531 | 0 | 989 | 21.7% | 28.0% |
| Northeast | |||||||
| 10101 | 4 | 2 | 2 | 0 | 2 | 50.0% | 100.0% |
| 10102 | 49 | 10 | 34 | 0 | 10 | 20.4% | 29.4% |
| 10103 | 13 | 3 | 4 | 0 | 3 | 23.1% | 75.0% |
| 10111 | 9 | 2 | 8 | 0 | 2 | 22.2% | 25.0% |
| 10112 | 117 | 24 | 83 | 0 | 24 | 20.5% | 28.9% |
| 10113 | 13 | 3 | 9 | 0 | 3 | 23.1% | 33.3% |
| 10204 | 65 | 13 | 36 | 0 | 13 | 20.0% | 36.1% |
| 10214 | 46 | 10 | 24 | 0 | 10 | 21.7% | 41.7% |
| 10320 | 65 | 13 | 32 | 0 | 13 | 20.0% | 40.6% |
| 10421 | 4 | 2 | 4 | 0 | 2 | 50.0% | 50.0% |
| 10422 | 48 | 10 | 34 | 0 | 10 | 20.8% | 29.4% |
| 11111 | 9 | 2 | 9 | 0 | 2 | 22.2% | 22.2% |
| 11112 | 34 | 7 | 23 | 0 | 7 | 20.6% | 30.4% |
| 11710 | 15 | 3 | 6 | 0 | 3 | 20.0% | 50.0% |
| 12110 | 23 | 5 | 16 | 0 | 5 | 21.7% | 31.3% |
| 12214 | 20 | 4 | 12 | 0 | 4 | 20.0% | 33.3% |
| 13110 | 9 | 2 | 8 | 0 | 2 | 22.2% | 25.0% |
| 13212 | 5 | 2 | 3 | 0 | 2 | 40.0% | 66.7% |
| 13804 | 7 | 2 | 5 | 0 | 2 | 28.6% | 40.0% |
| 17322 | 5 | 2 | 3 | 0 | 2 | 40.0% | 66.7% |
| Midwest | |||||||
| 20101 | 16 | 4 | 16 | 0 | 4 | 25.0% | 25.0% |
| 20102 | 68 | 14 | 64 | 0 | 14 | 20.6% | 21.9% |
| 20103 | 21 | 5 | 7 | 0 | 5 | 23.8% | 71.4% |
| 20111 | 4 | 2 | 4 | 0 | 2 | 50.0% | 50.0% |
| 20112 | 79 | 16 | 75 | 0 | 16 | 20.3% | 21.3% |
| 20113 | 11 | 3 | 9 | 0 | 3 | 27.3% | 33.3% |
| 20201 | 20 | 4 | 20 | 0 | 4 | 20.0% | 20.0% |
| 20202 | 88 | 18 | 85 | 0 | 18 | 20.5% | 21.2% |
| 20203 | 26 | 6 | 8 | 0 | 6 | 23.1% | 75.0% |
| 20211 | 2 | 2 | 2 | 0 | 2 | 100.0% | 100.0% |
| 20212 | 31 | 7 | 29 | 0 | 7 | 22.6% | 24.1% |
| 20213 | 7 | 2 | 4 | 0 | 2 | 28.6% | 50.0% |
| 20321 | 45 | 9 | 45 | 0 | 9 | 20.0% | 20.0% |
| 20322 | 148 | 30 | 144 | 0 | 30 | 20.3% | 20.8% |
| 20323 | 14 | 3 | 11 | 0 | 3 | 21.4% | 27.3% |
| 20421 | 181 | 37 | 177 | 0 | 37 | 20.4% | 20.9% |
| 20422 | 244 | 49 | 224 | 0 | 49 | 20.1% | 21.9% |
| 20423 | 8 | 2 | 7 | 0 | 2 | 25.0% | 28.6% |
| 21102 | 2 | 2 | 2 | 0 | 2 | 100.0% | 100.0% |
| 21111 | 6 | 2 | 6 | 0 | 2 | 33.3% | 33.3% |
| 21112 | 36 | 8 | 35 | 0 | 8 | 22.2% | 22.9% |
| 21113 | 3 | 2 | 3 | 0 | 2 | 66.7% | 66.7% |
| 21211 | 4 | 2 | 4 | 0 | 2 | 50.0% | 50.0% |
| 21214 | 28 | 6 | 27 | 0 | 6 | 21.4% | 22.2% |
| 22100 | 13 | 3 | 13 | 0 | 3 | 23.1% | 23.1% |
| 22110 | 35 | 7 | 35 | 0 | 7 | 20.0% | 20.0% |
| 22204 | 11 | 3 | 11 | 0 | 3 | 27.3% | 27.3% |
| 22212 | 47 | 10 | 47 | 0 | 10 | 21.3% | 21.3% |
| 22213 | 2 | 2 | 2 | 0 | 2 | 100.0% | 100.0% |
| 22920 | 13 | 3 | 13 | 0 | 3 | 23.1% | 23.1% |
| 23100 | 15 | 3 | 15 | 0 | 3 | 20.0% | 20.0% |
| 23112 | 26 | 6 | 26 | 0 | 6 | 23.1% | 23.1% |
| 23113 | 2 | 2 | 2 | 0 | 2 | 100.0% | 100.0% |
| 23201 | 2 | 2 | 2 | 0 | 2 | 100.0% | 100.0% |
| 23202 | 20 | 4 | 20 | 0 | 4 | 20.0% | 20.0% |
| 23214 | 29 | 6 | 29 | 0 | 6 | 20.7% | 20.7% |
| 23321 | 4 | 2 | 4 | 0 | 2 | 50.0% | 50.0% |
| 23322 | 39 | 8 | 39 | 0 | 8 | 20.5% | 20.5% |
| 23323 | 3 | 2 | 3 | 0 | 2 | 66.7% | 66.7% |
| 23422 | 13 | 3 | 13 | 0 | 3 | 23.1% | 23.1% |
| South | |||||||
| 30101 | 28 | 6 | 20 | 0 | 6 | 21.4% | 30.0% |
| 30102 | 104 | 21 | 83 | 0 | 21 | 20.2% | 25.3% |
| 30103 | 105 | 21 | 71 | 0 | 21 | 20.0% | 29.6% |
| 30111 | 14 | 3 | 10 | 0 | 3 | 21.4% | 30.0% |
| 30112 | 116 | 24 | 90 | 0 | 24 | 20.7% | 26.7% |
| 30113 | 47 | 10 | 43 | 0 | 10 | 21.3% | 23.3% |
| 30201 | 55 | 11 | 29 | 0 | 11 | 20.0% | 37.9% |
| 30202 | 112 | 23 | 76 | 0 | 23 | 20.5% | 30.7% |
| 30203 | 84 | 17 | 46 | 0 | 17 | 20.2% | 37.0% |
| 30211 | 12 | 3 | 6 | 0 | 3 | 25.0% | 50.0% |
| 30212 | 51 | 11 | 38 | 0 | 11 | 21.6% | 28.9% |
| 30213 | 33 | 7 | 24 | 0 | 7 | 21.2% | 29.2% |
| 30321 | 61 | 13 | 48 | 0 | 13 | 21.3% | 27.1% |
| 30322 | 95 | 19 | 79 | 0 | 19 | 20.0% | 24.1% |
| 30323 | 45 | 9 | 31 | 0 | 9 | 20.0% | 29.0% |
| 30421 | 167 | 34 | 122 | 0 | 34 | 20.4% | 27.9% |
| 30422 | 163 | 33 | 115 | 0 | 33 | 20.2% | 28.7% |
| 30423 | 58 | 12 | 33 | 0 | 12 | 20.7% | 36.4% |
| 31111 | 11 | 3 | 9 | 0 | 3 | 27.3% | 33.3% |
| 31112 | 34 | 7 | 26 | 0 | 7 | 20.6% | 26.9% |
| 31113 | 5 | 2 | 5 | 0 | 2 | 40.0% | 40.0% |
| 31211 | 13 | 3 | 9 | 0 | 3 | 23.1% | 33.3% |
| 31212 | 17 | 4 | 13 | 0 | 4 | 23.5% | 30.8% |
| 31213 | 2 | 2 | 2 | 0 | 2 | 100.0% | 100.0% |
| 32110 | 28 | 6 | 25 | 0 | 6 | 21.4% | 24.0% |
| 32200 | 10 | 2 | 7 | 0 | 2 | 20.0% | 28.6% |
| 32211 | 9 | 2 | 7 | 0 | 2 | 22.2% | 28.6% |
| 32212 | 29 | 6 | 21 | 0 | 6 | 20.7% | 28.6% |
| 32213 | 8 | 2 | 7 | 0 | 2 | 25.0% | 28.6% |
| 32420 | 2 | 2 | 2 | 0 | 2 | 100.0% | 100.0% |
| 33100 | 18 | 4 | 16 | 0 | 4 | 22.2% | 25.0% |
| 33110 | 31 | 7 | 14 | 0 | 7 | 22.6% | 50.0% |
| 33201 | 5 | 2 | 3 | 0 | 2 | 40.0% | 66.7% |
| 33202 | 10 | 2 | 6 | 0 | 2 | 20.0% | 33.3% |
| 33203 | 16 | 4 | 11 | 0 | 4 | 25.0% | 36.4% |
| 33211 | 6 | 2 | 2 | 0 | 2 | 33.3% | 100.0% |
| 33212 | 25 | 5 | 16 | 0 | 5 | 20.0% | 31.3% |
| 33213 | 19 | 4 | 12 | 0 | 4 | 21.1% | 33.3% |
| 33322 | 19 | 4 | 10 | 0 | 4 | 21.1% | 40.0% |
| 33422 | 5 | 2 | 2 | 0 | 2 | 40.0% | 100.0% |
| 33921 | 25 | 5 | 13 | 0 | 5 | 20.0% | 38.5% |
| 33923 | 16 | 4 | 7 | 0 | 4 | 25.0% | 57.1% |
| 38104 | 6 | 2 | 4 | 0 | 2 | 33.3% | 50.0% |
| 38322 | 3 | 2 | 2 | 0 | 2 | 66.7% | 100.0% |
| West | |||||||
| 40101 | 12 | 3 | 9 | 0 | 3 | 25.0% | 33.3% |
| 40102 | 60 | 12 | 53 | 0 | 12 | 20.0% | 22.6% |
| 40103 | 48 | 10 | 39 | 0 | 10 | 20.8% | 25.6% |
| 40111 | 12 | 3 | 11 | 0 | 3 | 25.0% | 27.3% |
| 40112 | 87 | 18 | 75 | 0 | 18 | 20.7% | 24.0% |
| 40113 | 23 | 5 | 21 | 0 | 5 | 21.7% | 23.8% |
| 40201 | 19 | 4 | 12 | 0 | 4 | 21.1% | 33.3% |
| 40202 | 54 | 11 | 48 | 0 | 11 | 20.4% | 22.9% |
| 40203 | 29 | 6 | 18 | 0 | 6 | 20.7% | 33.3% |
| 40211 | 6 | 2 | 4 | 0 | 2 | 33.3% | 50.0% |
| 40212 | 36 | 8 | 28 | 0 | 8 | 22.2% | 28.6% |
| 40213 | 14 | 3 | 3 | 0 | 3 | 21.4% | 100.0% |
| 40321 | 31 | 7 | 15 | 0 | 7 | 22.6% | 46.7% |
| 40322 | 46 | 10 | 31 | 0 | 10 | 21.7% | 32.3% |
| 40323 | 15 | 3 | 6 | 0 | 3 | 20.0% | 50.0% |
| 40421 | 93 | 19 | 58 | 0 | 19 | 20.4% | 32.8% |
| 40424 | 78 | 16 | 60 | 0 | 16 | 20.5% | 26.7% |
| 41111 | 14 | 3 | 13 | 0 | 3 | 21.4% | 23.1% |
| 41114 | 23 | 5 | 23 | 0 | 5 | 21.7% | 21.7% |
| 41210 | 9 | 2 | 6 | 0 | 2 | 22.2% | 33.3% |
| 42104 | 5 | 2 | 5 | 0 | 2 | 40.0% | 40.0% |
| 42111 | 5 | 2 | 5 | 0 | 2 | 40.0% | 40.0% |
| 42112 | 21 | 5 | 16 | 0 | 5 | 23.8% | 31.3% |
| 42113 | 9 | 2 | 9 | 0 | 2 | 22.2% | 22.2% |
| 42211 | 3 | 2 | 3 | 0 | 2 | 66.7% | 66.7% |
| 42214 | 28 | 6 | 22 | 0 | 6 | 21.4% | 27.3% |
| 42700 | 12 | 3 | 10 | 0 | 3 | 25.0% | 30.0% |
| 43100 | 7 | 2 | 7 | 0 | 2 | 28.6% | 28.6% |
| 43110 | 15 | 3 | 10 | 0 | 3 | 20.0% | 30.0% |
| 43200 | 20 | 4 | 15 | 0 | 4 | 20.0% | 26.7% |
| 43211 | 5 | 2 | 2 | 0 | 2 | 40.0% | 100.0% |
| 43212 | 15 | 3 | 6 | 0 | 3 | 20.0% | 50.0% |
| 43213 | 3 | 2 | 2 | 0 | 2 | 66.7% | 100.0% |
| 43321 | 11 | 3 | 7 | 0 | 3 | 27.3% | 42.9% |
| 43322 | 25 | 5 | 22 | 0 | 5 | 20.0% | 22.7% |
| 43323 | 5 | 2 | 3 | 0 | 2 | 40.0% | 66.7% |
| 43920 | 3 | 2 | 2 | 0 | 2 | 66.7% | 100.0% |
| Abbreviations: ED, emergency department; NEDS, Nationwide Emergency Department Sample. | |||||||
NEDS strata are defined by five digits:
Source: Agency for Healthcare Research and Quality, Healthcare Cost and Utilization Project, Nationwide Emergency Department Sample, 2019.
Table A7. Number and Percent of ED Visits by Discharge Status, 2019
| Type of ED Visit Based on Discharge Status from the ED | Number of ED Visits | ED Visits, % |
|---|---|---|
| ED visit in which the patient was treated and released | 120,250,757 | 83.8 |
| ED visit in which the patient was admitted to the same hospital | 20,373,534 | 14.2 |
| ED visit in which the patient was transferred to another short-term hospital | 2,532,807 | 1.8 |
| ED visit in which the patient died in the ED | 200,696 | 0.1 |
| ED visit in which patient was not admitted to the same hospital, destination unknown | 73,063 | 0.1 |
| ED visit in which the patient was discharged alive, destination unknown (but not admitted) | 1,426 | 0.0 |
| Abbreviation: ED, emergency department; NEDS, Nationwide Emergency Department Sample. Source: Agency for Healthcare Research and Quality, Healthcare Cost and Utilization Project, Nationwide Emergency Department Sample, 2019. | ||
Appendix B: Partner-Specific Restrictions
Table B1 enumerates the types of restrictions applied to the 2019 Nationwide Emergency Department Sample. Restrictions include the following types:
Table B1. Partner-Specific Restrictions
| Confidentiality of Hospitals |
|---|
Limitations on sampling to ensure hospital confidentiality:
|
| Confidentiality of Records |
Limitations on selected data elements to ensure patient confidentiality:
|
| Limited Reporting of Diagnosis Codes for Medical Misadventures and Adverse Effects |
|
| Missing Information for Specific Populations of Patients |
|
| Abbreviations: HCUP, Healthcare Cost and Utilization Project; NEDS, Nationwide Emergency Department Sample. |
Appendix C: NEDS Data Elements and Codes
Table C1. Data Elements in the 2019 NEDS Core File
| Core File | ||
|---|---|---|
| Type of Data Element | HCUP Data Element | Coding Notes |
| Admission timing | AWEEKEND | Admission on weekend: (0) admission on Monday through Friday, (1) admission on Saturday or Sunday |
| AMONTH | Admission month coded from (1) January to (12) December | |
| Age at admission | AGE | Age in years coded 0-90 years. Any ages greater than 90 were set to 90. |
| Diagnosis information | I10_DX1 - I10_DX35 | ICD-10-CM diagnoses, with external cause of morbidity codes at the end of the array |
| I10_NDX | Number of diagnoses coded on the original record received from Partner organizations | |
| I10_INJURY | ICD-10-CM initial injury diagnosisa reported: (0) no injury diagnoses reported, (1) injury is reported in first-listed diagnosis, (2) injury is reported in a diagnosis other than the first-listed diagnosis | |
| I10_MULTINJURY | Multiple ICD-10-CM initial injury diagnosesa reported: (0) one or no injury diagnosis reported, (1) more than one injury diagnoses reported, regardless of position | |
| I10_INJURY_CUT | External cause of morbidity codes indicating injury by cutting or piercing: (0) no injury by cutting or piercing, (1) injury by cutting or piercing | |
| I10_INJURY_DROWN | External cause of morbidity codes indicating injury by drowning or submersion: (0) no injury by drowning or submersion, (1) injury by drowning or submersion | |
| I10_INJURY_FALL | External cause of morbidity codes indicating injury by falling: (0) no injury by falling, (1) injury by falling | |
| I10_INJURY_FIRE | External cause of morbidity codes indicating injury by fire, flame, or hot object: (0) no injury by fire, flame, or hot object, (1) injury by fire, flame, or hot object | |
| I10_INJURY_FIREARM | External cause of morbidity codes indicating injury by firearm: (0) no injury by firearm, (1) injury by firearm | |
| I10_INJURY_MACHINERY | External cause of morbidity codes indicating injury by machinery: (0) no injury by machinery, (1) injury by machinery | |
| I10_INJURY_MVT | External cause of morbidity codes indicating injury involving motor vehicle traffic, including the occupant of a car, motorcyclist, pedal cyclist, pedestrian, or unspecified person: (0) no injury involving motor vehicle traffic, (1) injury involving motor vehicle traffic | |
| I10_INJURY_NATURE | External cause of morbidity codes indicating injury involving natural or environmental causes, including bites and stings: (0) no injury involving natural or environmental causes, (1) injury involving natural or environmental causes | |
| I10_INJURY_OVEREXERTION | External cause of morbidity codes indicating injury by overexertion: (0) no injury by overexertion, (1) injury by overexertion | |
| I10_INJURY_POISON | External cause of morbidity codes indicating injury by poisoning: (0) no injury by poisoning, (1) injury by poisoning | |
| I10_INJURY_STRUCK | External cause of morbidity codes indicating injury involving being struck by or against something: (0) no injury involving being struck by or against, (1) injury involving being struck by or against | |
| I10_INJURY_SUFFOCATION | External cause of morbidity codes indicating injury by suffocation: (0) no injury by suffocation, (1) injury by suffocation | |
| I10_INTENT_ASSAULT | External cause of morbidity codes indicating injury by assault: (0) no injury by assault, (1) injury by assault | |
| I10_INTENT_SELF_HARM | External cause of morbidity codes indicating intended self harm: (0) not intended self harm, (1) intended self harm | |
| I10_INTENT_UNINTENTIONAL | External cause of morbidity codes indicating injury was unintentional: (0) no unintentional injury, (1) unintentional injury | |
| Discharge timing | DQTR | Discharge quarter coded: (1) January - March, (2) April - June, (3) July - September, (4) October - December |
| YEAR | Calendar year of ED visits | |
| Disposition of patient from the ED | DISP_ED | Disposition from ED: (1) routine; (2) transfer to short-term hospital; (5) other transfers, including skilled nursing facility, intermediate care, and another type of facility; (6) home health care; (7) against medical advice; (9) admitted as an inpatient to this hospital; (20) died in ED; (21) discharged/transferred to court/law enforcement; (98) not admitted, destination unknown; (99) discharged alive, destination unknown (but not admitted) |
| DIED_VISIT | Died in ED: (0) did not die (1) died in the ED, (2) died in the hospital | |
| ED event | EDevent | Type of ED visit: (1) ED visit in which the patient is treated and released, (2) ED visit in which the patient is admitted to the same hospital, (3) ED visit in which the patient is transferred to another short-term hospital, (9) ED visit in which the patient died in the ED, (98) ED visits in which patient was not admitted, destination unknown, (99) ED visit in which patient was discharged alive, destination unknown (but not admitted) |
| Sex of patient | FEMALE | Indicates sex: (0) male, (1) female |
| Race/ethnicity of patient | RACE | Race, uniform coding: (1) White, (2) Black, (3) Hispanic, (4) Asian or Pacific Islander, (5) Native American, (6) Other. (For 2019, RACE contains missing values on under 3 percent of the records.) |
| Urban-rural location of the patient’s residence | PL_NCHS | Urban—rural designation for patient's county of residence: (1) large central metropolitan, (2) large fringe metropolitan, (3) medium metropolitan, (4) small metropolitan, (5) micropolitan, (6) not metropolitan or micropolitan |
| National quartile for median household income of patient's ZIP Code | ZIPINC_QRTL | Median household income quartiles for patient's ZIP Code. For 2019, the median income quartiles are defined as: (1) $1-$45,999; (2) $46,000- $58,999; (3) $59,000-$78,999; and (4) $79,000 or more |
| Payer information | PAY1 | Expected primary payer, uniform: (1) Medicare, (2) Medicaid, (3) private including HMO, (4) self-pay, (5) no charge, (6) other |
| PAY2 | Expected secondary payer, uniform: (1) Medicare, (2) Medicaid, (3) private including HMO, (4) self-pay, (5) no charge, (6) other | |
| Total ED charges | TOTCHG_ED | Total charges for ED services, edited |
| HCUP source file | HCUPFILE | Source of HCUP record: (SEDD) from SEDD file, (SID) from SID file |
| Discharge weight | DISCWT | Discharge weight used to calculate national estimates. Weights ED visits to AHA universe. |
| NEDS hospital identifier, synthetic | HOSP_ED | Unique HCUP NEDS hospital number — links to NEDS Hospital weights file, but not to other HCUP databases |
| NEDS stratum | NEDS_STRATUM | Stratum used to sample hospitals, based on geographic region, trauma, location/teaching status, and control. Stratum information is also contained in the Hospital Weights File. |
| Record identifier, synthetic | KEY_ED | Unique HCUP NEDS record number - links to NEDS Supplemental Files, but not to other HCUP databases |
| Abbreviations: ED, emergency department; HCUP, Healthcare Cost and Utilization Project; HMO, health maintenance organization; ICD-10-CM, International Classification of Diseases, Tenth Revision, Clinical Modification; NEDS, Nationwide Emergency Department Sample; SEDD, State Emergency Department Databases; SID, State Inpatient Databases. Notes: For data years prior to 2019, refer to the NEDS Description of Data Elements page on the HCUP-US website or to previous versions of the Introduction to the NEDS. a Injuries are identified by diagnosis codes in the Clinical Classifications Software Refined for ICD-10-CM categories of INJ001-INJ027 and INJ032. Injuries are limited to the initial encounter with a 7th character of A, B, C, or missing. | ||
Table C2. Data Elements in the 2019 NEDS Supplemental ED File
| Type of Data Element | HCUP Data Element | Coding Notes |
|---|---|---|
| CPT procedure information | CPT1 — CPT35 | CPT procedures performed in the ED |
| CPTCCS1 — CPTCCS35 | Clinical Classifications Software category for all CPT procedures | |
| NCPT | Number of procedures coded on the original record. A maximum of 35 CPT codes are retained on the NEDS. | |
| NEDS hospital identifier, synthetic | HOSP_ED | Unique HCUP NEDS hospital number — links to NEDS Hospital Weights File, but not to other HCUP databases |
| Record identifier, synthetic | KEY_ED | Unique HCUP NEDS record number — links to NEDS Supplemental Files, but not to other HCUP databases |
| Abbreviations: CPT, Current Procedural Terminology; ED, emergency department; HCUP, Healthcare Cost and Utilization Project; NEDS, Nationwide Emergency Department Sample. Notes: For data years prior to 2019, refer to the NEDS Description of Data Elements page on the HCUP-US website or to previous versions of the Introduction to the NEDS. | ||
Table C3.Data Elements in the 2019 NEDS Supplemental Inpatient File
| Type of Data Element | HCUP Data Element | Coding Notes |
|---|---|---|
| Disposition of patient from the hospital | DISP_IP | Disposition from hospital admission: (1) routine, (2) transfer to short-term hospital, (5) other transfers, including skilled nursing facility, intermediate care, and another type of facility, (6) home health care, (7) against medical advice, (20) died in hospital, (99) discharged alive, destination unknown |
| Diagnosis related group (DRG) | DRG | DRG in use on discharge date |
| DRG_NoPOA | DRG assignment made without the use of the present on admission flags for the diagnoses | |
| DRGVER | Grouper version in use on discharge date | |
| MDC | Major diagnosis category (MDC) in use on discharge date | |
| MDC_NoPOA | MDC in use on discharge date, calculated without the use of the present on admission flags for the diagnoses | |
| Length of hospital inpatient stay | LOS_IP | Length of stay, edited |
| Total charges for inpatient stay | TOTCHG_IP | Total charges for ED and inpatient services, edited |
| ICD-10-PCS procedure information | I10_PR_IP1 - I10_PRI_IP15 | ICD-10-PCS procedures coded on ED admissions. Procedure may have been performed in the ED or during the hospital stay. |
| I10_NPR_IP | Number of procedures coded on the original record. | |
| Data elements derived from the HCUP Software Tools for ICD-10-PCS | PCLASSn1 | Procedure Classes Refined for ICD-10-PCS procedure codes |
| PCLASS_VERSION | Version of the Procedure Classes Refined for ICD-10-PCS procedure codes | |
| PRCCSR_aaannn2 | Indication that at least one ICD-10-CM diagnosis on the record is included in the Clinical Classification Software Refined (CCSR) aaannn | |
| PRCCSR_VERSION | Version of CCSR for ICD-10-PCS procedure codes | |
| NEDS hospital identifier, synthetic | HOSP_ED | Unique HCUP NEDS hospital number - links to NEDS Hospital Weights File, but not to other HCUP databases |
| Record identifier, synthetic | KEY_ED | Unique HCUP NEDS record number - links to NEDS Supplemental Files, but not to other HCUP databases |
| Abbreviations: ED, emergency department; HCUP, Healthcare Cost and Utilization Project; ICD-10-PCS, International Classification of Diseases, Tenth Revision, Procedure Coding System; NEDS, Nationwide Emergency Department Sample Notes: For data years prior to 2019, refer to the NEDS Description of Data Elements page on the HCUP-US website or to previous versions of the Introduction to the NEDS. 1 PCLASS_IPn was available on the NEDS through quarter 3 of data year 2015 and was specific to the coding of ICD-9-CM procedures. 2 Where aaa denotes the clinical domain and nnn denotes the CCSR number within the clinical domain. | ||
Table C4. Data Elements in the 2019 NEDS Hospital Weights File
| Type of Data Element | HCUP Data Element | Coding Notes |
|---|---|---|
| Discharge counts | N_DISC_U | Number of AHA universe ED visits in the stratum |
| S_DISC_U | Number of sampled ED visits in the sampling stratum | |
| TOTAL_EDvisits | Total number of ED visits for this hospital in the NEDS | |
| Weights | DISCWT | Discharge weight used to calculate national estimates. Weights ED visits to AHA universe. |
| HOSPWT | Weight to hospital-owned EDs in AHA universe (i.e., total U.S.) | |
| Discharge year | YEAR | Discharge year |
| Hospital counts | N_HOSP_U | Number of AHA universe hospital-owned EDs in the stratum |
| S_HOSP_U | Number of sampled hospital-owned EDs in the stratum | |
| NEDS hospital identifier, synthetic | HOSP_ED | Unique HCUP NEDS hospital number — links to NEDS Hospital Weights file, but not to other HCUP databases |
| Hospital characteristics | HOSP_URCAT4 | Hospital urban-rural location: (1) large metropolitan areas with at least 1 million residents; (2) small metropolitan areas with less than 1 million residents; (3) micropolitan areas; (4) not metropolitan or micropolitan; (6) collapsed category of any urban-rural location; (7) collapsed category of small metropolitan and micropolitan; (8) metropolitan, collapsed category of large and small metropolitan; (9) nonmetropolitan, collapsed category of micropolitan and rural |
| HOSP_CONTROL | Control/ownership of hospital: (0) government or private, collapsed category, (1) government, non-federal, public, (2) private, nonprofit, voluntary, (3) private, invest-own, (4) private, collapsed category | |
| HOSP_REGION | Region of hospital: (1) Northeast, (2) Midwest, (3) South, (4) West | |
| HOSP_TRAUMA | Trauma center level: (0) nontrauma center, (1) trauma level I, (2) trauma level II (3) trauma level III, (4) nontrauma or trauma level III, collapsed category beginning in the 2011 NEDS, (8) trauma level I or II, collapsed category, (9) trauma level I, II, or III, collapsed category in the 2006-2010 NEDS. Children's hospitals with trauma centers are classified with adult/pediatric trauma centers. | |
| HOSP_UR_TEACH | Teaching status of hospital: (0) metropolitan nonteaching, (1) metropolitan teaching, (2) nonmetropolitan | |
| NEDS_STRATUM | Stratum used to sample EDs, includes geographic region, trauma, location/teaching status, and control | |
| Abbreviations: AHA, American Hospital Association; ED, emergency department; HCUP, Healthcare Cost and Utilization Project; NEDS, Nationwide Emergency Department Sample Notes: For data years prior to 2019, refer to the NEDS Description of Data Elements page on the HCUP-US website or to previous versions of the Introduction to the NEDS. | ||
Table C5. Data Elements in the 2019 NEDS Diagnosis and Procedure Groups File
| Type of Data Element | HCUP Data Element | Coding Notes |
|---|---|---|
| Clinical Classifications Software Refined (CCSR) for ICD-10-CM diagnoses | DXCCSR_aaannn3 | Indication that at least one ICD-10-CM diagnosis on the record is included in CCSR AAAnnn |
| DXCCSR_Default_DX1 | Default CCSR for principal/first-listed ICD-10-CM diagnosis | |
| DXCCSR_VERSION | Version of CCSR for ICD-10-CM diagnoses | |
| Elixhauser Comorbidity Software Refined for ICD-10-CM | CMR_aaa4 | Comorbidity measures (aaa) identified by the AHRQ Elixhauser Comorbidity Software Refined for ICD-10-CM diagnosis codes |
| CMR_VERSION | Version of the Elixhauser Comorbidity Measure Refined for ICD-10-CM | |
| NEDS identifiers, synthetic | HOSP_ED | Unique HCUP NEDS hospital number—links to NEDS Hospital Weights File but not to other HCUP databases |
| KEY_ED | Unique HCUP NEDS record number—links to NEDS Core and Supplemental Files but not to other HCUP databases | |
| Abbreviations: AHA, American Hospital Association; ED, emergency department; HCUP, Healthcare Cost and Utilization Project; NEDS, Nationwide Emergency Department Sample Notes: For data years prior to 2019, refer to the NEDS Description of Data Elements page on the HCUP-US website or to previous versions of the Introduction to the NEDS. 3 Where aaa denotes the body system and nnn denotes the CCSR number within the body system. 4 Where aaa denotes the specific comorbidity measure. | ||
Appendix D: Comparisons of the NEDS With Other Sources of ED Data
Figure D1. Number of Emergency Department (ED) Visits in the U.S., by Data Source, 2019
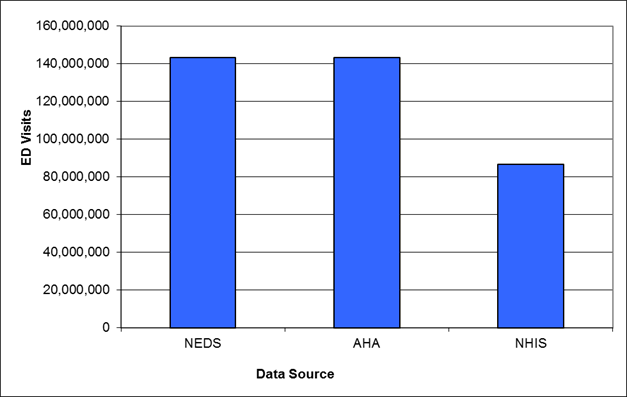
Abbreviations: NEDS, Nationwide Emergency Department Sample; AHA, American Hospital Association Annual Survey Database; NHIS, National Health Interview Survey
The above graphic outlines the number of emergency department visits in the United States in 2019. For 2019 it is estimated to be 143,432,284 according to the HCUP Nationwide Emergency Department Sample (NEDS); 143,432,284 according to the American Hospital Association Annual Survey Database (AHA); and 86,783,875 according to the National Health Interview Survey (NHIS)
Table D1. Number and Percent of Emergency Department (ED) Visits in the U.S., by Census Region and Data Source, 2019
| Region | NEDSa | AHA | NHISb | |||
|---|---|---|---|---|---|---|
| No. of Visits (weighted) | % | No. of Visits | % | No. of Visits | % | |
| Northeast | 25,948,250 | 18.0 | 25,948,250 | 18.0 | 15,673,721 | 18.0 |
| Midwest | 32,150,039 | 22.0 | 32,150,039 | 22.0 | 18,339,584 | 21.0 |
| South | 58,360,575 | 41.0 | 58,360,575 | 41.0 | 34,230,392 | 39.0 |
| West | 26,973,420 | 19.0 | 26,973,420 | 19.0 | 18,540,178 | 21.0 |
| Total U.S. | 143,432,284 | 100.0 | 143,432,284 | 100.0 | 86,783,875 | 100.0 |
| Abbreviations: NEDS, Nationwide Emergency Department Sample; AHA, American Hospital Association Annual Survey Database; NHIS, National Health Interview Survey. a NEDS weighted counts by geographic region exactly match the AHA counts because the AHA data were used as control totals for the NEDS discharge weights. b NHIS estimates were calculated using the values provided in the survey (0, 1, 3, 4+). For the upper range of visits in the survey (4 or more ED visits), 4 ED visits were used for the estimate. |
||||||
Table D2. Distribution of Hospital-Owned Emergency Departments (ED) by Number of Visits, NEDS and AHA, 2019
| Volume of ED Visits | NEDS | AHA | ||
|---|---|---|---|---|
| Number of EDs | % | Number of EDs | % | |
| <10,000 visits | 1,467 | 32.2 | 1,592 | 35.0 |
| 10,000-19,999 visits | 762 | 16.7 | 716 | 15.7 |
| 20,000-29,999 | 487 | 10.7 | 527 | 11.6 |
| 30,000-39,999 | 496 | 10.9 | 418 | 9.2 |
| 40,000-49,999 | 325 | 7.2 | 309 | 6.8 |
| 50,000 or more visits | 1,012 | 22.3 | 987 | 21.7 |
| All hospital-owned EDs | 4,549 | 100.0 | 4,549 | 100.0 |
| Abbreviations: NEDS, Nationwide Emergency Department Sample; AHA, American Hospital Association Annual Survey Database. | ||||
Table D3. Number of Injuries by Type of Injury-Related ED Visit, NEDS and NEISS-AIP, 2019
| Type of Injury-Related- ED Visit | NEDS (All Injuries)a | NEDS (Initial Encounter for Injurya | NEISS-AIPab | |||
|---|---|---|---|---|---|---|
| No. of Visits (weighted) | 95% CI | No. of Visits (weighted) | 95% CI | No. of Visits (weighted) | 95% CI | |
| Total no. of visits for nonfatal injuries | 28,104,026 | (26,957,519, 29,250,532) | 27,337,425 | (26,219,507, 28,455,343) | 26,910,333 | (22,929,039, 30,891,626) |
| Treated and released from ED | 24,681,820 | (23,645,690, 25,717,949) | 24,071,652 | (23,058,266, 25,085,038) | 22,473,409 | (19,240,545, 25,706,272) |
| Admitted to the same hospital | 2,680,743 | (2,537,804, 2,823,681) | 2,537,980 | (2,401,801, 2,674,159) | 2,835,496 | (2,119,475, 3,551,517) |
| Transferred | 506,891 | (481,729, 532,054) | 500,000 | (475,131, 524,870) | 624,875 | (478,212, 771,539) |
| Otherc | 234,572 | (215,664, 253,481) | 227,792 | (209,575, 246,009) | NAd | NAd |
| Abbreviations: NEDS, Nationwide Emergency Department Sample; NEISS-AIP, National Electronic Injury Surveillance System All-Injury Program, CI, confidence interval. a Injuries are identified by diagnosis codes in the Clinical Classifications Software Refined for ICD-10-CM categories of INJ001-INJ027 and INJ032. Initial encounters are limited to diagnoses with a 7th character of A, B, C, or missing. Counts for all injuries allowed any 7th character for the injury diagnosis code; counts for the initial encounter limited injury diagnosis codes to those with a 7th character of A, B, C, or missing. b Data from the Web-based Injury Statistics Query and Reporting System (WISQARS™) (https://webappa.cdc.gov/sasweb/ncipc/nfirates.html). Includes nonfatal, all-cause injuries for all ages and sexes. Patients who died on arrival to the ED or during treatment in the ED are excluded. Queried September 9, 2021. c For the NEISS-AIP, other includes left against medical advice, sent for observations, and unknown destination. For the NEDS, other include left against medical advice. Patients who are treated in the ED and then observed cannot be identified. If they were discharged home from observation, they are counted under "treated and released from the ED"; if they were admitted to the hospital from observation, they are counted under "admitted to the same hospital". d The estimate for other in 2019 was not shown in the WISQARS Query System because it was unstable due to small sample size and/or a coefficient of variation >30 percent. | ||||||
1 Merrill CT, Owens PL. Hospital Admissions That Began in the Emergency Department for Children and Adolescents, 2004. HCUP Statistical Brief #32. Rockville, MD: Agency for Healthcare Research and Quality; June 2007. www.hcup-us.ahrq.gov/reports/statbriefs/sb32.pdf.
2 Merrill CT, Owens PL. Hospital Admissions That Began in the Emergency Department for Children and Adolescents, 2004. HCUP Statistical Brief #32. Rockville, MD: Agency for Healthcare Research and Quality; June 2007. www.hcup-us.ahrq.gov/reports/statbriefs/sb32.pdf.
3 Users interested in applying HCUP software tools to the NEDS to produce data elements not available for a certain data year may do so by downloading the respective tool(s) from the HCUP Research Tools section of the HCUP-US website. Further, users may wish to review the HCUP Software Tools Tutorial, which provides instructions on how to apply the HCUP software tools to HCUP or other administrative databases.
4 More of the AHA "community hospital designation" is available at www.ahadataviewer.com/glossary. ![]()
5 MacKenzie EJ, Hoyt DB, Sacra JC, et al. National inventory of hospital trauma centers. JAMA. 2003;289:1515-1522.
6 American College of Surgeons Committee on Trauma, Verification, Review, and Consultation Program for Hospitals. Verification, Review, and Consultation (VRC) Program. www.facs.org/quality-programs/trauma/tqp/center-programs/vrc. ![]() Accessed September 2018.
Accessed September 2018.
7 American Trauma Society. Trauma Information Exchange Program. www.amtrauma.org/page/TIEP. ![]() Accessed December 2019.
Accessed December 2019.
8 U.S. Department of Agriculture Economic Research Service. Urban Influence Codes. Last updated October 23, 2019. www.ers.usda.gov/data-products/urban-influence-codes.aspx. Accessed June 26, 2020.
9 The collapsing of small metropolitan and micropolitan areas was required in the South in 2011-2015.
10 The collapsing of all areas was required in the South in 2014.
11The ZIP Code of the hospital is not included in the NEDS data files.
12 Carlson BL, Johnson AE, Cohen SB. An evaluation of the use of personal computers for variance estimation with complex survey data. J Off Statistics. 1993;9(4):795-814.
13 At the time this document was created, the 2019 National Hospital Ambulatory Medical Care Survey public use file and the National Emergency Department Inventory were not available for developing comparative estimates.