
Contact Information:
Healthcare Cost and Utilization Project (HCUP)
Agency for Healthcare Research and Quality
http://www.hcup-us.ahrq.gov
For Technical Assistance with HCUP Products:
Email: hcup@ahrq.gov
or
Phone: 1-866-290-HCUP
Recommended Citation: Whalen D, Houchens R, Elixhauser A, 2002 HCUP Nationwide Inpatient Sample (NIS) Comparison Report. HCUP Method Series Report # 2005-03. ONLINE June 24, 2005. U.S. Agency for Healthcare Research and Quality. Available: http://www.hcup-us.ahrq.gov |
This report compares estimates calculated from the 2002 Nationwide Inpatient Sample (NIS) with statistics from two comparable databases � the National Hospital Discharge Survey (NHDS) and the Medicare Provider Analysis and Review (MedPAR) � with the objective of assessing potential biases. In addition, NIS estimates were contrasted with summary information from the American Hospital Association (AHA). This report focuses on important measures of inpatient hospital stays, including: total discharges, lengths of stay, in-hospital mortality rates, and average hospital charges. In addition to comparisons with national statistics, these data were also evaluated across several categories, including region, expected payer, hospital characteristics, patient demographics, diagnosis groupings, and procedure groupings.
The 2002 NIS was established as part of the Healthcare Cost and Utilization Project (HCUP) to provide data supporting analyses of hospital utilization across the United States. NIS data were selected using a stratified probability sample of hospitals, drawn from a frame of 35 states. Sampling probabilities were calculated to select 20 percent of the universe in each stratum defined by hospital characteristics (region, urban/rural location, number of beds, teaching status, and ownership/control). As a result, the NIS includes approximately 7.8 million discharges from 984 hospitals, with weights to facilitate national estimates. One of the most distinctive features of the NIS is that its large sample allows for the study of relatively uncommon disorders, procedures, and hospital types; in fact, NIS estimates can be calculated for any number of special sub-populations. In addition, the NIS contains information on hospital charges and includes all payers.
It is important to note that NIS data differed in scope from the two comparison databases in several ways:
In 2002, the National Center for Health Statistics drew a sample of more than 330,000 short-stay discharges from 445 hospitals, including both general and children�s hospitals for the NHDS data set. Statistics from the NHDS are considered geographically representative because the NHDS sampling frame was relatively unrestricted.
Obtained from the Centers for Medicare and Medicaid Services (CMS), MedPAR data include all paid fee-for-service Medicare discharges from Medicare-certified, short-stay U.S. hospitals. For calendar year 2002, 11.6 million discharges from U.S. community hospitals were included. Of special importance is the fact that MedPAR data underreported total Medicare discharges by omitting most managed care discharges (approximately 14 percent of Medicare patients). This particular omission has significant implications for the various comparisons between the MedPAR and NIS data files.
Statistics compared in the NIS, NHDS, and MedPAR databases included:
These measures of utilization and outcomes were selected because they are common in health services research and serve important roles in health policy and resource planning analyses.
Both the NIS and NHDS are samples, and statistics derived from them are estimates. Therefore, comparisons between NIS and NHDS estimates utilized two-sample t-tests. MedPAR data, in contrast, are not a sample. The NIS-MedPAR comparisons employed one-sample t-tests, which are useful in comparing an entire population (MedPAR) with sample estimates (NIS).
The report cautions that estimates cannot be expected to be identical when two different samples are drawn. When viewing results, readers should note that statistically significant differences between the NIS and the NHDS can be expected for a number of reasons. These include:
Considering all of these possible reasons for significant differences among the samples, data analyses revealed remarkable similarity among the estimates.
NIS estimates of essential healthcare policy variables (i.e., in-hospital mortality, inpatient population size, length of stay, and charges) were accurate and precise. The estimates were drawn from states that encompass nearly 80 percent of all short-stay hospitals, more than 84 percent of discharges in the United States, and 88 percent of the U.S. population.
NIS hospitals resembled typical hospitals in the AHA universe in bed size and most characteristics, although NIS hospitals admit and discharge more patients than hospitals in the AHA universe. Along with the higher level of activity, staffing rates and expenditures at NIS facilities were generally higher than in AHA hospitals. In addition, Medicaid patients were less prevalent in NIS hospitals than in all AHA facilities.
The following sections provide summary highlights of key findings from this comparative analysis:
Summary of overall and regional comparisons:
Comparisons by hospital characteristics:
Comparisons by patient characteristics:
Comparisons by diagnosis and procedure categories:
Each data source possesses distinct strengths and weaknesses and may be regarded as the optimum choice for answering different research questions. In general, NIS estimates of essential healthcare policy variables are accurate and precise. The NIS offers a large sample that might allow for the study of disorders, procedures, and hospital types that occur with low frequency in other databases. NIS estimates can be calculated for thousands of special sub-populations that may be of interest to researchers.
The NHDS sample and MedPAR data were drawn from all 50 states, while only 35 states were included in the NIS database. However, for 2002, NIS states encompassed nearly 80 percent of all short-stay hospitals and more than 84 percent of all United States discharges. The NIS contains charges for each hospital stay, all payers, and a large sample of discharges. In contrast, the NHDS has a smaller number of discharges, does not contain charges, but does sample from all 50 states. The MedPAR database is limited to Medicare discharges and contains all Medicare patients covered by the fee-for-service program, but excludes Medicare patients enrolled in managed care plans. Thus, the appropriateness of each of these databases is dependent on researcher needs and institutional priorities. In conclusion, the NIS appears to provide reliable national estimates when compared with these other national data sources along the dimensions examined in this report.
This report compares statistics estimated from the Nationwide Inpatient Sample (NIS), a database containing patient-level information from a sample of hospital discharges in the year 2002, with estimates from two other data sources. These comparisons will interest researchers who intend to make inferences about hospital outcomes using the 2002 NIS.
This report is the eighth in a series; the seven previous reports compared the NIS with other data sources for the years 1991, 1993, 1995, 1997, 1999, 2000, and 2001, respectively. These data years correspond to NIS releases that expanded the number of states contributing data � the first release sampled discharges from only eight states, while this latest release sampled discharges from the 35 states shown in Figure 1:
Figure 1. States Participating in the NIS, 2002 (text version)

NIS coverage of United States discharges is impressive, because these states include nearly 80 percent of United States community hospitals, more than 84 percent of all discharges, and nearly 88 percent of the U.S. population during 2002. By region, the sampling frame for the NIS includes states with 98 percent of the population in the Northeast, 90 percent of the population in the Midwest, 81 percent of the South, and 84 percent of the West. Still, the possibility remains that hospital outcomes from states in the NIS sampling frame may differ from hospital outcomes in the states not covered by the NIS. This report is designed to explore the representativeness of the NIS in relation to the universe of hospital care in the United States.
Created as a part of the Healthcare Cost and Utilization Project (HCUP) and funded by the Agency for Healthcare Research and Quality (AHRQ), the NIS contains all discharges from a sample of community short-stay hospitals stratified by geographic region, urban vs. rural characteristics, teaching status, bed size, and type of ownership. The hospital sample was drawn from the participating states indicated in Figure 1. The final sample contained 7.8 million discharges from 984 hospitals. We compared outcomes from this sample with outcomes from two other hospital discharge databases: 1) the 2002 National Hospital Discharge Survey (NHDS), and 2) 2002 Medicare Provider Analysis and Review (MedPAR) data.
The 2002 NHDS was created under the auspices of the National Center for Health Statistics (NCHS). Compared with the 2002 NIS, the 2002 NHDS featured a much smaller sample containing only 327,254 discharges from 445 hospitals. However, the sample was drawn from a frame that included nearly all hospitals in each of the 50 states. The NHDS sampled non-Federal short-stay hospitals in the United States, and then sampled discharges from each of the sampled hospitals. Although the smaller sample size rendered NHDS estimates less precise than NIS estimates, the complete coverage of states and the NHDS sampling design should minimize the potential bias for national estimates of hospital outcomes. This characteristic is the reason the NHDS was used as a comparative database in this study.
The 2002 MedPAR, obtained from the Centers for Medicare & Medicaid Services (CMS), included about 11.3 million fee-for-service Medicare discharges from more than 3,900 Medicare-certified, short-stay hospitals. This was not a sample of Medicare discharges. The MedPAR was nearly ideal for comparing NIS estimates of Medicare inpatient outcomes because it represented close to the entire population of Medicare discharges. As a comparative database, its main weakness was that it excluded Medicare managed care enrollees; these individuals accounted for 13.6 percent of the Medicare enrollees in 2002.
We compared the estimates from the 2002 NIS with estimates from the 2002 NHDS and the 2002 MedPAR on the following inpatient outcomes:
While many other statistics can be estimated from these data, hospital research commonly focuses on these four outcomes. To the extent that the NIS generates reasonable estimates for these measures, it is likely that estimates for other, similar outcomes will also be reasonable.
Statistics from the three data sources were compared at the national level, as well as within hospital groups and patient categories. We grouped hospitals and made evaluations by geographic region, bed size, ownership, urban vs. rural location, and teaching status. We also categorized patients and made comparisons within age group, sex, race, primary payer, diagnosis category, and procedure category.
In addition, we compared weighted and unweighted frequencies between the 2002 NIS sample and the 2002 Hospital Survey of the American Hospital Association (AHA). These comparisons are purely descriptive because the NIS sample weights were derived from the AHA survey. Because NIS weights are based on the AHA survey, there was close agreement between the two sources.
This report is divided into four sections. The first section describes the NIS and changes in the sampling strategy that occurred in 1998. The second section provides a discussion of the NHDS, the MedPAR file, and the methodology used in the analysis. The third section presents the results, and the final section includes a discussion and posits several conclusions.
HCUP is a Federal-State-Industry partnership formed to build a standardized, multi-state health data system. In September 2000, AHRQ provided funding to the HCUP project for Medstat to continue developing and expanding this health data system through data year 2003. The 2002 NIS was established as part of HCUP to provide analyses of hospital utilization across the United States.
The 2002 NIS universe included all acute-care discharges from all community hospitals in the United States. It comprised all discharges from a sample of hospitals in this target universe. However, the NIS sampling frame was constructed from the subset of universe hospitals that released discharge data for research use. For the 2002 NIS, AHRQ had agreements with 36 Partner organizations that maintain statewide, all-payer discharge data files. The 2002 NIS contains data from each of these states except Arizona; this participation reflects an increase of two more states than the previous release and 27 more states than the first release.
Table 1 illustrates how the NIS sampling frame has grown. It lists the states included in each NIS release, for data years 1988 through 2002.
| Years | States in the Frame |
|---|---|
| 1988 | California, Colorado, Florida, Iowa, Illinois, Massachusetts, New Jersey, and Washington |
| 1989-1992 | Added Arizona, Pennsylvania, and Wisconsin |
| 1993 | Added Connecticut, Kansas, Maryland, New York, Oregon, and South Carolina |
| 1994 | No new additions |
| 1995 | Added Missouri and Tennessee |
| 1996 | No new additions |
| 1997 | Added Georgia, Hawaii, and Utah |
| 1998 | No new additions |
| 1999 | Added Maine and Virginia |
| 2000 | Added Kentucky, North Carolina, Texas, and West Virginia |
| 2001 | Added Michigan, Minnesota, Nebraska, Rhode Island, and Vermont |
| 2002 | Added Nevada, Ohio, and South Dakota; Information from Arizona was not available for inclusion in the NIS |
As with previous releases of the NIS, the 2002 NIS sampling frame was subject to further restrictions.
1Sylvia Cook, Texas Health Care Information Council (telephone conversation occurring on March 15, 2005).
The NIS is a stratified probability sample of hospitals in the frame, with sampling probabilities calculated to select 20 percent of the universe contained in each stratum. Beginning in 1998, NIS databases differed from previous years of the NIS because of a sampling redesign. Therefore, longitudinal comparisons of the NIS might indicate differences that can be attributed to the following six changes in the sampling design. For more information on trend analysis, refer to the report Using the HCUP Nationwide Inpatient Sample to Estimate Trends Report2 on the HCUP Website.
2http://www.hcup-us.ahrq.gov/reports/methods/TrendReport2005_1.pdf
The overall sampling objective was to select a sample of hospitals that could be generalized to the target universe, including hospitals outside the frame (which had a zero probability of selection). To improve the generalizability of the NIS estimates, five hospital sampling strata were used:
To further improve proportional geographic representation, hospitals were sorted by state and by the first three digits of their ZIP Code prior to systematic sampling. Refer to Design Report: HCUP Nationwide Inpatient Sample, 20023 for more details on the sampling design.
3http://www.hcup-us.ahrq.gov/db/nation/nis/reports/NIS_2002_Design_Report.pdf
| Location and Teaching Status | Hospital Bed Size | ||
|---|---|---|---|
| Small | Medium | Large | |
| Northeast | |||
| Rural | 1-49 | 50-99 | 100+ |
| Urban, non-teaching | 1-124 | 125-199 | 200+ |
| Urban, teaching | 1-249 | 250-424 | 425+ |
| Midwest | |||
| Rural | 1-29 | 30-49 | 50+ |
| Urban, non-teaching | 1-74 | 75-174 | 175+ |
| Urban, teaching | 1-249 | 250-374 | 375+ |
| South | |||
| Rural | 1-39 | 40-74 | 75+ |
| Urban, non-teaching | 1-99 | 100-199 | 200+ |
| Urban, teaching | 1-249 | 250-449 | 450+ |
| West | |||
| Rural | 1-24 | 25-44 | 45+ |
| Urban, non-teaching | 1-99 | 100-174 | 175+ |
| Urban, teaching | 1-199 | 200-324 | 325+ |
Sample weights were developed for the NIS to obtain national estimates of the hospital and inpatient parameters. For example, weights enable estimates of diagnosis-specific average lengths of stay over all United States hospitals. Within each stratum, the discharge weight was set at the ratio of discharges in the universe (estimated from the 2002 AHA hospital survey) to discharges in the sample.
Statistics from the NIS were compared with statistics from three other sources, each of which is described below.
This hospital-level file contains one record for every hospital in the NIS universe, making it a convenient source for calculating various statistics based on both the population of hospitals and the NIS sample of hospitals. Data are self-reported by hospitals. The file contains hospital-level statistics for hospital reporting periods, which do not necessarily correspond to the calendar year.
For 2002, the survey included records for 4,895 hospitals. The AHA Survey data report discharges and inpatient days (overall, Medicare, and Medicaid), as well as hospital information such as bed counts, employment, and payroll. In addition, hospitals indicate specific services offered.
Some adjustments were necessary to generate comparison statistics. AHA birth counts (healthy newborns) were added to AHA discharge counts to generate a statistic comparable with total NIS discharges. Average length of stay was computed by dividing inpatient days by the calculated discharges. This implies that same-day stays have a length of one day. Consequently, in comparisons of average lengths of stay between the NIS and AHA data, same-day stays in the NIS were recoded from zero to one for this analysis.
Conducted by the National Center for Health Statistics (NCHS), the 2002 NHDS included 327,254 discharges from 445 hospitals. The NHDS covered discharges from United States hospitals categorized as short-stay (hospitals with an average length of stay under 30 days), including both general (medical or surgical) and children�s hospitals. Federal, military, and Veteran�s Affairs hospitals were excluded from the survey.
The NHDS sample included with certainty the largest hospitals: those with at least 1,000 beds, or at least 40,000 discharges. The remaining sample of hospitals was based on a stratified, three-stage design:
Medical Coding and Edits
The medical information that was recorded manually on the sample patient abstracts was coded centrally by NCHS staff. Up to seven diagnostic codes were assigned for each sample abstract. In addition, if the medical information included surgical or non-surgical procedures, up to four codes for these procedures were assigned. As with the NIS, the system currently used for coding the diagnoses and procedures on the medical abstract forms, as well as on the commercial abstracting services data files, is the International Classification of Diseases, 9th Revision, Clinical Modification, or ICD-9-CM.
The NHDS usually presents diagnoses and procedures in the order in which they were listed on the abstract form or obtained from abstract services. However, there were exceptions to this practice. For women discharged after a delivery, a code of V27 from the supplemental classification was entered as the first-listed code, with a code designating either normal or abnormal delivery in the second-listed position. In another exception, a decision was made to reorder some acute myocardial infarction diagnoses. If an acute myocardial infarction was listed with other circulatory diagnoses and was other than the first entry, it was reordered to the first position. The general rule of reordering with the NHDS was as follows: if a symptom appeared as a first-listed code and a diagnosis appeared as a secondary code, the diagnosis replaced the symptom, which was moved to appear after the diagnosis.
| Characteristics | 2002 NIS | 2002 NHDS |
|---|---|---|
| Number of hospitals | 984 | 445 |
| Number of discharges | 7,828,286 | 327,254 |
| Intended universe | Discharges from community hospitals, as defined by AHA � non-Federal, short-term general, or other specialty hospitals that were not a hospital unit of an institution. Short-term rehabilitation hospitals were excluded. | Discharges from non-institutional hospitals (excludes Federal, military, and VA hospitals) located in the 50 states and the District of Columbia. Only short-stay hospitals (ALOS < 30 days) or those whose specialty is general (medical or surgical) or children�s general hospitals are included in the survey. |
| Bed size | No restriction was placed on bed size in creating the file, but no hospitals in the sample have fewer than six beds. | Must have at least six beds staffed for patient use to be included. |
| Sample or universe | Sample | Sample |
| Sampling frame | 35 states | 50 states and the District of Columbia |
| Sample design � hospitals | By geographic region, control/ownership, location, teaching status, and bed size. | Includes all hospitals with > 1,000 beds or > 40,000 discharges annually, plus an additional sample of hospitals in two stages. A sample of 112 PSUs was selected. These PSUs were a probability sample of the counties or metropolitan areas used in the 1985-1994 National Health Interview Survey. A sample of 445 hospitals was selected within these PSUs. |
| Sample design � discharges | All discharges from sampled hospitals were included. | A systematic random sample of discharges was selected from each hospital. |
| Reassignment of diagnosis codes | None | For women discharged after delivery, a code of V27 was entered as the first-listed code. If a symptom appeared as a first-listed code and a diagnosis was listed as a secondary code, the diagnosis replaced the symptom. If acute myocardial infarction was listed with other circulatory conditions, it was reordered to the first entry. |
Table 3 summarizes some of the key differences in hospitals and discharges represented by the NIS and NHDS data files. Sampling error exists in both the NHDS and the NIS. However, the NIS includes nearly 25 times the number of NHDS discharges and more than twice the number of NHDS hospitals. Further, the NIS contains all discharges from sampled hospitals, whereas the NHDS contains a sample of discharges from sampled hospitals. As a result of these sampling differences, statistics calculated from the NIS usually have much smaller standard errors than those calculated from the NHDS. In addition, it was not always possible to calculate valid estimates of standard errors from the NHDS for statistics calculated from rare subpopulations. For example, mortality estimates for low frequency procedures and diagnoses might be based on fewer than a dozen cases in the NHDS, while the same subpopulations could contain hundreds of discharges in the NIS. Statistics from the NHDS were assumed to be representative geographically, because the sampling frame was relatively unrestricted, encompassing all Federal, acute-care general United States hospitals with six or more beds. In contrast, the NIS sampling frame for 2002 was limited to the 35 states that made their data available for research purposes.
The MedPAR data obtained from the Centers for Medicare & Medicaid Services (CMS) include all records for each fee-for-service Medicare discharge from a Medicare-certified, short-stay United States hospital. Federal fiscal year records for 2002 and 2003 were used to create a calendar year 2002 MedPAR file with slightly more than 11.5 million discharge records. To ensure that the hospital composition of the MedPAR file was consistent with the NIS universe, only AHA-defined community hospitals � as specifically designated by the American Hospital Association (AHA) � were retained in the MedPAR-derived file for this study. In the MedPAR data, same-day stays (admission and discharge on the same day) were assigned a length of stay of one day. Consequently, in comparisons of average lengths of stay between the NIS and MedPAR data, same-day stays in the NIS were recoded from zero to one for this analysis.
Table 4 summarizes some of the key differences in hospitals and discharges represented by the NIS and MedPAR data files. Medicare discharge statistics from MedPAR have no sampling error associated with them because this file represents a census of 2002 fee-for-service Medicare discharges. However, analyses suggest that the MedPAR data underreport total Medicare discharges by omitting most discharges for managed care. In 2002, 13.6 percent of Medicare enrollees were in managed care, including HMOs (CMS, 2004). However, virtually no calendar year 2002 MedPAR discharges were identified as managed care enrollees (0.008 percent), suggesting that nearly 13.6 percent of the Medicare population may have been excluded. As will be discussed throughout the report, this omission has significant implications for the various uses of the MedPAR and NIS data files.
| Characteristics | 2002 NIS (Medicare Only) | MedPAR |
|---|---|---|
| Number of hospitals | 979 (with Medicare discharges) | 3,9031 |
| Number of discharges | 2,867,004 | 11,562,1832 |
| Intended universe | Discharges from community hospitals, except rehabilitation hospitals, as defined by AHA � non-Federal, short-term general, or other special hospitals that were not a hospital unit of an institution. | All Medicare discharges. Only discharges from non-rehabilitation, community hospitals were included, for comparison purposes. |
| Bed size | No restriction was placed on bed size in creating the file, but no hospitals in the sample have fewer than six beds. | No restriction was placed on bed size in creating the file, but no hospitals in the sample have fewer than six beds. |
| Sample or universe | Sample | Universe |
| Sampling frame | 35 states | 50 states and the District of Columbia |
| Sample design � hospitals | By geographic region, control/ownership, location, teaching status, and bed size. | All hospitals were included. |
| Sample design � discharges | All discharges from sampled hospitals were included. | All fee-for-service discharges were included. |
| Reassignment of diagnosis codes | None | None |
1Short-term general and specialty community hospitals.
2Discharges from short-term general and specialty community hospitals.
The following measures were chosen to compare the NIS to the NHDS and MedPAR databases:
These measures of utilization and outcomes were selected because they are common in health services research and important for health policy and resource planning analyses.
The NIS-MedPAR comparison included total hospital charges in addition to the three variables noted previously. When comparing NIS records to MedPAR data, only the NIS discharges for which Medicare was the expected primary or secondary payer were examined.
Estimates derived from both the NIS and NHDS were based on weighted discharge records from stratified samples. The SAS software PROC SURVEYMEANS was used to compute standard errors for the NIS (see the NIS Variance Report4 for details). The stratifier variable included in the NIS (NIS_STRATUM) was specified as the stratum, and the unique hospital identifier (HOSP_ID) was specified as the cluster variable. A description of the method used for calculating standard errors for the NHDS is provided in Appendix D.
4http://www.hcup-us.ahrq.gov/reports/methods/2003_02.pdf
NIS-AHA Comparisons
Tables comparing characteristics from AHA universe hospitals and NIS hospitals (Table 7 and Table 8) appear in Appendix A. All numbers in these tables come from the AHA Annual Survey; no significance tests were performed for these comparisons because the AHA is a census of hospitals, not a sample. Therefore, the comparison statistics have no associated sampling error.
Significance tests were conducted for the discharge comparisons of AHA counts and NIS estimates (Table 9 - Table 11). The AHA data are a population, based on the annual AHA survey, so a one-sample t-statistic was computed for these comparisons. AHA discharges represent the survey counts adjusted for the number of well newborns. An estimate of the average length of stay (ALOS) was obtained from the AHA by dividing the total number of days by the total number of discharges reported in the 2002 AHA survey of hospitals.
Same-day discharges from the NIS were recorded with length of stay equal to zero. However, for comparisons with AHA statistics, the length of stay measures for NIS same-day discharges were changed to one day. The standard error for the NIS estimates used in these calculations was generated by the SURVEYMEANS procedure.
In order to assess the extent to which hospitals invested in technology, we created a high-technology index based on information from the AHA survey. The index is a simple additive index of the number of selected technologies reported by individual hospitals. The following 10 technologies were included in this index: cardiac catheterization, computerized tomography (CT) scanner, neonatal intensive care unit, magnetic resonance imaging (MRI), open heart surgery, organ transplant services, x-ray radiation therapy, extracorporeal shock wave lithotripsy, coronary angioplasty, and positron emission tomography (PET) scanner. These high technology services were identified by Spetz and Baker (1999)5 and were used to assess the impact of managed care on the availability of medical technology.
5Spetz, J. and Baker, L. Has Managed Care Affected the Availability of Medical Technology? Public Policy Institute of California, 1999. http://www.ppic.org/content/pubs/report/R_599JSR.pdf. ![]() (Accessed July 10, 2008.)
(Accessed July 10, 2008.)
We compared the mean number of high technology services provided among hospitals selected for the NIS with non-NIS hospitals, as illustrated in Table 12. Comparisons include the high-technology index, along with percentages of hospitals that offer individual services.
NIS-NHDS Comparisons
For each NIS-NHDS comparison, a statistical test determined whether the NIS and NHDS estimates differed significantly. Because the NIS and NHDS estimates were both based on samples, two-sample t-tests were performed whenever valid estimates of the NHDS standard error could be made. Because of the limited sample size, valid estimates were not available for all breakdowns of the NHDS data. Please refer to Appendix D for a description of comparison tests and an explanation of restrictions on calculating NHDS sample errors. Differences were reported at the 0.01 and 0.05 significance levels.
Tables comparing NIS and NHDS statistics (Table 13 -Table 17) appear in Appendix B.
NIS-MedPAR Comparisons
Because the MedPAR data represent the population, and not a sample, a one-sample t-statistic was computed for these comparisons. The standard error for the NIS estimate used in these calculations was generated by the SURVEYMEANS procedure for the subset of NIS discharges with Medicare identified as the principal payer. Same-day discharges from the MedPAR are recorded with a length of stay equal to one day, while same-day discharges from the NIS are recorded with a length of stay equal to zero. Therefore, for NIS-MedPAR comparisons, NIS length of stay measures for same-day discharges were changed to one day.
Tables comparing NIS and MedPAR statistics (Table 18 - Table 24) appear in Appendix C.
Comparisons by Diagnosis and Procedure Categories
NIS data were compared with both NHDS and MedPAR data across selected diagnosis and procedure groups. For NHDS comparisons, the 25 diagnosis and procedure groups observed most frequently in the NIS were selected. For MedPAR comparisons, the 25 diagnosis and procedure groups selected were those found most frequently on NIS discharges for which Medicare was the expected payer. The diagnosis and procedure groups represent a majority of pertinent discharges. For both the NHDS and MedPAR comparisons, more than one-half of all discharges were represented by the 25 diagnosis groups, while the 25 procedure groups represent nearly 60 percent of discharges that include procedure codes. In addition, MedPAR comparisons included the 25 most frequent Diagnosis Related Group (DRG) codes observed for NIS Medicare discharges.
Grouping of diagnoses and procedures was done with Clinical Classifications Software (CCS). The CCS, formerly known as the Clinical Classifications for Health Policy Research (CCHPR), was developed as a means to categorize diagnoses and procedures into a limited number of clinically relevant categories. Developed for health policy analysis, the CCS can be used for aggregating the thousands of ICD-9-CM diagnoses and procedures into a manageable number of meaningful categories. CCS codes were assigned based on the principal, or first-listed, diagnosis and procedure for each discharge.
We should note that estimates from different samples will not be identical because of sampling variation. Statistically significant differences can be expected for a variety of reasons, including different sampling strategies. In addition, recoding of certain conditions � as sometimes occurs in the NHDS � may lead to significant differences in the affected categories. Finally, the sheer number of tests (more than 800), will produce some statistically significant results purely by chance.6
6 While some type of correction for the number of tests could be applied, given the large number of tests, this would greatly increase the risk of a Type II error.
This section refers to a series of tables in Appendix A (Table 7 - Table 11) comparing:
It is important to note that NIS and AHA facilities are not separate collections; NIS hospitals represent a subset of the AHA universe. As such, NIS averages and medians are very similar to AHA statistics. These tables suggest that while NIS hospitals were similar in size to hospitals in the AHA universe, NIS facilities tended to accommodate more patients and perform more procedures. In addition, Medicaid patients were less prevalent in NIS hospitals than in all AHA facilities. These differences may be factors in the observed variations for NHDS and MedPAR comparisons to the NIS.
General Hospital Characteristics
Comparisons of general hospital characteristics revealed some differences, as illustrated in Table 8. In general, NIS hospitals admit and discharge more patients than hospitals in the AHA universe: the NIS average was more than 4.9 percent higher than the AHA average, while the median NIS count was 4.5 percent higher. In contrast, the average NIS hospital�s length of stay � not adjusted for hospital size or discharges counts � was 4.6 percent shorter than the AHA average (when adjusted for well newborns). As a result of these two factors, there was little difference in occupancy rates (51.4 percent for NIS hospitals and 51.3 percent for AHA hospitals). In addition, hospital size (as measured by bed count) was comparable for NIS and AHA facilities. NIS hospital size was only 1.6 percent larger than AHA hospitals (155.1 beds compared to 152.7 beds), while the median NIS hospital was 1.1 percent smaller than the median AHA hospital.
Activity at NIS hospitals tended to be higher than in the AHA universe, as reflected in the following outcomes:
Along with the higher level of activity found at NIS facilities, staffing and expenditures were also generally higher than rates observed across the AHA hospitals. Overall employment, as measured by full-time equivalent (FTE) counts, was four percent higher at NIS hospitals. Adjusting for size and usage also demonstrated higher staffing levels in NIS facilities:
Table 8 also shows that NIS hospitals tend to spend more than hospitals in the AHA universe. Even when adjusted for hospital size (bed counts), expenses at NIS hospitals were higher than AHA averages. Compared to AHA hospitals, NIS hospital spending was higher on the four financial measures:
Discharge and Average Length of Stay Comparisons
Table 9 through Table 11 contrast NIS discharge and average length of stay estimates with AHA statistics. These tables present analyses across a number of categories: overall, by region, by hospital control, by bed size within hospital control, by location and teaching status, and by hospital size within location and teaching status.
Nearly all NIS discharge estimates closely align with the discharge counts from the AHA survey. This is not surprising, because NIS sampling strata and NIS discharge weights were based on AHA annual survey results. The AHA-derived sampling weights in the NIS yield discharge counts consistent with the AHA universe, overall, by region, and for most categories of hospital control and type. Of the 35 discharge comparisons, only three significant differences were observed:
While the NIS design is based on the AHA, some minor differences emerged between NIS estimates and AHA statistics. This occurs because definitions of ownership and bed size categories used in the report do not perfectly match definitions used to stratify the NIS sample. Consequently, a perfect match in distribution for detailed categories such as hospital control was not expected.
For average length of stay (ALOS), the NIS differs from the AHA in nearly one-half of the comparisons. Overall, the NIS ALOS estimate was three percent longer than the AHA statistic. Differences were observed in comparisons by region in the Midwest and West (the NIS estimate was longer by two and six percent, respectively).
Most ALOS comparisons on hospital control and bed size were consistent between the NIS and the AHA. In three categories, the NIS estimate was longer than the AHA length of stay:
For two other hospital control and bed size categories, the NIS estimate was shorter than the AHA length of stay:
NIS estimates more often agree with AHA statistics for discharges than for ALOS by hospital location, teaching status, and size. Of the 12 ALOS comparisons, eight significant differences were observed. With three of the differences, the NIS estimates were shorter than the AHA statistics; with the other five differences the NIS estimates were longer. For rural hospitals, the NIS estimate was four percent shorter than the AHA length of stay calculation. Estimates for small and medium rural hospitals were also shorter (six and four percent, respectively).
Five significantly longer NIS estimates of ALOS were observed with urban hospitals. For urban, non-teaching hospitals, the NIS ALOS estimate was three percent longer than the AHA statistic, while the NIS estimate for urban teaching hospitals was five percent longer. Three other significant differences were discovered within hospital size categories:
Specialty and Technology Services
Some differences between the NIS and the universe of AHA hospitals may be caused by the fact that the sampling frame for the NIS is less than the universe of all U.S. hospitals. Specifically, the NIS might include hospitals that employ more technologically-intense services. To examine this idea, we compared NIS hospitals to non-NIS hospitals across a number of specialty and technology-intensive services, and results are depicted in Table 12. This table includes a simple (additive) index of technologies reported by individual hospitals. The technology services considered in this analysis were identified by Spetz and Baker (1999) to assess the impact of managed care on the availability of medical technology. The following 10 services were included in this high-technology index:
Differences between NIS and non-NIS hospitals were generally small. The high-technology index count was 2.91 services for NIS hospitals and 2.83 services for non-NIS facilities (a difference of 2.8 percent). Of the 10 services that comprise the index, seven were more prevalent and three were less common in NIS hospitals. Most disparities, however, were small � less than one percentage point overall. The exceptions, representing the largest areas of difference, included the following four services:
In addition to the high-technology index, Table 12 also examines a handful of other specialty services and units within hospitals. For two of these measures, the specialty units were less prevalent in NIS hospitals (Pediatric Specialty Hospitals and Rehabilitation Units). The other three specialty units (Alcohol/Chemical Dependency Units, Trauma Centers, and Emergency Departments) were more often found within NIS facilities. In particular, Emergency Departments were more widespread among NIS hospitals � nearly three percentage points higher in NIS hospitals, as compared with non-NIS facilities.
NIS and NHDS estimates agreed in overall comparisons and across patient categories. This was also true for most hospital comparisons and specific diagnosis and procedure categories. Overall, agreements were observed for 74 percent of the discharge comparisons and 99 percent of the average length of stay (ALOS) comparisons. The degree of consistency for in-hospital mortality rates was also high: no significant differences were found with region and patient categories, and estimates agreed for 88 percent of hospital category comparisons. Of the NIS-NHDS differences discovered, most occur in diagnosis and procedure groupings. Appendix B includes Table 13 through Table 17, which provide comparisons of NIS and NHDS estimates. The following sections describe these tables in more detail.
Overall and Regional Comparisons
Overall and by region, no statistically significant differences emerged between the NIS and NHDS data for discharges, ALOS, or in-hospital mortality rates (Table 13). ALOS comparisons could not be made for the Northeast and South because a reliable standard error for the NHDS estimate could not be determined. However, the magnitudes of the differences between the NIS and NHDS estimates in these regions were small and appear consistent with the non-significant differences shown in other regions.
Comparisons by Hospital Characteristics
NIS and NHDS estimates were similar for each of the three hospital control/ownership categories. However, some significant differences for discharge estimates were discovered between the NIS and NHDS in the bed size groupings within control/ownership categories (Table 14), particularly for private non-profit hospitals.
It is likely that these differences were caused by the composition of the two samples: a greater proportion of the NIS discharges originate in larger hospitals, while a larger share of NHDS discharges originates in smaller hospitals. Figure 2 through Figure 4 illustrate numbers of discharges from the AHA, NIS, and NHDS. These charts reveal that NIS discharge statistics generally agreed with AHA numbers � an expected outcome since NIS discharges are weighted within each stratum to AHA discharge counts. NHDS discharge estimates tended to overestimate discharges from small hospitals (1-99 beds) and underestimate discharges from very large hospitals (500+ beds), when compared with AHA counts.
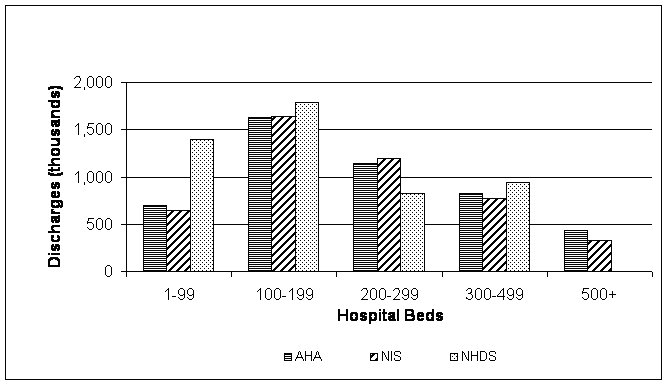
Because of these discrepancies in sample composition, significant differences exist in discharge count comparisons by hospital bed size. Significant differences occur with eight of the 14 discharge comparisons by hospital bed size within control/ownership categories. The NIS estimate was lower than the NHDS figure in five cases (categories with fewer than 300 beds) and higher in three other instances (categories with more than 300 beds). In a fourth case, proprietary hospitals with 500 or more beds, NIS discharges exceeded the NHDS statistic, but no comparison was made because the NHDS estimated zero discharges and a valid estimate of standard error was unavailable. In contrast to the zero discharges estimated by the NHDS, the NIS estimate for proprietary hospitals with 500 or more beds was 331,000 discharges. According to the AHA data, there were 429,000 discharges for this category (refer to Table 10).
Figure 2. Estimated Discharges from Public Hospitals, 2002 (text version)
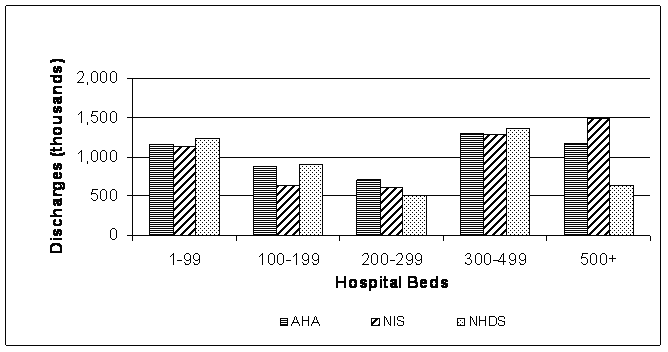
Figure 3. Estimated Discharges from Private Non-Profit Hospitals, 2002 (text version)
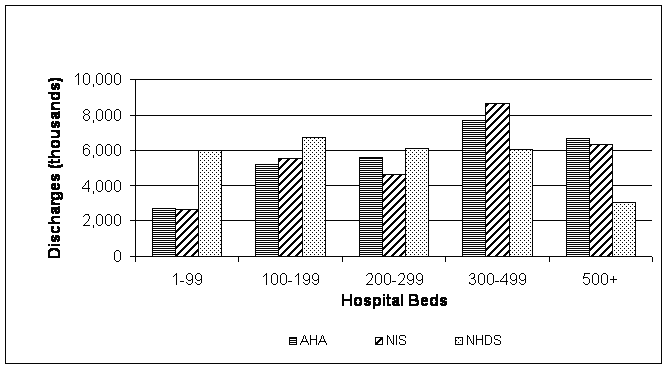
Figure 4. Estimated Discharges from Proprietary Hospitals, 2002 (text version)
ALOS and in-hospital mortality estimates were consistent. No significant differences were observed with any ALOS estimates, and only two in-hospital mortality estimates were inconsistent: the NIS estimates for public hospitals with 1-99 beds was 69 percent higher than the NHDS statistic, and the NIS estimate for 200-299 bed proprietary hospitals was 18 percent higher (Table 14). No comparison was possible for proprietary hospitals with more than 500 beds because no standard error estimate was available for the NHDS statistics; the NHDS reported no discharges from this type of hospital.
Comparisons by Patient Characteristics
For nearly all comparisons by patient categories (Table 15), there was agreement between the NIS and NHDS estimates. The NIS and NHDS samples aligned closely across most age groups, sex, and payer categories. There were no differences in either ALOS estimates or in-hospital mortality rates. Comparisons of discharge estimates differed in only three categories; differences were discovered in relation to two race categories and one principal payer category.
The racial composition of the two samples also differed greatly; this is reflected in the two discrepancies that arose with race categories. The NHDS contains proportionately more discharges for white patients than does the NIS. In contrast, the relative number of discharges for "other" race patients in the NIS is considerably higher than in the NHDS. Both samples include large numbers of discharges without racial information; this information was missing for 29 percent of NIS discharges and 23 percent of NHDS discharges. (Some states do not report race/ethnicity to HCUP, so race is missing for 11 states in the NIS).7 Because the NHDS does not include state information, it is not possible to determine if the pattern of missing information is similar. Looking only at discharges with race information, however, the NIS appears more representative of the U.S. population than the NHDS, as shown in Table 5.
7NIS states for which race was not available include Georgia, Illinois, Kentucky, Maine, Minnesota, Nebraska, Nevada, Ohio, Oregon, Washington, and West Virginia.
| Race | U.S. Population8 | NIS Discharges with Race Information | NHDS Discharges with Race Information |
|---|---|---|---|
| White | 68% | 67% | 79% |
| Black | 13% | 14% | 15% |
| Other | 19% | 19% | 5% |
8U.S. Census Bureau, Annual Estimates of the Population by Sex, Race and Hispanic or Latino Origin for the United States: April 1, 2000 to July 1, 2003 (NC-EST2003-03).
For "other payer," the NIS statistic was 46 percent lower than the NHDS estimate, a difference of approximately 987,000 discharges. Much of that difference seems to stem from discharges without payer information. Missing payer discharges account for 30 percent of �other payer� discharges from the NHDS but less than one percent of NIS discharges.
Comparisons by Diagnosis Category
While comparisons of diagnosis categories revealed more significant differences than any other grouping, there was still a great deal of consistency between the NIS and NHDS samples, as illustrated in Table 16). The majority of comparisons in these categories revealed no significant differences. NIS discharge estimates differed significantly from NHDS estimates for eight of the 24 most common diagnosis categories. The NIS estimate was higher in three categories and lower in the remaining five groupings:
| Higher NIS Discharge Estimates | Lower NIS Discharge Estimates |
|---|---|
|
|
Of these eight significant differences in the number of discharges, four can be attributed to code reordering in the NHDS (�nonspecific chest pain,� and three pregnancy/delivery categories). The NIS does not change the sequence of diagnosis codes: the first diagnosis listed for each discharge was assigned as the principal diagnosis. This contrasts with the NHDS, where diagnoses were reordered under certain conditions. For example, when a symptom appeared as the first-listed code, the NHDS re-assigned the symptom as a secondary diagnosis. This explains the dramatically higher figure for non-specific chest pain in the NIS sample, as compared with the NHDS (nearly 13 times higher).
Four of the eight significant discharge differences could not be attributed to NHDS coding changes. With each of these four categories, the NIS estimates were lower than NHDS estimates ("affective disorders," "fluid and electrolyte disorders," "urinary tract infections," and �asthma�). Disparities for these four categories have persisted over the past several years of data. For three of the four groups, the discrepancy has been constant over the past four years; however, the difference between NIS and NHDS estimates for "affective disorders" grew during that same period.
Of the 25 most common diagnoses, four relate to pregnancy and delivery, including the category "normal pregnancy." Significant differences emerged for three of these categories. (No statistical comparison was possible for the fourth category, "trauma to the perineum and vulva," because a valid estimate of the NHDS standard error was not available.) These differences between the NIS and the NHDS can be attributed to reordering of diagnosis codes in the NHDS data.
The NHDS assigns a code of V27 ("outcome of delivery" included in the CCS category of �normal delivery�) as the principal diagnosis for all women discharged after delivery, regardless of the original principal diagnosis. As a result, the NHDS estimates 3.96 million "normal deliveries" � significantly higher than the NIS estimate. However, the NHDS estimates for the other three pregnancy/delivery classifications were much lower than the NIS estimates.
The "normal delivery" diagnosis category was also responsible for the single significant ALOS difference. As noted earlier, the "normal delivery" category in the NIS was listed as the principal diagnosis only when coded by the hospital. In contrast, deliveries in the NHDS "normal delivery" category include women who had episiotomies, as well as a variety of minor birth complications. It was not surprising, then, that the average length of stay would be shorter (24 percent) for the NIS "normal" category, as it does not include higher risk populations.
Significant differences were discovered with eleven of the 25 mortality contrasts. Three of these differences were related to pregnancy/delivery conditions and reordering that occurred for some NHDS discharges, but the remaining differences are unexplained. Overall, there were five conditions where the NIS estimate was higher than the NHDS estimate, and six where the NIS estimate was lower:
| Higher NIS Mortality Estimates | Lower NIS Mortality Estimates |
|---|---|
|
|
Comparisons by Procedure Category
Table 17 provides comparison results across groups of procedures. With discharge estimates, NIS statistics differed significantly from NHDS results for five of the 25 categories. In each case, the NIS estimate was significantly higher than the NHDS estimate:
No significant differences for ALOS comparisons were found by procedure groups. But NIS-NHDS differences were discovered for eleven of the in-hospital mortality comparisons. The NIS mortality estimate was lower than the NHDS statistic for six procedures and higher than the NHDS estimate for five other procedures.
| Higher NIS Mortality Estimates | Lower NIS Mortality Estimates |
|---|---|
|
|
With the exception of discharge counts, NIS estimates of Medicare measures were generally consistent with MedPAR statistics. NIS discharge estimates were uniformly higher than the MedPAR numbers by approximately 20 percent (Table 18). The foremost cause of this discrepancy seems to be the omission of most managed care clients from the MedPAR. While approximately 13.6 percent of Medicare patients were enrolled in managed care programs, the MedPAR data contain virtually no managed care discharges (only 913 out of 11,562,183 total discharges).
File composition was another contributing factor. While the MedPAR represents actual fee-for-service claims paid by Medicare, the NIS-Medicare sample consists of discharges (both fee-for-service and managed care) for which Medicare was the expected payer (either primary or secondary). This may explain the higher NIS counts: the expected payer may not be the actual payer.
Because the overall NIS estimate of Medicare discharges exceeds the actual number in the MedPAR data, it was not surprising to find that nearly all the NIS discharge estimates were also significantly higher than the corresponding MedPAR totals. Significant differences were observed for 80 percent of the discharge comparisons. This suggests the need for a more useful comparison of discharges, so we have included a test of discharge proportions in the various categories. For most comparisons of discharge proportions, the test revealed few meaningful differences. In fact, proportions were consistent for 76 percent of all categories.
NIS Medicare estimates were also consistent with MedPAR measures of ALOS, in-hospital mortality rates, and average total hospital charges. No significant differences were observed for:
Across hospital categories only a handful of meaningful differences were observed. The tables in Appendix C (Table 18-Table 24) compare NIS Medicare estimates with MedPAR statistics. The following sections refer to these tables.
Overall and Regional Comparisons
Overall, the NIS estimate of Medicare discharges was 20 percent higher than the total number of MedPAR discharges (Table 18). For most Census regions, the NIS estimates were also higher than MedPAR counts, although the difference was not significant in the South. The magnitude of difference was greatest in the West (41 percent higher) and Northeast (34 percent higher); these are the regions with the largest Medicare managed care penetration. When examined from the perspective of proportions (percentage of discharges), significant differences were discovered in the Northeast and West (the NIS was higher) and in the South (the NIS was 11 percent lower).
No significant NIS-MedPAR differences were found for ALOS or average total hospital charge measures, either nationally or regionally. For in-hospital mortality rates, the NIS estimate for the West was five percent higher than the MedPAR rate (4.43 percent versus 4.21 percent). The similarities of these statistics suggest that no fundamental differences exist between the two databases in their description of patient outcomes.
Comparisons by Hospital Characteristics
Two sets of hospital characteristics were compared for Medicare discharges: first, hospital control and number of beds (categories used in the NHDS comparisons); and second, hospital location, teaching status, and size (NIS stratification variables). While NIS discharge estimates generally exceed MedPAR counts, most other statistics, including discharge proportions, were quite similar between the two databases. Statistics agreed in more than 80 percent of the comparisons.
Hospital Control
When exploring the initial dimension of hospital control (ownership), significant differences were observed for NIS estimates of Medicare discharges for private, non-profit hospitals and proprietary hospitals (Table 19). In both cases, the NIS estimate was 21 percent higher than the MedPAR count. For all other measures (discharge proportion, ALOS, in-hospital mortality, and average total charge), the NIS estimates were similar to the MedPAR results.
When hospital control was examined by number of beds (Table 19), many NIS discharge estimates were actually in agreement with Medicare counts; significant differences were observed for only four of the 15 discharge comparisons by number of beds. Differences in discharge counts include:
Most discharge proportions were also similar between the NIS and MedPAR databases. Only three significant differences emerged for the hospital control and bed size comparisons. One bed size difference was observed within each control category. In all three cases, the NIS proportion was lower than the MedPAR percentage:
For each of the remaining measures � ALOS, in-hospital mortality, and average total charge � NIS and MedPAR statistics were highly similar when control was examined across bed size categories. Of the 15 comparisons, few meaningful differences emerged.
Four significant differences were discovered for average length of stay comparisons:
Analysis also revealed three differences for in-hospital mortality rates:
Additionally, three significant differences emerged for average total charge:
To summarize the hospital control comparisons, most NIS estimates for hospital control and bed size categories were consistent with equivalent MedPAR statistics. Where differences were observed, there was no apparent pattern. Of the 18 hospital groupings, we observed only four groups with more than one significant difference. These four exceptions were:
Hospital Location and Teaching Status
A second set of hospital comparisons examined NIS and MedPAR statistics by two dimensions of hospital type: location and teaching status (Table 20). Most NIS discharge estimates, including statistics for all three hospital types, were significantly higher than the MedPAR counts. However, for discharge proportions, only two substantial differences were observed: the estimated NIS proportion was seven percent lower than the MedPAR proportion for all rural hospitals, but 31 percent higher for small rural hospitals.
Comparisons of other measures again revealed consistency between the NIS and MedPAR databases. In overall comparisons of location and teaching status, only a handful of significant differences were found:
Comparisons by Patient Characteristics
Comparisons by the patient characteristics of race, age, and sex revealed significant differences for all discharge count comparisons and most discharge proportions (Table 21). Several differences also emerged in the comparison of in-hospital mortality rates, but nearly all ALOS and average total charge evaluations were consistent between the NIS and MedPAR.
NIS estimates of discharges for whites and blacks were actually lower than MedPAR counts. And unlike comparison by hospital characteristics, discharge proportion differences surfaced for most patient categories of race and age. The NIS and MedPAR present different mixes of patient characteristics:
Relative to MedPAR numbers, the NIS tends to overestimate patients between 65 and 84 years of age (the age group responsible for approximately two-thirds of Medicare inpatient discharges) and to underestimate patients younger than 65 and older than 85. Comparing the percentage of discharges in each age group, the NIS overestimates the 65-74 age group by two percent and the 75-84 age group by four percent. On the other hand, the NIS underestimates the 0-64 group by nine percent and the 85+ age group by four percent. There were no differences between the NIS and MedPAR when comparing sexes for percentages of discharges, ALOS, in-hospital mortality, and average total charges.
ALOS and average hospital charge estimates were generally in agreement between the two databases; in nearly every category, no meaningful differences emerged between the NIS and MedPAR numbers. The NIS ALOS estimate was lower than the MedPAR average only where race was unknown (six percent). The NIS average charge estimate for unknown race was also lower than the MedPAR average (18 percent). Finally, the NIS average charge estimate for �whites� was seven percent higher than the MedPAR statistic.
Significant differences were observed for most of the race and one-half of the age group comparisons of in-hospital mortality rates. NIS estimates for �white,� �other,� and �unknown race,� were three to 13 percent higher than the corresponding MedPAR statistic. For patients 65-74 years of age, the NIS estimate was three percent lower than the MedPAR rate, but for patients 75-84 years of age, the NIS average was three percent higher.
Comparisons by DRG
In comparisons of diagnosis related group (DRG) categories (Table 22), most NIS estimates were consistent with corresponding MedPAR statistics, with the usual exception of discharge counts. In fact, significant differences were discovered for 24 of the 25 DRG comparisons of discharge counts. The NIS estimate was higher than the MedPAR count in every case, ranging from 15 percent higher (�circulatory disorders�) to 26 percent higher (�chest pain�). The median difference in number of discharges was 21 percent.
No meaningful differences were observed for average hospital charge comparisons. Other measures were also consistent: for DRG comparisons of discharge proportions, ALOS, and in-hospital mortality, NIS and MedPAR statistics were fairly similar. Differences emerging for these measures include the following:
Of the few meaningful discrepancies found, no pattern emerged with these DRG comparisons. In no categories were three or more significant differences discovered, and in only six categories were two significant differences observed, one of which was discharge counts.
Comparisons by Diagnosis Category
As with DRG comparisons, most NIS outcome estimates for diagnosis categories were consistent with MedPAR measures (Table 23). The exception, as with other NIS-MedPAR contrasts was discharge counts. Significant differences were observed between NIS estimates of Medicare discharges and MedPAR discharges by count for 24 of the 25 principal diagnosis categories. These differences ranged from 12 percent higher to 27 percent higher ("spondylosis, invertebral disc disorders, & other back problems" and "syncope," respectively). The median difference was 21 percent.
Comparisons for other measures indicated a high degree of consistency between the NIS and MedPAR statistics. All NIS estimates of average hospital charge were consistent with MedPAR averages. The 25 diagnosis category comparisons revealed few significant differences for any of the other three measures (discharge proportions, ALOS, and in-hospital mortality rates). Key differences were discovered in the following areas:
Comparisons for most diagnosis categories revealed discrepancies only on discharge counts. When other differences were observed, inconsistency was generally limited to one other measure. The one exception was "diverticulosis and diverticulitis," where the NIS discharge proportion and ALOS estimates both diverged from the MedPAR statistics.
Although CCS diagnosis categories and DRG categories do not necessarily correspond, the two sets of comparisons were very similar. Significant differences in one table were often mirrored in the other:
Comparisons by Procedure Category
Procedure group comparisons revealed slightly greater variability in discharge counts with a somewhat wider range in differences than that observed for diagnosis or DRG categories. As depicted in Table 24, all but four NIS discharge estimates by procedure significantly exceeded the corresponding MedPAR total; the median difference was 18 percent. NIS discharge estimates were higher than MedPAR counts, ranging from 10 percent ("diagnostic bronchoscopy and biopsy of bronchus") to 27 percent higher (�blood transfusion�).
For the majority of other measures, the NIS estimates were consistent with MedPAR statistics. Only a handful of differences in other outcomes were observed across the 25 most frequent procedure categories:
All NIS average hospital charge estimates were consistent with MedPAR averages.
Finally, only one of the procedure categories revealed more than one significant difference among the three outcome measurements of discharge proportion, ALOS, and in-hospital mortality rate. For the category "physical therapy," the NIS estimates of ALOS and in-hospital mortality rate exceeded the corresponding MedPAR statistic.
These results indicate that estimates from the 2002 NIS were generally similar to statistics from the 2002 NHDS and the 2002 MedPAR. Most NIS estimates were consistent with NHDS estimates for discharges and in-hospital mortality rates. Additionally, nearly all of the average length of stay estimates were consistent in relation to the two samples. Differences occurred primarily when comparing estimates for specific diagnosis or procedure groups. A critical difference between the 2002 NIS and 2002 NHDS data was that the NHDS reordered some diagnosis codes (in an effort to achieve more uniformity within that sample). As a result of these coding alterations, some significant differences appear in the findings related to diagnosis categories.
Comparisons were made for as many as four outcomes across dozens of different categories. While some differences were observed, few patterns were discernable. For example, with AHA comparisons, the NIS ALOS was often significantly longer than the average stay calculated for the AHA data. In contrast, the NIS ALOS estimates tended to be slightly shorter than NHDS estimates and MedPAR statistics, but few of the differences were statistically significant. In our analysis of nearly 100 comparisons, only 12 categories exhibited discrepancies across data sources. These 12 exceptions include:
Most NIS estimates were consistent with MedPAR statistics. However, one pattern was discovered throughout the NIS-MedPAR comparisons: overall NIS estimates of Medicare discharge counts were 20 percent higher than MedPAR estimates. The likely reason for this difference is the absence of most managed care discharges from the MedPAR data. This discrepancy was exaggerated because the NIS was drawn from states that have higher managed care penetration than the national average. In contrast, most average length of stay, in-hospital mortality, and average total charge estimates from the NIS were consistent with the corresponding MedPAR statistics.
The key difference between the NIS and the databases with which it was compared relates to geographic scope. Both the NHDS and the MedPAR are national in coverage; MedPAR data include all Medicare-paid, fee-for-service discharges in the United States, while NHDS data were gathered from a sampling frame of all 50 states plus the District of Columbia. In contrast, the 2002 NIS was drawn from only 35 states (as shown in Table 1); these states comprise more than 81 percent of all community hospital discharges in the United States. This difference may be a factor for researchers who require comprehensive geographic representation. Some significant differences between the states excluded and included in the NIS may offer explanations for several of the observed differences.
NIS states are disproportionately the more densely populated states. The average population density of NIS states was 125.8 persons per square mile in 2002. This compares with a national average of 81.4 persons per square mile and an average population density for non-NIS states of 29.0 persons per square mile. Of the 10 most densely populated states, all but two were included in the NIS. These NIS states, and their rank in terms of population density order, are: New Jersey (1), Rhode Island (2), Massachusetts (3), Connecticut (4), Maryland (5), New York (7), Florida (8), and Pennsylvania (10). At the other end of the spectrum, only two of the 10 least populous states were included in the NIS: Utah (41) and Nebraska (42).9
Because of these population differences between NIS and non-NIS states, the NIS sampling frame begins with few hospitals in sparsely populated areas. Even weighting the discharges from rural states does not adequately account for the remote areas of the country, which include a disproportionate number of the smallest hospitals. The most rural state included in the sample, Nebraska, has a population density of 22.5 persons per square mile, compared with population densities of 1.1 for Alaska, 5.1 for Wyoming, and 6.3 for Montana.10
9Source of state rankings: State and Metropolitan Area Data Book - 5th Edition and the Annual Estimates of the Population for the United States.
10None of these three states were eligible for HCUP inclusion because none collected all-payer hospital discharge data for the year 2002.
One impact of the specific subset of states selected for the NIS was an overrepresentation of Medicare patients in managed care. In the 35 states included in the 2002 NIS, the market penetration of managed care providers for Medicare enrollees averaged 14.6 percent. In contrast, for the 15 states not included in the NIS, the mean market penetration of managed care providers was only 8.3 percent. Table 6 examines managed care penetration by region of NIS and non-NIS states. In 2002, Medicare managed care market penetration in the Northeast, South, and West regions was higher in NIS states than in non-NIS states; the greatest penetration discrepancies were observed in the West and Northeast11. These were also the regions with the largest difference between MedPAR discharges and NIS estimates. This finding was consistent with the hypothesis that the MedPAR under-represents total stays by omitting most managed care discharges12.
11The NIS includes all Northeast states except New Hampshire.
12Source: Medicare Managed Care Market Penetration for All Medicare Plan Contractors - Quarterly State/County Data Files, June 2001 (http://www.cms.gov/Research-Statistics-Data-and-Systems/Statistics-Trends-and-Reports/HealthPlanRepFileData/Downloads/SC-2002.zip ). (Accessed July 10, 2008)
| Non-NIS States | NIS States | All States in Region | ||||
|---|---|---|---|---|---|---|
| Mean | N | Mean | N | Mean | N | |
| Northeast | 0.8% | 1 | 16.8% | 8 | 16.4% | 9 |
| South | 5.8% | 6 | 8.5% | 10 | 8.0% | 16 |
| Midwest | 9.4% | 4 | 6.2% | 8 | 7.2% | 12 |
| West | 14.1% | 6 | 30.4% | 7 | 28.4% | 13 |
This exclusion by MedPAR was inconsequential in those areas with minimal market penetration by managed care providers; its impact was greater for regions in which managed care participation by Medicare patients was higher. Because the NIS includes discharges for all Medicare managed care patients and not just fee-for-service patients, it may be preferable to the MedPAR file for estimating total Medicare discharges.
While the previous discussion focused on differences between the NIS and other data sources, it should be noted that these differences are only of concern when there is a reason to expect that geographic region might relate to the variable of interest. We must emphasize that the NIS provides a large sample size that tends to yield estimates with much smaller standard errors than does a sample such as the NHDS. Without a sample of several million, as provided by the NIS, estimates for less common procedures and diagnoses are unreliable. While the NIS may over-represent urban areas, the prevalence of higher-density states in the NIS yields data on atypical conditions rarely included in a smaller sample.
NIS discharge estimates were quite similar to AHA numbers, regardless of the hospital characteristics. NIS statistics were generally parallel to NHDS estimates, as well. When estimating ALOS and in-hospital mortality for the nation, or within any major categories, NIS rates were consistent with the NHDS data. Because NIS estimates have greater precision � the result of the large sample size � it may be preferred for certain analyses based on relatively uncommon conditions. Furthermore, the NIS contains total hospital charges, while the NHDS does not. For analysis involving charges on all payers, the NIS is the only choice.
The NIS provides a large sample of Medicare discharges both in managed care and fee-for-service plans; it would therefore be the choice of researchers who wished to include all discharges regardless of payment type. Inclusion of Medicare managed care discharges leads to discrepancies in estimated discharge counts, but most other NIS Medicare estimates were similar to MedPAR statistics, particularly with respect to comparisons by hospital characteristics.
NIS discharge estimates vary from NHDS estimates on the dimension of hospital size; the NIS includes more discharges from large hospitals than the NHDS. In contrast, NIS discharge estimates were similar to AHA survey results. Because the NHDS uses a more geographically complete sampling frame, however, that database might be preferable for researchers, in certain cases.
The NIS also contains significant numbers of discharges for which race was missing (29 percent). While the NHDS also suffers from this problem (23 percent of discharges without race), the MedPAR includes an insignificant number of discharges without race information.
Because of the limitations of the NIS sampling frame, the NIS exaggerates the discrepancy between total Medicare discharges and the MedPAR�s primarily fee-for-service population. The MedPAR database provides no estimate for managed care participants, while the NIS database may overestimate the number of discharges in managed care.
NIS-NHDS Evaluations
Estimates of most outcome measurements from the 2002 NIS and NHDS data were consistent, as were previous evaluations. Overall, the discharge and ALOS estimates from these two databases were similar for 2000, 2001, and 2002. NIS and NHDS estimates of ALOS were almost indistinguishable. Of more than 80 comparisons, few significant ALOS differences were observed in any year: four differences were observed with the 2000 data, two emerged for the 2001 data, and only one was discovered with the 2002 data. NIS and NHDS discharge estimates from 2000 through 2002 were also similar, although in all years, the data sources generated divergent statistics for large and small hospitals.
Similarly, in-hospital mortality rate estimates for 2002 data were consistent with the 2001 data across hospital and patient categories. These estimates were also more consistent across diagnosis and procedure classifications than was the case in 2001. The 2001 comparisons revealed more significant differences than the 2000 report. Of all hospital comparisons, two significant mortality differences were observed, and no meaningful mortality rate differences were discovered for patient categories. These outcomes were similar to the 2001 analysis and represented improvements over the 2000 assessments. For diagnosis and procedure comparisons, the 2002 evaluations revealed fewer differences than in 2001; these results for 2002 are similar to comparisons for 2000 and earlier (2001 now appears to be an aberration). No trend appears with these differences. The number of categories with lower NIS rates was about the same as the number of categories with higher NIS rates.
Discrepancies in in-hospital mortality rate comparisons may be related to differences in the hospitals included in the two samples. The NIS tends to have better representation from larger hospitals and better captures less common diagnoses, which tend to have higher mortality rates13. Furthermore, because the NIS retains all discharges from a hospital, it was not possible to exclude some of the higher mortality cases that might have been treated in skilled-nursing facilities and other long-term care units within the hospital. Differences may also be linked to a hospital�s teaching status or location, although this cannot be verified because the NHDS does not report this information.
13The average in-hospital mortality rate for discharges associated with the 50 most frequent diagnosis groups was 2.0 percent. This compares to an average of 4.2 percent for discharges associated with one of the 50 least frequent diagnosis groups.
NIS-MedPAR Evaluations
As discussed previously, NIS Medicare discharge estimates were higher than MedPAR counts for almost all categories. Inconsistencies were noted for nearly all discharge counts; the overall discrepancy rate was 20 percent. This was also true for earlier years: the difference in 2001 was 21 percent, the difference in 2000 was 22 percent, and in 1999 the figure was 12 percent. The growth from 1999 to 2000 may have been caused by increases in Medicare managed care market penetration, particularly within NIS states, while the slow decline after 2000 reflects a decrease in market penetration in later years.
While there were differences for discharge statistics, other estimates were similar between the two data sources. Most NIS estimates of discharge proportions, ALOS, in-hospital mortality rates, and average total hospital charge were comparable to MedPAR statistics. Mortality rates were quite similar in both years. Comparisons with data from past years, however, did reflect improvement for most of these measures. In particular, estimates of discharge proportions improved in 2002, largely because diagnosis and procedure comparisons were more consistent.
ALOS comparisons again demonstrated fewer differences when compared to previous reports. The overall ALOS statistics were consistent for the 2002 NIS and MedPAR data; this was also true for the 2001 data. These findings for the latest two years demonstrate fewer differences when compared with the 2000 data. The overall NIS Medicare estimate of ALOS in 2000 was significantly shorter in duration than the MedPAR average. For the 2002 data, improvement was also observed for ALOS evaluations across hospital and patient categories, when compared to 2001 data. Finally, average hospital charge comparisons revealed few differences in any year.
Each of the data sources discussed has its strengths and weaknesses, and each may be the preferred choice for different research questions. The NIS offers a large sample that enables study of low incidence disorders and less common procedures; NIS estimates can be calculated for literally thousands of special sub-populations that may be of interest to researchers. In addition, NIS hospitals accurately reflect the universe of United States hospitals, particularly the relative mix of large and small hospitals. So the NIS may be more appropriate when hospital type and size is an important consideration.
The NHDS and MedPAR, however, both offer data drawn from all 50 states, rather than the 35 states that make up the NIS. Where a comprehensive geographic representation is more important than a large sample size, and the question under study requires all age groups, the NHDS might be preferable. In the same situation, if only Medicare clients are of interest, the MedPAR data set might be preferable.
The NIS is not without bias. It does, however, provide a useful data source for answering many research questions. The source of the few differences that do exist between the NIS and NHDS are areas that warrant further investigation. The relationship between hospital size and treatment patterns is an example.
As for which of the data sources discussed is preferable or better, the answer depends on the needs of the researcher. The intended use of the data is the most critical factor in determining which data source will be most valuable. In general, the NIS estimates of variables essential to healthcare policy � including in-hospital mortality, inpatient population size, length of stay, and costs � are accurate and precise. Statistics can be calculated for large groups ranging from the inpatient population of the United States, as well as for small subsets featuring specific conditions. The characteristics documented in this report suggest that the 2002 NIS is a valuable tool for researchers and policy makers alike.
Centers for Medicare & Medicaid Services (2004). Medicare Managed Care Market Penetration for All Medicare Plan Contractors � Quarterly State/County Data Files, June 2002. Washington, DC: CMS. http://www.cms.hhs.gov/
Korn, E. L. & Graubard, B. I. (1999). Analysis of Health Surveys. New York: John Wiley & Sons.
National Center for Health Statistics (2002). National Hospital Discharge Survey Public Use Data File Documentation: 2002. Washington, DC: U.S. Department of Health and Human Services, National Center for Health Statistics.
Spetz, J. & Baker, L. Has Managed Care Affected the Availability of Medical Technology? Public Policy Institute of California, 1999. Accessed December 16, 2004, http://www.ppic.org/. ![]()
U.S. Census Bureau (2004). Annual Estimates of the Population by Sex, Race and Hispanic or Latino Origin for the United States: April 1, 2000 to July 1, 2003. (NC-EST2003-03). Washington, DC: Population Division, U.S. Bureau of the Census.
U.S. Census Bureau (2004). Annual Estimates of the Population for the United States and States, and for Puerto Rico: April 1, 2000 to July 1, 2003. (NST-EST2003-01). Washington, DC: Population Division, U.S. Bureau of the Census.
U.S. Census Bureau (2004). State and Metropolitan Area Data Book � 5th Edition. Washington, DC: U.S. Bureau of the Census.
| Hospital Counts | |||
|---|---|---|---|
| 2002 NIS Frame1(Weighted) | 2002 NIS Frame1(Unweighted) | 2002 AHA Universe | |
| U.S. | 4,840 | 995 | 4,895 |
| Region | |||
| Northeast | 665 | 136 | 665 |
| Midwest | 1,398 | 284 | 1,398 |
| South | 1,867 | 383 | 1,867 |
| West | 910 | 192 | 910 |
| Hospital Control | |||
| Public | 1,126 | 233 | 1,142 |
| Private, Non-Profit | 3,023 | 619 | 2,980 |
| Proprietary | 691 | 143 | 718 |
| Location/Teaching Status | |||
| Rural Hospitals | 2,181 | 448 | 2,181 |
| Urban, Non-Teaching | 1,845 | 379 | 1,845 |
| Urban, Teaching | 814 | 168 | 814 |
Note: All values are from the AHA Annual Survey of Hospitals, based on hospital self-report. Significance tests were not performed because AHA numbers were not sample statistics.
1The 2002 frame contains 35 states.
| AHA Survey Data Element, 2002 | Mean Hospital Values | Median Hospital Values | ||
|---|---|---|---|---|
| NIS Hospitals | Universe | NIS Hospitals | Universe | |
| Hospital Discharges1 | 8,206.18 | 7,822.06 | 4,359.00 | 4,170.00 |
| Average Length of Stay2 | 4.79 | 5.02 | 3.94 | 4.01 |
| Births | 867.41 | 801.66 | 340.00 | 312.00 |
| Percent Medicare Days | 53.72 | 53.98 | 53.95 | 54.40 |
| Percent Medicare Discharges1 | 43.74 | 44.35 | 42.57 | 43.00 |
| Percent Medicaid Days | 14.18 | 14.47 | 11.90 | 12.29 |
| Percent Medicaid Discharges1 | 11.14 | 13.14 | 12.90 | 12.96 |
| Hospital Beds | 155.12 | 152.73 | 92.00 | 93.00 |
| Occupancy Rate | 51.40 | 51.26 | 52.17 | 52.48 |
| Inpatient Surgeries | 2,210.68 | 2,088.29 | 1,075.00 | 1,006.00 |
| FTE3 | 871.86 | 835.77 | 420.00 | 407.00 |
| FTE3 per Bed | 5.27 | 5.15 | 4.83 | 4.74 |
| RN FTE3 per 1000 Patient Days | 3.21 | 3.09 | 2.94 | 2.88 |
| Intern-Resident FTE3 per 100 Beds (Acute Units) | 5.85 | 5.81 | 0.00 | 0.00 |
| Total Hosp. Expenses [dollars] | 88,768,293 | 84,961,548 | 40,176,802 | 37,685,852 |
| Hosp. Expenses/Bed [dollars] | 499,557 | 484,084 | 462,714 | 441,603 |
| Total Hospital Payroll [dollars] | 37,613,544 | 35,382,349 | 16,018,000 | 15,442,607 |
| Hosp. Payroll per Bed [dollars] | 207,894 | 198,998 | 189,293 | 179,077 |
Note: All values are from the AHA Annual Survey of Hospitals, based on hospital self-report. Significance tests were not performed because AHA numbers were not sample statistics.
1Reported discharges adjusted to include "well newborns."
2Reported Inpatient Days divided by discharges adjusted to include "well newborns."
3Full-time equivalents.
| Number of Discharges in Thousands (Standard Error) | Average Length of Stay in Days (Standard Error) | |||
|---|---|---|---|---|
| NIS | AHA | NIS | AHA | |
| Overall | 37,669 (666) |
38,288 | 4.65 (0.03) |
4.53** |
| Region | ||||
| Northeast | 7,476 (288) |
7,476 | 5.30 (0.11) |
5.12 |
| Midwest | 14,387 (433) |
14,387 | 4.62 (0.04) |
4.52* |
| South | 8,650 (319) |
8,784 | 4.40 (0.06) |
4.40 |
| West | 7,155 (266) |
7,155 | 4.31 (0.09) |
4.06** |
Note: All values are from the AHA Annual Survey of Hospitals, based on hospital self-report. AHA discharges and lengths of stay were adjusted to include well newborns.
*Significant at a 5 percent level.
**Significant at a 1 percent level.
| Hospital Control | Number of Discharges in Thousands (Standard Error) | Average Length of Stay in Days (Standard Error) | ||
|---|---|---|---|---|
| NIS | AHA | NIS | AHA | |
| Public | ||||
| Total | 5,146 (538) |
5,190 | 5.01 (0.15) |
4.73 |
| 1-99 Beds | 1,133 (81) |
1,156 | 3.74 (0.10) |
3.96* |
| 100-199 Beds | 633 (101) |
866* | 4.44 (0.20) |
4.24 |
| 200-299 Beds | 617 (194) |
701 | 4.91 (0.30) |
4.47 |
| 300-499 Beds | 1,283 (222) |
1,297 | 5.36 (0.25) |
5.13 |
| 500+ Beds | 1,477 (299) |
1,167 | 5.96 (0.32) |
5.56 |
| Private Non-Profit | ||||
| Total | 27,946 (873) |
27,879 | 4.62 (0.04) |
4.51* |
| 1-99 Beds | 2,662 (133) | 2,675 | 3.71 (0.06) |
3.85* |
| 100-199 Beds | 5,574 (330) |
5,212 | 4.29 (0.07) |
4.17 |
| 200-299 Beds | 4,688 (459) |
5,601* | 4.54 (0.09) |
4.43 |
| 300-499 Beds | 8,670 (710) |
7,721 | 4.77 (0.07) |
4.54** |
| 500+ Beds | 6,351 (755) |
6,668 | 5.13 (0.10) |
5.08 |
| Proprietary | ||||
| Total | 4,577 (357) |
4,733 | 4.42 (0.09) |
4.38 |
| 1-99 Beds | 646 (78) |
694 | 4.07 (0.26) |
4.18 |
| 100-199 Beds | 1,638 (135) |
1,633 | 4.08 (0.08) |
4.16 |
| 200-299 Beds | 1,192 (193) |
1,145 | 4.58 (0.15) |
4.39 |
| 300-499 Beds | 768 (171) |
830 | 4.73 (0.10) |
4.62 |
| 500+ Beds | 331 (10) |
429** | 5.40 (0.01) |
5.03** |
Note: All values are from the AHA Annual Survey of Hospitals, based on hospital self-report. AHA discharges and lengths of stay were adjusted to include well newborns.
*Significant at a 5 percent level.
**Significant at a 1 percent level.
| Number of Discharges in Thousands (Standard Error) | Average Length of Stay in Days (Standard Error) | |||
|---|---|---|---|---|
| NIS | AHA | NIS | AHA | |
| Location/Teaching Status | ||||
| Rural - Total | 5,772 (226) |
5,811 | 3.93 (0.04) |
4.08** |
| 1-49 beds | 1,302 (59) |
1,291 | 3.48 (0.07) |
3.71** |
| 50-99 beds | 1,482 (123) |
1,537 | 3.72 (0.07) |
3.87* |
| 100+ beds | 2,987 (265) |
2,982 | 4.22 (0.07) |
4.35 |
| Urban, Non-Teaching - Total | 15,428 (388) |
15,428 | 4.46 (0.04) |
4.34** |
| 1-99 beds | 1,605 (122) |
1,619 | 4.02 (0.14) |
4.08 |
| 100-199 beds | 4,718 (244) |
4,633 | 4.22 (0.06) |
4.10 |
| 200+ beds | 9,103 (398) |
9,175 | 4.66 (0.06) |
4.51* |
| Urban, Teaching - Total | 16,468 (491) |
16,564 | 5.08 (0.07) |
4.85** |
| 1-299 beds | 2,662 (323) |
2,543 | 4.72 (0.18) |
4.51 |
| 300-499 beds | 4,487 (562) |
4,528 | 5.03 (0.13) |
4.74* |
| 500+ beds | 9,318 (790) |
9,492 | 5.20 (0.10) |
4.99* |
Note: All values are from the AHA Annual Survey of Hospitals, based on hospital self-report. AHA discharges and lengths of stay were adjusted to include well newborns.
*Significant at a 5 percent level.
**Significant at a 1 percent level.
| NIS Hospitals | Non-NIS Hospitals | |
|---|---|---|
| Technology and Resource Intensive Units or Services | ||
| High Tech Index (mean) | 2.91 | 2.83 |
| High Tech Index (median) | 2.00 | 2.00 |
| Percent with Unit or Service | ||
| Neonatal ICU1 | 17.99 | 18.08 |
| Cardiac Catheterization Unit1 | 34.67 | 34.08 |
| CT Scanner1 | 79.90 | 75.92 |
| MRI1 | 50.55 | 50.28 |
| Open Heart Surgery Unit1 | 19.10 | 19.77 |
| Transplant Service1 | 7.64 | 8.10 |
| X-Ray Radiation Therapy Unit1 | 24.02 | 23.54 |
| Extracorporeal Shock Wave Lithotripsy1 | 20.00 | 18.49 |
| Coronary Angioplasty Unit1 | 24.22 | 23.85 |
| PET Scanner1 | 12.66 | 11.18 |
| Pediatric Specialty Hospital | 1.21 | 1.69 |
| Rehabilitation Unit | 22.21 | 23.15 |
| Alcohol/Chemical Dependency Services | 10.25 | 8.74 |
| Trauma Center | 29.65 | 28.69 |
| Emergency Department | 81.91 | 79.13 |
Note: All values are from the AHA Annual Survey of Hospitals, based on hospital self-report. Significance tests were not performed because AHA numbers were not sample statistics.
1High technology service � used in the High Tech Index.
| Number of Discharges in Thousands (Standard Error) | Average Length of Stay in Days (Standard Error) | In-Hospital Mortality Rate Percent (Standard Error) | ||||
|---|---|---|---|---|---|---|
| NIS | NHDS | NIS | NHDS | NIS | NHDS | |
| United States | 37,669 (666) |
37,515 (1,519) |
4.63 (0.03) |
4.68 (0.30) |
2.24 (0.03) |
2.19 (0.12) |
| Region | ||||||
| Northeast | 7,476 (288) |
7,714 (626) |
5.28 (0.11) |
5.411 (b) |
2.48 (0.08) |
2.39 (0.27) |
| Midwest | 14,387 (433) |
14,348 (732) |
4.61 (0.04) |
4.72 (0.39) |
2.32 (0.05) |
2.18 (0.15) |
| South | 8,650 (319) |
8,267 (794) |
4.38 (0.06) |
4.261 (b) |
2.05 (0.06) |
2.04 (0.27) |
| West | 7,155 (266) |
7,185 (579) |
4.29 (0.09) |
4.28 (0.53) |
2.04 (0.06) |
2.17 (0.24) |
*Significant at a 5 percent level.
**Significant at a 1 percent level.
1A significance test was not performed because a valid standard error was not available for one of the following reasons:
(a) Because of a limited sample, the NHDS estimate and standard error were unreliable and not reported.
(b) A valid standard error could not be calculated. Refer to Appendix D for details.
| Hospital Control/Size | Number of Discharges in Thousands (Standard Error) | Average Length of Stay in Days (Standard Error) | In-Hospital Mortality Rate Percent (Standard Error) | |||
|---|---|---|---|---|---|---|
| NIS | NHDS | NIS | NHDS | NIS | NHDS | |
| Total Public | 5,146 (538) |
4,628 (191) |
4.99 (0.14) |
4.67 (0.30) |
2.17 (0.08) |
2.03 (0.11) |
| 1-99 Beds | 1,133 (81) |
1,236 (54) |
3.71 (0.10) |
3.31 (0.22) |
2.44 (0.09) |
1.44** (0.08) |
| 100-199 Beds | 633 (101) |
893* (40) |
4.42 (0.20) |
4.34 (0.30) |
2.20 (0.16) |
2.67 (0.17) |
| 200-299 Beds | 617 (194) |
501 (24) |
4.90 (0.29) |
4.47 (0.32) |
2.21 (0.25) |
2.43 (0.16) |
| 300-499 Beds | 1,283 (222) |
1,359 (59) |
5.35 (0.25) |
5.46 (0.36) |
2.12 (0.17) |
2.12 (0.13) |
| 500+ Beds | 1,477 (299) |
636** (29) |
5.94 (0.32) |
6.24 (0.44) |
1.99 (0.18) |
1.75 (0.11) |
| Total Private Non-Profit | 27,946 (873) |
27,933 (1,132) |
4.60 (0.04) |
4.65 (0.29) |
2.25 (0.03) |
2.21 (0.12) |
| 1-99 Beds | 2,662 (133) |
6,008** (247) |
3.69 (0.06) |
4.08 (0.26) |
2.15 (0.06) |
2.07 (0.12) |
| 100-199 Beds | 5,574 (330) |
6,717** (275) |
4.27 (0.07) |
4.58 (0.29) |
2.25 (0.07) |
2.20 (0.12) |
| 200-299 Beds | 4,688 (459) |
6,122** (251) |
4.52 (0.09) |
4.70 (0.30) |
2.18 (0.08) |
2.33 (0.13) |
| 300-499 Beds | 8,670 (710) |
6,072** (249) |
4.75 (0.07) |
4.93 (0.31) |
2.30 (0.06) |
2.19 (0.12) |
| 500+ Beds | 6,351 (755) |
3,012** (126) |
5.12 (0.10) |
5.30 (0.34) |
2.26 (0.10) |
2.29 (0.13) |
| Total Proprietary | 4,577 (357) |
4,953 (204) |
4.39 (0.09) |
4.82 (0.31) |
2.26 (0.09) |
2.22 (0.13) |
| 1-99 Beds | 646 (78) |
1,395** (60) |
4.04 (0.26) |
4.83 (0.32) |
2.05 (0.15) |
1.98 (0.12) |
| 100-199 Beds | 1,638 (135) |
1,792 (76) |
4.06 (0.08) |
4.70 (0.31) |
2.11 (0.09) |
2.12 (0.12) |
| 200-299 Beds | 1,192 (193) |
826 (37) |
4.57 (0.15) |
4.91 (0.34) |
2.19 (0.10) |
1.86* (0.11) |
| 300-499 Beds | 768 (171) |
938 (42) |
4.70 (0.10) |
4.95 (0.34) |
2.79 (0.36) |
3.11 (0.19) |
| 500+ Beds | 331 (10) |
01 (a) |
5.39 (0.01) |
0.001 (a) |
2.36 (0.14) |
0.001 (a) |
*Significant at a 5 percent level.
**Significant at a 1 percent level.
1A significance test was not performed because a valid standard error was not available for one of the following reasons:
(a) Because of a limited sample, the NHDS estimate and standard error were unreliable and not reported.
(b) A valid standard error could not be calculated. Refer to Appendix D for details.
| Number of Discharges in Thousands (Standard Error) | Average Length of Stay in Days (Standard Error) | In-Hospital Mortality Rate Percent (Standard Error) | ||||
|---|---|---|---|---|---|---|
| NIS | NHDS | NIS | NHDS | NIS | NHDS | |
| Age Group | ||||||
| 0-15 Years | 6,063 (206) |
6,500 (266) |
3.49 (0.08) |
3.75 (0.24) |
0.39 (0.02) |
0.45 (0.02) |
| 16-44 Years | 10,463 (227) |
10,565 (431) |
3.63 (0.05) |
3.69 (0.23) |
0.44 (0.01) |
0.43 (0.02) |
| 45-64 Years | 7,998 (157) |
7,723 (316) |
4.93 (0.05) |
4.93 (0.31) |
1.91 (0.03) |
1.88 (0.10) |
| 65+ Years | 13,139 (284) |
12,727 (518) |
5.76 (0.04) |
5.81 (0.37) |
4.73 (0.05) |
4.73 (0.27) |
| Sex | ||||||
| Female | 22,319 (409) |
22,187 (900) |
4.40 (0.03) |
4.44 (0.28) |
1.91 (0.02) |
1.88 (0.10) |
| Male | 15,345 (274) |
15,328 (623) |
4.95 (0.04) |
5.02 (0.32) |
2.71 (0.03) |
2.63 (0.15) |
| Race | ||||||
| White | 17,915 (667) |
22,865** (1,301) |
4.74 (0.04) |
4.68 (0.40) |
2.58 (0.04) |
2.33 (0.18) |
| Black | 3,849 (276) |
4,415 (319) |
5.41 (0.10) |
5.20 (0.60) |
2.15 (0.06) |
1.95 (0.19) |
| Other | 5,123 (358) |
1,503** (213) |
4.35 (0.09) |
4.861 (b) |
1.45 (0.05) |
2.211 (b) |
| Unknown | 10,781 (711) |
8,731 (1,291) |
4.30 (0.06) |
4.371 (b) |
2.08 (0.04) |
1.941 (b) |
| Principal Payer | ||||||
| Medicare | 13,852 (296) |
13,191 (582) |
5.82 (0.04) |
5.88 (0.41) |
4.28 (0.04) |
4.30 (0.26) |
| Medicaid | 6,554 (244) |
6,232 (448) |
4.38 (0.09) |
4.46 (0.52) |
0.92 (0.02) |
0.94 (0.09) |
| Private Insurance | 14,217 (416) |
14,243 (975) |
3.69 (0.03) |
3.78 (0.40) |
1.00 (0.02) |
1.00 (0.09) |
| Self Pay | 1,716 (154) |
1,602 (76) |
3.92 (0.09) |
3.77 (0.33) |
1.45 (0.05) |
1.30 (0.08) |
| No Charge | 127 (41) |
107 (19) |
5.11 (0.31) |
4.961 (b) |
1.17 (0.16) |
2.391 (b) |
| Other | 1,151 (81) |
2,138* (380) |
4.29 (0.10) |
4.521 (b) |
1.85 (0.21) |
1.401 (b) |
*Significant at a 5 percent level.
**Significant at a 1 percent level.
1A significance test was not performed because a valid standard error was not available for one of the following reasons:
(a) Because of a limited sample, the NHDS estimate and standard error were unreliable and not reported.
(b) A valid standard error could not be calculated. Refer to Appendix D for details.
| Number of Discharges in Thousands (Standard Error) | Average Length of Stay in Days (Standard Error) | In-Hospital Mortality Rate Percent (Standard Error) | ||||
|---|---|---|---|---|---|---|
| NIS | NHDS | NIS | NHDS | NIS | NHDS | |
| Principal Diagnosis | ||||||
| 218: Liveborn | 4,141 (134) |
3,799 (157) |
3.12 (0.05) |
3.23 (0.21) |
0.33 (0.01) |
0.29 (0.01) |
| 101: Coronary atherosclerosis and other heart disease | 1,289 (57) |
1,272 (55) |
3.63 (0.05) |
3.34 (0.22) |
0.70 (0.02) |
0.91** (0.05) |
| 122: Pneumonia (except that caused by tuberculosis or sexually transmitted disease) | 1,266 (22) |
1,327 (57) |
5.80 (0.04) |
5.80 (0.39) |
5.58 (0.08) |
5.42 (0.33) |
| 108: Congestive heart failure, nonhypertensive | 1,054 (23) |
999 (44) |
5.57 (0.05) |
5.41 (0.37) |
4.40 (0.07) |
3.69** (0.23) |
| 102: Nonspecific chest pain | 882 (26) |
64** (5) |
1.85 (0.02) |
1.341 (b) |
0.05 (0.00) |
0.05 (0.00) |
| 193: Trauma to perineum and vulva | 802 (31) |
--1 (a) |
2.00 (0.01) |
--1 (a) |
0.00 (0.00) |
--1 (a) |
| 100: Acute myocardial infarction | 761 (25) |
817 (37) |
5.42 (0.07) |
5.57 (0.38) |
7.83 (0.13) |
8.19 (0.52) |
| 106: Cardiac dysrhythmias | 710 (20) |
767 (35) |
3.62 (0.03) |
3.54 (0.25) |
1.23 (0.03) |
1.17 (0.07) |
| 195: Other complications of birth, puerperium affecting management of mother | 691 (25) |
59** (5) |
2.62 (0.02) |
3.31 (0.42) |
0.02 (0.00) |
0.63** (0.07) |
| 69: Affective disorders | 651 (37) |
991** (44) |
7.93 (0.23) |
7.36 (0.50) |
0.04 (0.00) |
0.07** (0.00) |
| 205: Spondylosis, intervertebral disc disorders, other back problems | 631 (23) |
602 (28) |
3.12 (0.04) |
3.05 (0.22) |
0.18 (0.01) |
0.13** (0.00) |
| 127: Chronic obstructive pulmonary disease and bronchiectasis | 617 (13) |
673 (31) |
5.10 (0.04) |
5.14 (0.36) |
2.65 (0.06) |
2.45 (0.16) |
| 55: Fluid and electrolyte disorders | 590 (12) |
709** (32) |
4.10 (0.04) |
3.72 (0.26) |
2.88 (0.08) |
2.66 (0.17) |
| 237: Complication of device, implant or graft | 587 (21) |
527 (25) |
5.70 (0.06) |
5.91 (0.42) |
1.90 (0.05) |
1.34** (0.09) |
| 109: Acute cerebrovascular disease | 562 (12) |
548 (26) |
6.42 (0.08) |
6.49 (0.46) |
10.75 (0.16) |
10.79 (0.73) |
| 203: Osteoarthritis | 549 (20) |
568 (27) |
4.07 (0.03) |
4.17 (0.30) |
0.15 (0.01) |
0.29** (0.01) |
| 254: Rehabilitation care, fitting of prostheses, and adjustment of devices | 480 (32) |
521 (25) |
12.35 (0.26) |
11.85 (0.83) |
0.57 (0.06) |
0.32** (0.02) |
| 149: Biliary tract disease | 469 (10) |
458 (22) |
4.19 (0.03) |
4.17 (0.31) |
0.85 (0.03) |
0.97 (0.06) |
| 50: Diabetes mellitus with complications | 466 (9) |
489 (23) |
5.49 (0.05) |
5.41 (0.39) |
1.29 (0.04) |
1.89** (0.13) |
| 159: Urinary tract infections | 454 (9) |
519* (25) |
4.58 (0.04) |
4.67 (0.34) |
1.63 (0.05) |
1.59 (0.10) |
| 181: Other complications of pregnancy | 449 (14) |
224** (12) |
2.45 (0.02) |
2.61 (0.23) |
0.03 (0.00) |
0.00** (0.00) |
| 238: Complications of surgical procedures or medical care | 434 (11) |
411 (20) |
6.20 (0.06) |
6.13 (0.45) |
1.56 (0.05) |
1.41 (0.10) |
| 197: Skin and subcutaneous tissue infections | 425 (10) |
434 (21) |
4.89 (0.04) |
5.13 (0.38) |
0.54 (0.02) |
0.22** (0.01) |
| 128: Asthma | 403 (15) |
483** (23) |
3.34 (0.03) |
3.13 (0.23) |
0.33 (0.02) |
0.33 (0.02) |
| 196: Normal pregnancy and/or delivery | 400 (16) |
3,963** (164) |
1.95 (0.02) |
2.57** (0.16) |
0.00 (0.00) |
0.00 (0.00) |
*Significant at a 5 percent level.
**Significant at a 1 percent level.
1A significance test was not performed because a valid standard error was not available for one of the following reasons:
(a) Because of a limited sample, the NHDS estimate and standard error were unreliable and not reported.
(b) A valid standard error could not be calculated. Refer to Appendix D for details.
| Number of Discharges in Thousands (Standard Error) | Average Length of Stay in Days (Standard Error) | In-Hospital Mortality Rate Percent (Standard Error) | ||||
|---|---|---|---|---|---|---|
| NIS | NHDS | NIS | NHDS | NIS | NHDS | |
| Principal Procedure | ||||||
| 137: Other procedures to assist delivery | 1,402 (61) |
978** (43) |
2.11 (0.01) |
2.19 (0.15) |
0.00 (0.00) |
0.00 (0.00) |
| 115: Circumcision | 1,158 (47) |
1,098 (48) |
2.56 (0.02) |
2.62 (0.18) |
0.00 (0.00) |
0.00 (0.00) |
| 134: Cesarean section | 1,096 (38) |
1,051 (46) |
3.70 (0.03) |
3.70 (0.25) |
0.02 (0.00) |
0.00** (0.00) |
| 140: Repair of current obstetric laceration | 697 (35) |
776 (35) |
2.09 (0.01) |
2.07 (0.15) |
0.00 (0.00) |
0.00 (0.00) |
| 47: Diagnostic cardiac catheterization, coronary arteriography | 695 (32) |
594* (28) |
3.68 (0.06) |
4.05 (0.29) |
0.89 (0.03) |
1.39** (0.09) |
| 45: Percutaneous transluminal coronary angioplasty (PTCA) | 691 (47) |
594 (28) |
2.82 (0.05) |
2.88 (0.21) |
0.80 (0.03) |
0.57** (0.03) |
| 70: Upper gastrointestinal endoscopy, biopsy | 690 (16) |
661 (30) |
5.47 (0.04) |
5.60 (0.39) |
1.73 (0.04) |
1.95 (0.12) |
| 124: Hysterectomy, abdominal and vaginal | 639 (19) |
647 (30) |
2.78 (0.02) |
2.64 (0.19) |
0.07 (0.00) |
0.01** (0.00) |
| 216: Respiratory intubation and mechanical ventilation | 584 (14) |
578 (27) |
10.79 (0.21) |
11.43 (0.80) |
29.30 (0.44) |
28.11 (1.88) |
| 228: Prophylactic vaccinations and inoculations | 523 (65) |
512 (24) |
2.40 (0.04) |
2.38 (0.18) |
0.00 (0.00) |
0.00 (0.00) |
| 222: Blood transfusion | 453 (17) |
437 (21) |
5.86 (0.06) |
5.77 (0.42) |
5.90 (0.12) |
5.60 (0.39) |
| 133: Episiotomy | 416 (22) |
464 (22) |
2.14 (0.01) |
2.13 (0.16) |
0.00 (0.00) |
0.00 (0.00) |
| 54: Other vascular catheterization, not heart | 415 (25) |
376 (19) |
9.31 (0.32) |
10.40 (0.76) |
9.12 (0.39) |
8.20 (0.59) |
| 84: Cholecystectomy and common duct exploration | 406 (10) |
372 (19) |
4.57 (0.04) |
4.66 (0.35) |
0.79 (0.03) |
0.95* (0.06) |
| 152: Arthroplasty knee | 397 (15) |
416 (20) |
4.04 (0.03) |
4.17 (0.31) |
0.13 (0.01) |
0.36** (0.02) |
| 231: Other therapeutic procedures | 383 (32) |
467* (22) |
5.25 (0.14) |
5.04 (0.36) |
2.19 (0.15) |
1.89 (0.13) |
| 153: Hip replacement, total and partial | 341 (12) |
339 (17) |
5.20 (0.05) |
5.35 (0.40) |
1.15 (0.05) |
1.30 (0.09) |
| 219: Alcohol and drug rehabilitation/detoxification | 323 (36) |
326 (17) |
5.11 (0.25) |
5.82 (0.44) |
0.11 (0.01) |
0.10 (0.00) |
| 44: Coronary artery bypass graft (CABG) | 315 (20) |
258* (14) |
8.83 (0.11) |
8.71 (0.67) |
2.30 (0.08) |
3.18** (0.24) |
| 48: Insertion, revision, replacement, removal of cardiac pacemaker or cardioverter/defibrillator | 293 (14) |
248* (13) |
5.22 (0.08) |
5.12 (0.41) |
1.43 (0.06) |
1.71 (0.13) |
| 80: Appendectomy | 291 (7) |
300 (15) |
2.98 (0.02) |
3.14 (0.25) |
0.13 (0.01) |
0.42** (0.03) |
| 78: Colorectal resection | 280 (7) |
271 (14) |
10.03 (0.07) |
10.25 (0.78) |
4.18 (0.10) |
3.06** (0.23) |
| 3: Laminectomy, excision intervertebral disc | 279 (12) |
264 (14) |
2.74 (0.05) |
2.74 (0.23) |
0.16 (0.01) |
0.17 (0.01) |
| 76: Colonoscopy and biopsy | 277 (7) |
277 (15) |
5.61 (0.05) |
5.82 (0.45) |
1.05 (0.05) |
0.58** (0.04) |
| 158: Spinal fusion | 276 (14) |
250 (13) |
3.98 (0.07) |
4.02 (0.33) |
0.26 (0.02) |
0.50** (0.03) |
*Significant at a 5 percent level.
**Significant at a 1 percent level.
| Number of Discharges in Thousands (Standard Error) | Percentage of Discharges (Standard Error) | Average Length of Stay in Days (Standard Error) | In-Hospital Mortality Rate Percent (Standard Error) | Average Total Hospital Charge (Standard Error) | ||||||
|---|---|---|---|---|---|---|---|---|---|---|
| NIS | MedPAR | NIS | MedPAR | NIS | MedPAR | NIS | MedPAR | NIS | MedPAR | |
| U.S. | 13,852 (295) |
11,562** | -- | -- | 5.83 (0.04) |
5.88 | 4.28 (0.04) |
4.25 | $21,714 (577) |
$21,474 |
| Northeast | 2,946 (151) |
2,201** | 21.27 (0.94) |
19.03* | 6.51 (0.14) |
6.72 | 4.64 (0.12) |
4.74 | $24,405 (2,035) |
$25,233 |
| Midwest | 5,435 (178) |
4,710** | 39.23 (1.02) |
40.74 | 5.76 (0.06) |
5.83 | 4.31 (0.07) |
4.28 | $19,341 (518) |
$19,710 |
| South | 3,305 (145) |
3,114 | 23.86 (0.91) |
26.93** | 5.46 (0.07) |
5.53 | 3.83 (0.08) |
3.86 | $17,757 (532) |
$17,658 |
| West | 2,164 (106) |
1,536** | 15.62 (0.72) |
13.28** | 5.67 (0.13) |
5.57 | 4.43 (0.10) |
4.21* | $30,882 (1,760) |
$29,232 |
*Significant at a 5 percent level.
**Significant at a 1 percent level.
| Number of Discharges in Thousands (Standard Error) | Percentage of Discharges (Standard Error) | Average Length of Stay in Days (Standard Error) | In-Hospital Mortality Rate Percent (Standard Error) | Average Total Hospital Charge (Standard Error) | ||||||
|---|---|---|---|---|---|---|---|---|---|---|
| NIS | MedPAR | NIS | MedPAR | NIS | MedPAR | NIS | MedPAR | NIS | MedPAR | |
| Control/Bed Size | ||||||||||
| Total Public | 1,612 (124) |
1,440 | 11.63 (0.96) |
12.46 | 5.90 (0.14) |
5.75 | 4.37 (0.10) |
4.28 | $16,475 (838) |
$17,370 |
| 1-99 Beds | 528 (31) |
422** | 32.80 (2.30) |
29.32 | 4.52 (0.09) |
4.56 | 4.27 (0.12) |
4.02* | $8,511 (318) |
$8,860 |
| 100-199 Beds | 248 (43) |
305 | 15.41 (2.55) |
21.20* | 5.80 (0.27) |
5.61 | 4.21 (0.29) |
4.38 | $14,850 (783) |
$14,597 |
| 200-299 Beds | 216 (71) |
199 | 13.43 (4.21) |
13.85 | 6.26 (0.33) |
6.11 | 4.52 (0.22) |
4.37 | $15,511 (1,383) |
$18,709* |
| 300-499 Beds | 342 (66) |
284 | 21.27 (4.23) |
19.76 | 6.44 (0.26) |
6.59 | 4.33 (0.24) |
4.41 | $23,679 (1,809) |
$26,016 |
| 500+ Beds | 275 (67) |
228 | 17.06 (3.97) |
15.85 | 7.66 (0.41) |
6.78* | 4.63 (0.33) |
4.37 | $25,358 (2,056) |
$24,872 |
| Total Private Non-Profit | 10,471 (335) |
8,660** | 75.59( 1.33) |
74.90 | 5.83 (0.05) |
5.90 | 4.30 (0.05) |
4.28 | $21,465 (727) |
$20,884 |
| 1-99 Beds | 1,145 (54) |
964** | 10.93 (0.58) |
11.13 | 4.73 (0.09) |
4.65 | 4.11 (0.10) |
3.88* | $11,894 (503) |
$11,364 |
| 100-199 Beds | 2,261 (135) |
1,777** | 21.60 (1.27) |
20.52 | 5.51 (0.08) |
5.56 | 4.28 (0.09) |
4.29 | $15,458 (720) |
$16,333 |
| 200-299 Beds | 1,727 (182) |
1,790 | 16.49 (1.77) |
20.67* | 5.78 (0.12) |
5.95 | 4.27 (0.10) |
4.31 | $20,749 (1,084) |
$20,655 |
| 300-499 Beds | 3,130 (282) |
2,346** | 29.89 (2.61) |
27.09 | 6.07 (0.09) |
6.11 | 4.38 (0.10) |
4.35 | $24,038 (1,343) |
$23,065 |
| 500+ Beds | 2,205 (277) |
1,781 | 21.06 (2.41) |
20.56 | 6.45 (0.18) |
6.58 | 4.32 (0.18) |
4.37 | $29,190 (2,336) |
$27,938 |
| Total Proprietary | 1,768 (135) |
1,461* | 12.76 (0.96) |
12.63 | 5.79 (0.12) |
5.91 | 4.13 (0.11) |
4.01 | $27,898 (1,312) |
$29,015 |
| 1-99 Beds | 264 (32) |
232 | 14.95 (1.79) |
15.92 | 5.24 (0.35) |
4.76 | 3.78 (0.18) |
3.45 | $21,469 (2,666) |
$16,844 |
| 100-199 Beds | 591 (49) |
528 | 33.45 (2.75) |
36.17 | 5.61 (0.12) |
5.88* | 4.09 (0.13) |
4.04 | $26,834 (1,798) |
$25,552 |
| 200-299 Beds | 458 (77) |
362 | 25.93 (4.40) |
24.81 | 6.08 (0.23) |
6.13 | 4.34 (0.21) |
4.21 | $31,366 (4,012) |
$34,364 |
| 300-499 Beds | 338 (91) |
226 | 19.12 (4.73) |
15.49 | 5.63 (0.19) |
6.42** | 3.98 (0.31) |
4.23 | $27,504 (1,506) |
$39,297** |
| 500+ Beds | 115 (5) |
110 | 6.53 (0.42) |
7.58* | 7.31 (0.30) |
6.71* | 4.69 (0.00) |
4.00** | $35,417 (29) |
$32,586** |
*Significant at a 5 percent level.
**Significant at a 1 percent level.
| Number of Discharges in Thousands (Standard Error) | Percentage of Discharges (Standard Error) | Average Length of Stay in Days (Standard Error) | In-Hospital Mortality Rate Percent (Standard Error) | Average Total Hospital Charge (Standard Error) | ||||||
|---|---|---|---|---|---|---|---|---|---|---|
| NIS | MedPAR | NIS | MedPAR | NIS | MedPAR | NIS | MedPAR | NIS | MedPAR | |
| Hospital Type / Size | ||||||||||
| Rural | 2,600 (94) |
2,337** | 18.77 (0.67) |
20.21* | 4.91 (0.05) |
4.99 | 4.18 (0.06) |
4.06 | $11,385 (280) |
$11,888 |
| 1-49 beds | 655 (27) |
450** | 25.19 (1.30) |
19.26** | 4.14 (0.06) |
4.18 | 4.04 (0.10) |
3.68** | $7,987 (255) |
$8,194 |
| 50-99 beds | 648 (52) |
651 | 24.92 (2.33) |
27.88 | 4.74 (0.08) |
4.67 | 4.08 (0.11) |
4.01 | $11,346 (480) |
$10,690 |
| 100+ beds | 1,297 (112) |
1,235 | 49.87 (2.84) |
52.84 | 5.38 (0.08) |
5.46 | 4.30 (0.11) |
4.22 | $13,119 (467) |
$13,867 |
| Urban, Non-Teaching | 6,083 (181) |
4,868** | 43.92 (1.04) |
42.10 | 5.80 (0.06) |
5.86 | 4.32 (0.06) |
4.26 | $22,788 (824) |
$22,637 |
| 1-99 beds | 619 (45) |
501* | 10.17 (0.77) |
10.29 | 5.39 (0.22) |
4.98 | 4.26 (0.17) |
3.88* | $17,560 (1,440) |
$15,266 |
| 100-199 beds | 1,758 (91) |
1,499** | 28.90 (1.58) |
30.80 | 5.62 (0.08) |
5.79* | 4.28 (0.10) |
4.33 | $19,952 (933) |
$20,140 |
| 200+ beds | 3,706 (181) |
2,867** | 60.92 (1.65) |
58.89 | 5.95 (0.08) |
6.05 | 4.35 (0.09) |
4.30 | $24,945 (1,254) |
$25,232 |
| Urban, Teaching | 5,167 (212) |
4,356** | 37.30 (1.11) |
37.68 | 6.35 (0.10) |
6.38 | 4.30 (0.09) |
4.33 | $25,786 (1,163) |
$25,315 |
| 1-299 beds | 883 (122) |
633* | 17.09 (2.29) |
14.54 | 5.88 (0.21) |
6.09 | 4.19 (0.16) |
4.27 | $19,712 (1,630) |
$23,678* |
| 300-499 beds | 1,479 (202) |
1,181 | 28.63 (4.02) |
27.11 | 6.25 (0.15) |
6.29 | 4.19 (0.15) |
4.29 | $25,785 (2,507) |
$23,815 |
| 500+ beds | 2,804 (266) |
2,541 | 54.26 (4.15) |
58.34 | 6.54 (0.15) |
6.50 | 4.39 (0.14) |
4.36 | $27,573 (1,555) |
$26,421 |
*Significant at a 5 percent level.
**Significant at a 1 percent level.
| Number of Discharges in Thousands (Standard Error) | Percentage of Discharges (Standard Error) | Average Length of Stay in Days (Standard Error) | In-Hospital Mortality Rate Percent (Standard Error) | Average Total Hospital Charge (Standard Error) | ||||||
|---|---|---|---|---|---|---|---|---|---|---|
| NIS | MedPAR | NIS | MedPAR | NIS | MedPAR | NIS | MedPAR | NIS | MedPAR | |
| Race | ||||||||||
| White | 7,911 (305) |
9,669** | 57.11 (1.63) |
83.63** | 5.83 (0.05) |
5.74 | 4.41 (0.06) |
4.28* | $22,467 (775) |
$20,933* |
| Black | 1,136 (89) |
1,360* | 8.20 (0.62) |
11.76** | 6.91 (0.13) |
6.73 | 4.31 (0.12) |
4.17 | $24,846 (1,654) |
$23,000 |
| Other | 924 (77) |
485** | 6.67 (0.56) |
4.20** | 6.54 (0.12) |
6.32 | 4.33 (0.10) |
3.83** | $31,497 (1,816) |
$28,013 |
| Unknown | 3,880 (258) |
46** | 28.01 (1.83) |
0.40** | 5.36 (0.07) |
5.73** | 4.01 (0.07) |
3.66** | $17,080 (510) |
$20,824** |
| Age Group | ||||||||||
| 0-64 Years | 2,038 (50) |
1,860** | 14.71 (0.29) |
16.08** | 6.19 (0.08) |
6.18 | 2.17 (0.04) |
2.13 | $21,108 (525) |
$21,352 |
| 65-74 Years | 4,251 (96) |
3,475** | 30.69 (0.17) |
30.05** | 5.52 (0.04) |
5.59 | 3.27 (0.04) |
3.37* | $23,248 (559) |
$23,102 |
| 75-84 Years | 5,053 (120) |
4,046** | 36.48 (0.19) |
34.99** | 5.89 (0.04) |
5.92 | 4.61 (0.05) |
4.49* | $22,217 (644) |
$21,813 |
| 85+ Years | 2,508 (59) |
2,180** | 18.10 (0.17) |
18.85** | 5.96 (0.05) |
6.02 | 7.08 (0.08) |
6.99 | $18,617 (656) |
$18,351 |
| Sex | ||||||||||
| Female | 7,905 (166) |
6,565** | 57.06 (0.17) |
56.78 | 5.82 (0.04) |
5.87 | 3.98 (0.04) |
3.95 | $20,415 (551) |
$20,201 |
| Male | 5,946 (133) |
4,996** | 42.92 (0.17) |
43.21 | 5.86 (0.04) |
5.90 | 4.69 (0.05) |
4.63 | $23,447 (621) |
$23,145 |
*Significant at a 5 percent level.
**Significant at a 1 percent level.
| Number of Discharges in Thousands (Standard Error) | Percentage of Discharges (Standard Error) | Average Length of Stay in Days (Standard Error) | In-Hospital Mortality Rate Percent (Standard Error) | Average Total Hospital Charge (Standard Error) | ||||||
|---|---|---|---|---|---|---|---|---|---|---|
| NIS | MedPAR | NIS | MedPAR | NIS | MedPAR | NIS | MedPAR | NIS | MedPAR | |
| DRG | ||||||||||
| 127: heart failure & shock | 775 (17) |
627** | 5.59 (0.06) |
5.42** | 5.14 (0.04) |
5.20 | 4.38 (0.07) |
4.49 | $15,547 (635) |
$15,015 |
| 89: simple pneumonia & pleurisy age >17 w/CC | 596 (12) |
499** | 4.30 (0.05) |
4.32 | 5.70 (0.04) |
5.79* | 5.80 (0.10) |
5.85 | $15,149 (430) |
$14,894 |
| 88: chronic obstructive pulmonary disease | 452 (10) |
375** | 3.26 (0.05) |
3.25 | 4.95 (0.03) |
5.00 | 1.96 (0.05) |
1.88 | $13,412 (427) |
$12,948 |
| 209: major joint & limb reattachment procedures of lower extremity | 437 (15) |
376** | 3.16 (0.08) |
3.25 | 4.81 (0.04) |
4.84 | 0.85 (0.03) |
0.85 | $29,143 (574) |
$28,833 |
| 462: rehabilitation | 338 (23) |
270** | 2.44 (0.16) |
2.34 | 11.79 (0.21) |
11.94 | 0.63 (0.06) |
0.27** | $19,745 (830) |
$20,996 |
| 14: specific cerebrovascular disorders except tia | 337 (7) |
276** | 2.43 (0.02) |
2.39 | 5.72 (0.06) |
5.77 | 11.08 (0.18) |
11.10 | $18,429 (611) |
$17,674 |
| 430: psychoses | 313 (17) |
306 | 2.26 (0.12) |
2.65** | 11.31 (0.34) |
10.85 | 0.10 (0.01) |
0.12 | $16,058 (727) |
$15,406 |
| 296: nutritional & misc metabolic disorders age >17 w/CC | 310 (6) |
261** | 2.23 (0.02) |
2.26 | 4.99 (0.05) |
5.03 | 4.52 (0.12) |
4.38 | $12,895 (414) |
$12,533 |
| 182: esophagitis | 308 (7) |
260** | 2.22 (0.02) |
2.25 | 4.35 (0.03) |
4.39 | 1.39 (0.05) |
1.36 | $12,263 (368) |
$11,940 |
| 143: chest pain | 296 (8) |
235** | 2.14 (0.04) |
2.03* | 2.07 (0.02) |
2.09 | 0.10 (0.01) |
0.10 | $8,505 (262) |
$8,086 |
| 174: G.I. hemorrhage w/CC | 286 (6) |
235** | 2.07 (0.01) |
2.03 | 4.67 (0.03) |
4.75* | 3.39 (0.08) |
3.46 | $15,278 (440) |
$14,698 |
| 138: cardiac arrhythmia & conduction disorders w/CC | 238 (5) |
195** | 1.71 (0.01) |
1.68 | 3.97 (0.03) |
3.98 | 2.88 (0.09) |
2.92 | $12,686 (468) |
$12,138 |
| 517 | 234 (18) |
192* | 1.69 (0.11) |
1.66 | 2.47 (0.06) |
2.50 | 0.33 (0.03) |
0.37 | $32,366 (1,588) |
$31,338 |
| 416: septicemia age >17 | 216 (6) |
182** | 1.56 (0.03) |
1.58 | 7.42 (0.08) |
7.41 | 20.34 (0.30) |
19.92 | $25,095 (1,103) |
$23,920 |
| 320: kidney & urinary tract infections age >17 w/CC | 216 (5) |
178** | 1.56 (0.02) |
1.54 | 5.18 (0.05) |
5.24 | 2.67 (0.09) |
2.70 | $13,443 (545) |
$12,945 |
| 79: respiratory infections & inflammations age >17 w/CC | 191 (5) |
158** | 1.38 (0.02) |
1.37 | 8.32 (0.09) |
8.41 | 15.30 (0.23) |
14.97 | $24,039 (810) |
$23,590 |
| 121: circulatory disorders w/ami & major comp | 187 (4) |
152** | 1.35 (0.02) |
1.32 | 6.17 (0.05) |
6.24 | 0.00 (0.00) |
0.001 | $23,108 (729) |
$22,267 |
| 132: atherosclerosis w/CC | 156 (4) |
127** | 1.13 (0.02) |
1.10 | 2.90 (0.03) |
2.87 | 0.81 (0.05) |
0.75 | $9,911 (456) |
$9,321 |
| 148: major small & large bowel procedures w/CC | 152 (4) |
126** | 1.09 (0.01) |
1.09 | 12.09 (0.08) |
12.23 | 8.08 (0.19) |
8.16 | $50,245 (1,236) |
$49,820 |
| 15: transient ischemic attack & precerebral occlusions | 149 (3) |
121** | 1.08 (0.01) |
1.05 | 3.63 (0.04) |
3.65 | 1.21 (0.07) |
1.30 | $12,085 (476) |
$11,514 |
| 124: circulatory disorders except ami | 143 (6) |
124** | 1.03 (0.03) |
1.07 | 4.45 (0.06) |
4.37 | 0.93 (0.07) |
0.95 | $22,015 (709) |
$21,111 |
| 316: renal failure | 139 (4) |
116** | 1.00 (0.02) |
1.00 | 6.52 (0.07) |
6.53 | 9.90 (0.23) |
9.84 | $20,266 (833) |
$19,640 |
| 210: hip & femur procedures except major joint age >17 w/CC | 135 (3) |
115** | 0.97 (0.01) |
1.00 | 6.81 (0.06) |
6.89 | 3.18 (0.10) |
3.17 | $26,988 (649) |
$26,475 |
| 116: other perm card pacemak impl or ptca w/coronary artery stent implant | 128 (5) |
108** | 0.93 (0.02) |
0.93 | 4.42 (0.06) |
4.40 | 0.55 (0.04) |
0.69** | $35,621 (850) |
$34,542 |
| 141: syncope & collapse w/CC | 127 (3) |
102** | 0.92 (0.01) |
0.88 | 3.56 (0.04) |
3.55 | 0.53 (0.04) |
0.51 | $11,804 (575) |
$11,184 |
*Significant at a 5 percent level.
**Significant at a 1 percent level.
| Number of Discharges in Thousands (Standard Error) | Percentage of Discharges (Standard Error) | Average Length of Stay in Days (Standard Error) | In-Hospital Mortality Rate Percent (Standard Error) | Average Total Hospital Charge (Standard Error) | ||||||
|---|---|---|---|---|---|---|---|---|---|---|
| NIS | MedPAR | NIS | MedPAR | NIS | MedPAR | NIS | MedPAR | NIS | MedPAR | |
| Principal Diagnosis | ||||||||||
| 108: Congestive heart failure, nonhypertensive | 809 (19) |
655** | 5.84 (0.05) |
5.66** | 5.64 (0.05) |
5.68 | 4.79 (0.07) |
4.91 | $20,011 (764) |
$19,447 |
| 122: Pneumonia (except that caused by tuberculosis or sexually transmitted disease) | 758 (15) |
637** | 5.47 (0.06) |
5.51 | 6.42 (0.05) |
6.55** | 7.58 (0.10) |
7.58 | $19,363 (549) |
$19,215 |
| 101: Coronary atherosclerosis and other heart disease | 716 (32) |
584** | 5.17 (0.17) |
5.05 | 3.97 (0.06) |
3.98 | 0.96 (0.03) |
0.98 | $30,326 (1,070) |
$30,019 |
| 106: Cardiac dysrhythmias | 475 (14) |
389** | 3.43 (0.04) |
3.37 | 3.96 (0.04) |
3.95 | 1.51 (0.04) |
1.55 | $21,014 (637) |
$20,275 |
| 100: Acute myocardial infarction | 448 (14) |
367** | 3.23 (0.06) |
3.18 | 6.07 (0.08) |
6.05 | 10.73 (0.16) |
10.72 | $35,913 (1,244) |
$34,564 |
| 127: Chronic obstructive pulmonary disease and bronchiectasis | 437 (10) |
365** | 3.15 (0.05) |
3.16 | 5.30 (0.04) |
5.36 | 2.98 (0.07) |
2.87 | $15,561 (473) |
$15,097 |
| 109: Acute cerebrovascular disease | 386 (9) |
319** | 2.78 (0.03) |
2.76 | 6.26 (0.07) |
6.35 | 11.10 (0.18) |
11.21 | $21,897 (731) |
$21,551 |
| 55: Fluid and electrolyte disorders | 344 (7) |
288** | 2.48 (0.03) |
2.49 | 4.80 (0.05) |
4.85 | 3.98 (0.11) |
3.89 | $12,847 (420) |
$12,426 |
| 254: Rehabilitation care, fitting of prostheses, and adjustment of devices | 343 (23) |
274** | 2.47 (0.17) |
2.37 | 11.89 (0.22) |
12.03 | 0.64 (0.06) |
0.27** | $20,059 (849) |
$21,309 |
| 102: Nonspecific chest pain | 342 (10) |
277** | 2.47 (0.04) |
2.39 | 2.18 (0.02) |
2.20 | 0.10 (0.01) |
0.11 | $9,640 (274) |
$9,301 |
| 237: Complication of device, implant or graft | 332 (12) |
290** | 2.39 (0.06) |
2.51 | 5.89 (0.06) |
5.90 | 2.44 (0.07) |
2.34 | $31,087 (866) |
$31,182 |
| 203: Osteoarthritis | 330 (12) |
279** | 2.38 (0.07) |
2.41 | 4.20 (0.04) |
4.20 | 0.21 (0.01) |
0.21 | $26,992 (509) |
$26,935 |
| 159: Urinary tract infections | 266 (6) |
218** | 1.92 (0.02) |
1.89 | 5.20 (0.05) |
5.28 | 2.41 (0.08) |
2.47 | $13,987 (568) |
$13,466 |
| 226: Fracture of neck of femur (hip) | 253 (6) |
211** | 1.83 (0.02) |
1.83 | 6.54 (0.07) |
6.49 | 3.46 (0.08) |
3.54 | $26,029 (604) |
$25,596 |
| 2: Septicemia (except in labor) | 240 (7) |
202** | 1.73 (0.03) |
1.75 | 8.58 (0.11) |
8.59 | 19.90 (0.29) |
19.49 | $31,129 (1,317) |
$29,948 |
| 153: Gastrointestinal hemorrhage | 217 (4) |
179** | 1.57 (0.01) |
1.55 | 4.93 (0.04) |
5.03* | 4.61 (0.11) |
4.68 | $17,380 (496) |
$16,969 |
| 50: Diabetes mellitus with complications | 206 (4) |
177** | 1.49 (0.02) |
1.53 | 6.43 (0.07) |
6.49 | 2.04 (0.07) |
2.10 | $20,639 (728) |
$20,880 |
| 205: Spondylosis, intervertebral disc disorders, other back problems | 205 (7) |
183** | 1.48 (0.03) |
1.58** | 4.11 (0.05) |
4.01 | 0.45 (0.03) |
0.41 | $20,060 (571) |
$20,245 |
| 238: Complications of surgical procedures or medical care | 187 (5) |
157** | 1.35 (0.02) |
1.36 | 7.03 (0.08) |
7.02 | 2.62 (0.09) |
2.66 | $24,295 (705) |
$24,640 |
| 145: Intestinal obstruction without hernia | 173 (3) |
143** | 1.25 (0.01) |
1.24 | 6.90 (0.05) |
6.95 | 4.55 (0.12) |
4.63 | $22,239 (641) |
$21,989 |
| 149: Biliary tract disease | 172 (4) |
144** | 1.24 (0.01) |
1.25 | 5.52 (0.05) |
5.49 | 1.82 (0.07) |
1.80 | $24,077 (616) |
$23,149 |
| 69: Affective disorders | 170 (9) |
166 | 1.22 (0.06) |
1.44** | 10.43 (0.26) |
10.14 | 0.11 (0.02) |
0.13 | $15,180 (584) |
$14,744 |
| 245: Syncope | 169 (5) |
133** | 1.22 (0.02) |
1.15** | 3.20 (0.04) |
3.25 | 0.40 (0.03) |
0.41 | $12,171 (564) |
$11,757 |
| 197: Skin and subcutaneous tissue infections | 166 (3) |
138** | 1.20 (0.01) |
1.20 | 5.75 (0.05) |
5.79 | 1.05 (0.05) |
1.03 | $14,015 (495) |
$14,068 |
| 146: Diverticulosis and diverticulitis | 163 (4) |
132** | 1.17 (0.01) |
1.14* | 5.72 (0.04) |
5.83* | 1.89 (0.07) |
1.98 | $19,786 (510) |
$19,618 |
*Significant at a 5 percent level.
**Significant at a 1 percent level.
| Number of Discharges in Thousands (Standard Error) | Percentage of Discharges (Standard Error) | Average Length of Stay in Days (Standard Error) | In-Hospital Mortality Rate Percent (Standard Error) | Average Total Hospital Charge (Standard Error) | ||||||
|---|---|---|---|---|---|---|---|---|---|---|
| NIS | MedPAR | NIS | MedPAR | NIS | MedPAR | NIS | MedPAR | NIS | MedPAR | |
| Principal Procedure | ||||||||||
| 70: Upper gastrointestinal endoscopy, biopsy | 394 (10) |
338** | 2.84 (0.03) |
2.92 | 6.03 (0.05) |
6.12 | 2.24 (0.06) |
2.21 | $19,478 (593) |
$18,775 |
| 47: Diagnostic cardiac catheterization, coronary arteriography | 349 (17) |
295** | 2.52 (0.09) |
2.55 | 4.23 (0.06) |
4.19 | 1.34 (0.06) |
1.35 | $22,739 (735) |
$21,381 |
| 45: Percutaneous transluminal coronary angioplasty (PTCA) | 347 (25) |
294* | 2.51 (0.15) |
2.54 | 3.13 (0.07) |
3.17 | 1.22 (0.06) |
1.21 | $34,967 (1,662) |
$33,762 |
| 222: Blood transfusion | 292 (12) |
230** | 2.11 (0.07) |
1.99 | 6.00 (0.07) |
6.03 | 6.65 (0.15) |
6.77 | $18,441 (701) |
$18,054 |
| 216: Respiratory intubation and mechanical ventilation | 270 (6) |
222** | 1.95 (0.03) |
1.92 | 9.19 (0.12) |
9.24 | 40.63 (0.39) |
40.85 | $46,864 (1,463) |
$45,059 |
| 152: Arthroplasty knee | 230 (9) |
200** | 1.66 (0.05) |
1.73 | 4.21 (0.04) |
4.24 | 0.18 (0.01) |
0.21 | $28,354 (549) |
$28,076 |
| 48: Insertion, revision, replacement, removal of cardiac pacemaker or cardioverter/defibrillator | 228 (11) |
187** | 1.64 (0.06) |
1.62 | 5.28 (0.08) |
5.32 | 1.50 (0.07) |
1.64 | $49,373 (1,514) |
$48,224 |
| 153: Hip replacement, total and partial | 226 (7) |
192** | 1.63 (0.03) |
1.66 | 5.54 (0.05) |
5.61 | 1.58 (0.06) |
1.60 | $31,150 (666) |
$30,999 |
| 54: Other vascular catheterization, not heart | 201 (13) |
165** | 1.45 (0.08) |
1.43 | 9.14 (0.29) |
9.34 | 13.50 (0.61) |
14.02 | $29,798 (1,663) |
$30,181 |
| 58: Hemodialysis | 186 (6) |
163** | 1.34 (0.04) |
1.41 | 5.45 (0.06) |
5.39 | 4.19 (0.13) |
3.97 | $18,518 (640) |
$17,818 |
| 146: Treatment, fracture or dislocation of hip and femur | 182 (4) |
154** | 1.31 (0.01) |
1.33 | 6.31 (0.06) |
6.41 | 2.57 (0.08) |
2.63 | $24,847 (592) |
$24,508 |
| 76: Colonoscopy and biopsy | 167 (4) |
139** | 1.20 (0.01) |
1.20 | 6.04 (0.05) |
6.11 | 1.37 (0.07) |
1.49 | $18,127 (618) |
$17,635 |
| 44: Coronary artery bypass graft (CABG) | 166 (11) |
135** | 1.20 (0.07) |
1.17 | 9.71 (0.13) |
9.67 | 3.30 (0.13) |
3.36 | $74,562 (2,925) |
$74,716 |
| 78: Colorectal resection | 147 (4) |
121** | 1.06 (0.01) |
1.04 | 11.02 (0.08) |
11.14 | 6.33 (0.16) |
6.54 | $45,767 (1,135) |
$45,163 |
| 61: Other OR procedures on vessels other than head and neck | 141 (5) |
121** | 1.02 (0.02) |
1.05 | 7.28 (0.15) |
7.24 | 4.65 (0.15) |
4.66 | $38,953 (1,389) |
$38,694 |
| 84: Cholecystectomy and common duct exploration | 138 (3) |
119** | 1.00 (0.01) |
1.03 | 6.24 (0.06) |
6.22 | 1.75 (0.08) |
1.84 | $28,626 (735) |
$27,358 |
| 213: Physical therapy exercises, manipulation, and other procedures | 126 (16) |
94 | 0.91 (0.11) |
0.81 | 11.86 (0.46) |
10.91* | 0.91 (0.12) |
0.47** | $20,373 (1,559) |
$21,098 |
| 231: Other therapeutic procedures | 115 (12) |
120 | 0.83 (0.09) |
1.03* | 5.50 (0.22) |
5.45 | 5.51 (0.30) |
5.54 | $16,339 (1,008) |
$16,175 |
| 39: Incision of pleura, thoracentesis, chest drainage | 104 (2) |
87** | 0.75 (0.01) |
0.75 | 8.18 (0.07) |
8.32 | 8.60 (0.21) |
8.55 | $25,258 (792) |
$24,648 |
| 193: Diagnostic ultrasound of heart (echocardiogram) | 103 (8) |
99 | 0.75 (0.06) |
0.85 | 5.63 (0.10) |
5.58 | 2.61 (0.16) |
2.75 | $17,878 (1,119) |
$17,276 |
| 51: Endarterectomy, vessel of head and neck | 102 (4) |
85** | 0.74 (0.02) |
0.73 | 2.91 (0.05) |
2.99 | 0.53 (0.04) |
0.53 | $19,535 (622) |
$19,227 |
| 169: Debridement of wound, infection or burn | 100 (2) |
88** | 0.72 (0.01) |
0.76* | 11.43 (0.17) |
11.28 | 4.56 (0.19) |
4.74 | $35,585 (1,462) |
$35,067 |
| 3: Laminectomy, excision intervertebral disc | 84 (4) |
78 | 0.61 (0.02) |
0.68** | 3.67 (0.07) |
3.57 | 0.35 (0.04) |
0.32 | $18,868 (680) |
$18,237 |
| 113: Transurethral resection of prostate (TURP) | 83 (3) |
69** | 0.60 (0.01) |
0.60 | 3.29 (0.05) |
3.37 | 0.36 (0.04) |
0.40 | $12,825 (391) |
$12,554 |
| 37: Diagnostic bronchoscopy and biopsy of bronchus | 80 (2) |
73** | 0.58 (0.01) |
0.63** | 9.46 (0.10) |
9.52 | 6.99 (0.27) |
6.97 | $33,922 (1,229) |
$32,330 |
*Significant at a 5 percent level.
**Significant at a 1 percent level.
A variety of statistics were estimated based on these NHDS data:
The standard errors were calculated as follows:
From the NHDS Documentation (National Center for Health Statistics, 2004), constants a and b were obtained for 2002. The relative standard error for the estimate of total discharges was approximated by:
![]()
where WTD was the weighted sum of total discharges (i.e., the estimate of total discharges).
The standard error was then calculated as:
![]()
Let p be the estimated proportion of in-hospital deaths (with the number of deaths estimated as the numerator and the discharge estimate as the denominator). The relative standard error of this proportion expressed as a percent was approximated by:
![]()
The standard error was then calculated as:
![]()
Where b was the parameter in the formula for approximated RSE(WTD) given by the NHDS documentation (i.e., the same used in the formula for calculating the standard error for number of discharges).
Let average length of stay be the estimated average length of stay based on a weighted number of discharges equal to TD. If the weighted sum of patient length of stay was TLOS, and
![]()
then the relative standard error is:
![]()
The estimate of the relative standard error was valid only if:
For all parameter estimates, when values of a and b were available in the NHDS documentation (i.e., for procedures, sex, region, race, and diagnoses), the appropriate values for a and b were used. When a variable represented the sum of more than one NHDS category, as recommended by Korn and Graubard (1999, p.224), the standard error for each category was calculated, and the largest of these standard errors was reported and used in significance testing. For example, the NIS category of "private insurance" includes three NHDS categories: 1) Blue Cross/Blue Shield; 2) HMO/PPO; and 3) other private insurance. The standard error was calculated for all three categories, using the values of a and b provided in the NHDS documentation, and the largest value was used in computing the t-value to test for significant difference.
When no parameter estimates were available, the values of a and b for the total sample were used in calculating the standard errors. For example, in the hospital control X bed size comparisons, the values for the total sample were used in calculating standard errors, because the NHDS documentation provides parameter estimates by neither ownership nor bed size.
To test for a statistically significant difference between a NIS estimate, X, and a NHDS estimate, Y, the following procedure was used. The difference was significant if
where SEx was the estimated standard error for the NIS estimate and SEy was the estimated standard error of the NHDS estimate.