
Contact Information:
Healthcare Cost and Utilization Project (HCUP)
Agency for Healthcare Research and Quality
540 Gaither Road
Rockville, MD 20850
For Technical Assistance with HCUP Products:
Email: hcup@ahrq.gov
or
Phone: 1-866-290-HCUP
Recommended Citation: Houchens R, Ross D, Elixhauser A, Jiang J. Nationwide Inpatient Sample (NIS) Redesign Final Report. 2014. HCUP Methods Series Report #2014-04 ONLINE. April 4, 2014. U.S. Agency for Healthcare Research and Quality. Available: http://www.hcup-us.ahrq.gov/reports/methods/methods.jsp
Many health researchers across the United States rely upon the Healthcare Cost and Utilization Project (HCUP) Nationwide Inpatient Sample1 (NIS) — a database of hospital inpatient stays and discharges that is sponsored by the Agency for Healthcare Research and Quality (AHRQ). Studies based on the NIS help policymakers understand cost, access, quality, utilization, and health outcomes of hospital services. It is critical that the NIS be designed to optimize its capacity for national estimates.
The NIS sampling frame has grown from 8 States in 1988, to 22 States in 1998, to 46 States in 2011 — currently covering 97 percent of the U.S. population. Because the sampling frame for the NIS contains nearly the entire universe of discharges, in 2012 we evaluated the sampling approach to determine whether a different strategy could improve the accuracy of national estimates from the NIS. As a result of the 2012 evaluation study, a new NIS sample design was recommended. This evaluation:
AHRQ has elected to deploy the systematic sampling design that was recommended, effective with the 2012 NIS that is planned for public release in June, 2014. This report lays out the implementation of the new design.
Previous Study Results
For a previous evaluation performed during 2012,2 the project team considered and compared three alternative sampling designs to the present NIS design: (1) a slight modification to the present NIS design that stratified hospitals into nine census divisions instead of four census regions, (2) a Neyman allocation design that optimized the estimates of average length of stay (ALOS), and (3) a self-weighting systematic design that took into account patient characteristics such as diagnoses, age, and admission date.
The team recommended the systematic design because:
The present NIS design draws 100 percent of discharges from a sample of approximately 1,000 hospitals, whereas the proposed systematic design samples a fraction of discharges from across all HCUP hospitals (over 4,500 in 2011). The systematic sample is a self-weighted sample design that is similar to simple random sampling, but it is more efficient and it ensures that the sample is representative of the population on the following critical factors—
The superior performance of the systematic design that samples discharges across all hospitals is not surprising, because patient characteristics and mean outcomes vary significantly among hospitals. Variation in mean outcomes such as ALOS, charges, and mortality rates for discharges among hospitals causes a net loss of information under the present NIS design, which draws a sample of hospitals. This is compared with the systematic design, which draws the same total number of discharges across the entire spectrum of hospitals participating in HCUP. Even though the present NIS design stratifies the hospital sample by hospital characteristics, there can be considerable variation in mean outcomes estimated from one hospital sample to the next, depending on which hospitals are selected for the sample. In contrast, the systematic sampling strategy selects a sample of discharges from all hospitals, which better represents the entire universe of hospitals and increases the information in the total sample of discharges.
For national-level estimates, the systematic design reduced the margin of error by 42 to 48 percent over the present NIS design for the outcomes studied (ALOS, average charges, and mortality rates), thus the new NIS design will be about twice as precise as the old design. The margin of error is commonly used by the popular press to describe the reliability of sample statistics. Technically, it is the half-width of a confidence interval around a sample statistic, such as a rate or a mean. The systematic design also consistently reduced the margin of error for estimates at the DRG level.
Finalizing the New Design
In preparation for implementing the systematic sampling design for the 2012 NIS, we:
We summarize the results of these activities in the following sections.
Enlisted HCUP Partner Support
It is important that HCUP Partners who contribute data approve the new design. Consequently, AHRQ and Truven Health Analytics researchers jointly presented the new design to HCUP Partners and requested feedback. Along with the sample design changes, AHRQ proposed the following changes to enhance confidentiality and focus the NIS on national estimates:
Partners who attended the presentation indicated their support. The NIS is not designed for State-level analyses, so little is lost analytically by omitting the State names from the NIS record. Users may turn to the State Inpatient Databases (SID) for analyses requiring State identification or State-specific data elements. The use of hospital pseudo-identifiers will help protect hospital identities while preserving the analyst�s ability to estimate hospital-level variation.
Removed Long-Term Acute Care Hospitals5
The most recent NIS redesign was implemented for the 1998 data year. For the 1998 redesign, rehabilitation hospitals—although classified as community hospitals by the AHA�were excluded from the NIS universe because (1) the State data did not always include discharges from those hospitals, and (2) outcomes for discharges from rehabilitation hospitals were different from discharges from short-term acute care hospitals. Similarly long-term acute care hospitals are classified as community hospitals by the AHA if they have an average length-of-stay (ALOS) less than 30 days. However, during the most recent analyses we determined that they were not uniformly available from all States participating in HCUP, and their ALOS was over 25 days (unlike other community hospitals with an ALOS of about 4.5 days). Thus, we decided to eliminate long-term acute care hospitals from future editions of the NIS. The effects of this change were relatively minor, as we report later.
Improved Estimates of the Total Number of Discharges in the Universe
Historically, NIS sample weights were calculated by dividing the number of universe discharges by the number of sampled discharges within each hospital stratum. The number of universe discharges had been estimated using data from the AHA annual hospital survey. In particular, the total number of discharges in the universe was estimated by the sum of births and admissions contained in the AHA annual survey for all hospitals in the universe. Given that HCUP Partners supply over 95 percent of discharges nationwide, for future editions of the NIS, we will estimate the universe count of discharges within each stratum using the actual count of discharges contained in HCUP data. We will use the AHA counts only for non-HCUP hospitals in the universe.
This option was not considered for the previous redesign because HCUP data included a much smaller percentage of discharges in the United States, and the differences between HCUP counts and AHA counts would tend to adversely affect trends as the mix of HCUP States changed from year to year. In 2011, for hospitals in both the AHA and the SID, in 43 of 46 States, the AHA survey data estimated State discharge totals that were between 1 percent and 17 percent higher than the observed SID discharge totals. Overall, the AHA survey estimated about a 4 percent higher count of discharges than the observed SID count. Although the current high HCUP State participation rate is an important factor, there are several other reasons for switching to the HCUP count of discharges:
The effects of this change were significant for estimates of discharge counts, but not for estimates of means and rates, as we report below.
Used State Hospital Identifiers Rather than AHA Hospital Identifiers
A logical corollary of switching from AHA discharge estimates to SID discharge counts was to distinguish unique hospitals using the SID hospital identifiers rather than the AHA hospital identifiers. For the vast majority of hospitals, the SID hospital identifiers are in one-to-one correspondence with the AHA hospital identifiers. However, about 10 percent of the AHA identifiers actually correspond to two or more hospitals in the SID that have common ownership within a hospital system. For these "combined" AHA identifiers, the number of estimated discharges and the number of hospital beds in the AHA data reflect the sum of estimated discharges and the sum of beds, respectively, from the constituent hospitals. As a result, these combined hospitals could have been allocated to the wrong bed size stratum in the sample design. Also, the between-hospital variance was combined with the within-hospital variance for these combined hospitals.
In some States, the SID hospital identifiers demonstrate the same weakness as the AHA hospital identifiers, and those hospitals remain combined in the new design even though we are switching to the SID hospital identifier. However, use of the SID hospital identifiers disaggregates the previously combined hospitals in many other States, which is likely to improve the classification of hospitals and improve variance estimates.6 The marginal effect of this change on outcome estimates was very small, as we report next.
Estimated the Effects of Design Changes on Sample Estimates
The switch from drawing all discharges from a sample of hospitals to drawing a sample of discharges from all hospitals improved the precision and stability of NIS sample estimates. However, the other modifications listed above affected the values of universe statistics (i.e., the values that sample statistics try to estimate). In particular, these modifications had an effect on the numbers and types of discharges in the universe. Using HCUP and AHA annual survey data for 2011, we estimated the effects of these changes:
Table 1 summarizes the effects of these modifications on four universe statistics—discharges, ALOS, average charges, and hospital mortality—obtained from HCUP discharge data and AHA survey data for 2011. The columns are numbered for easy reference. Columns 1 and 2 provide the baseline statistics and describe the universe without any modifications.
Columns 3 and 4 show the effect of excluding LTAC hospitals from the universe. The total number of discharges declined from 38,590,733 (column 1) to 38,338,545 (column 3), which represents a 0.7 percent overall decline. This decline was mostly in the older age groups (not shown). The removal of LTAC hospitals also decreased ALOS by 1.5 percent, average charges by 0.7 percent, and hospital mortality by 2.0 percent (from a mortality rate of 1.91 percent to 1.87 percent). These changes are all to be expected given the characteristics of patients in LTAC hospitals.
Columns 5 and 6 show the effect of replacing AHA discharge counts with SID discharge counts to estimate discharges in the universe (in addition to excluding LTAC hospitals). This action had a significant impact on the universe discharge count. The total number of discharges in the universe fell from 38,338,545 (column 3) to 36,935,306 for a further decrease of 3.6 percent and an overall decrease of 4.3 percent, compared with the discharge count in column 1. The incremental impact on ALOS, average charges, and hospital mortality was almost negligible in comparison.
Finally, the incremental effects of switching from the AHA hospital identifier to the SID hospital identifier (columns 7 and 8) were miniscule for all four outcomes.
In summary, based on the changes implemented in the redesign, we expect overall trends in discharge counts to decline by about 4.3 percent, overall trends in ALOS to decline by about 1.5 percent, overall trends in total charges to decline by about 0.5 percent, and overall trends in hospital mortality to decline by about 2.0 percent.
Table 2 summarizes the effects of these modifications on the margin of error for sample statistics. The entries in Table 2 show the margin of error for the new sample design in relation to the margin of error for the present NIS design. For example, an entry of 0.50 means that the margin of error for a statistic generated from a sample under the new design is half that of a statistic generated from a sample under the present sample design (for a sample of about 8 million discharges). In other words, an entry of 0.50 means that confidence intervals under the new design would be about half the length of confidence intervals under the old design. These results (based on 2011 data) were very similar to last year�s results (based on 2010 data).
For discharge counts, the entries of 1.0 indicate that there is no improvement to the margin of error for estimates of total discharges at the national level. This is by design. At the national level, the sample weights always sum to the total number of discharges in the universe. However, the estimates of total discharges for subsets of the population showed substantial improvements, as is shown in the results chapter of this report.
For ALOS, average charges, and hospital mortality, the improvements were substantial at the national level. The margins of error under the new design are expected to be about 53 percent of the old design for ALOS estimates, about 55 percent of the old design for average charge estimates, and about 51 percent of the old design for estimates of hospital mortality. As can be seen by comparing entries across the columns of Table 2, the improvements continue through the incremental changes to the universe definition.
Moreover, as shown in the results chapter of this report, these improvements persist for discharges classified by age, sex, and DRGs. For example, across all 7528 DRGs, the margins of error for the new design compared with the old design average 46 percent lower for total discharges, 36 percent lower for ALOS, 41 percent lower for average charges, and 28 percent lower for in-hospital mortality rates. Further, for 90 percent of DRGs the new margins of error are at least 41 percent lower for total discharges, 29 percent lower for ALOS, 34 percent lower for average charges, and 22 percent lower for in-hospital mortality rates.
Conclusions
In sum, the NIS redesign planned to take effect for the 2012 NIS (to be released in 2014) is expected to provide more stable and precise estimates than previous versions of the NIS. Because long-term acute care hospitals will be excluded and because the accuracy of discharge weights will be improved, NIS users should expect a one-time decrease to historical trends for discharge counts of about 4 percent. They should also expect smaller one-time disruptions to historical trends for rates and means estimated from the NIS, beginning with data year 2012. To address this, we recommend that AHRQ provide NIS users with �trend� discharge weights for historical NIS files to minimize the effects of the redesign on estimated trends that cross the 2012 data year.
Table 1. Impact of Incremental Modifications to the Universe on Universe Statistics.
| Old Universe Definition (1998�2011) | Impact of Incremental Modifications to the Universe | |||||||
|---|---|---|---|---|---|---|---|---|
| Include LTAC Hospitals | Exclude LTAC Hospitals | |||||||
| Use AHA Discharge Counts | Use AHA Discharge Counts | Use SID Discharge Counts* | ||||||
| Use AHA Hospital ID | Use AHA Hospital ID | Use AHA Hospital ID | New Universe Definition Use SID Hospital ID |
|||||
| Total Discharges | Percentage of Original Discharges | Total Discharges | Percentage of Original Discharges | Total Discharges | Percentage of Original Discharges | Total Discharges | Percentage of Original Discharges | |
| Column Number | 1 | 2 | 3 | 4 | 5 | 6 | 7 | 8 |
| Discharge Count | 38,590,733 | 100.0 | 38,338,545 | 99.3 | 36,935,306 | 95.7 | 36,939,183 | 95.7 |
| ALOS | 4.59 | 100.0 | 4.53 | 98.5 | 4.52 | 98.5 | 4.53 | 98.5 |
| Average Charges | $34,962 | 100.0 | $34,711 | 99.3 | $34,779 | 99.5 | $34,790 | 99.5 |
| Hospital Mortality | 0.01905 | 100.0 | 0.01867 | 98.0 | 0.01866 | 97.9 | 0.01866 | 98.0 |
Data sources: HCUP State Inpatient Databases (SID) and American Hospital Association (AHA) Survey Data for 2011
* When discharge counts or hospital identifiers are not available from the SID, estimates from the AHA will be used. This is expected to affect fewer than 10 percent of hospitals.
Abbreviations: ALOS, average length of stay; ID, identification number; LTAC, long-term acute care.
Table 2. Impact of Incremental Modifications to the Universe on the Margin of Error for Sample Statistics
| Old Universe Definition (1998�2011) | Impact of Incremental Modifications to New NIS Design | |||
|---|---|---|---|---|
| Include LTAC Hospitals | Exclude LTAC Hospitals | |||
| Use AHA Discharge Counts | Use AHA Discharge Counts | Use SID Discharge Counts* | ||
| Use AHA Hospital ID | Use AHA Hospital ID | Use AHA Hospital ID | New Universe Definition Use SID Hospital ID | |
| Column Number | 1 | 2 | 3 | 4 |
| Discharge Count | 1.00 | 1.00 | 1.00 | 1.00 |
| ALOS | 0.53 | 0.52 | 0.52 | 0.53 |
| Average Charges | 0.55 | 0.58 | 0.57 | 0.55 |
| Hospital Mortality | 0.57 | 0.55 | 0.55 | 0.51 |
Based on 500 Simulated Samples, HCUP 2011 Data.
* When discharge counts or hospital identifiers are not available from the SID, estimates from the AHA will be used. This is expected to affect fewer than 10 percent of hospitals.
Abbreviations: AHA, American Hospital Association; ALOS, average length of stay; LTAC, long-term acute care; SID, State Inpatient Databases
The Nationwide Inpatient Sample9 (NIS), a database of United States hospital discharge data, is designed to inform policy decisions regarding health and healthcare at the national and regional levels. Through NIS data, researchers can make inferences about national trends in healthcare utilization, access, cost, quality, and outcomes. Developed as part of the Healthcare Cost and Utilization Project (HCUP), a Federal-State-Industry partnership sponsored by the Agency for Healthcare Research and Quality (AHRQ), the NIS is the largest all-payer inpatient care database that is publicly available in the United States and has been made publicly available since the 1988 data year.
The NIS contains nationally representative data on about 8 million hospital discharges from about 1,000 hospitals sampled annually, to approximate a 20 percent stratified sample of U.S. community hospitals. For purposes of the NIS, the definition of a community hospital is that used by the American Hospital Association (AHA): "all nonfederal short-term general and other specialty hospitals, excluding hospital units of institutions." Consequently, Veterans Affairs hospitals, Indian Health Service hospitals, and other Federal hospitals are excluded. Beginning with 1998, short-term rehabilitation hospitals were also excluded.
The 2011 sampling frame for the NIS included 46 States from the State Inpatient Databases (SID). The SID contain a near-census of hospital discharge records supplied by HCUP Partner State data organizations.10 The NIS is a stratified probability sample of hospitals in the frame, with sampling probabilities proportional to the number of U.S. community hospitals in each stratum. The frame is limited by the availability of inpatient data from the data sources currently participating in HCUP. The NIS contains clinical and resource use information included in a typical discharge abstract. Researchers can apply for access to some individual SID files through the HCUP Central Distributor.
In 1988, only eight States participated in HCUP—producing a sample of 758 hospitals and more than 5 million discharges. However, by 2011, 46 States were part of the NIS with more than 1,000 hospitals and more than 8 million discharges. To ensure that the NIS sample is representative of the target universe of U.S. community hospitals and discharges, the NIS sample is based on strata using five hospital characteristics: ownership/control, bed size, teaching status, urban/rural location, and U.S. region.
Not all States are present in the NIS data. Stratification is necessary because, historically, substantial differences existed between the sampling frame (HCUP participating States) and the non-HCUP States. For example, at one time HCUP hospitals tended to be larger than non-HCUP hospitals.11 To the extent that hospital outcomes vary on such unbalanced factors, stratification becomes even more important. For 2011, the 46 States participating in HCUP comprised over 97 percent of the U.S. population of hospital discharges, producing a sampling frame that is nearly representative of the entire country. Figure 1 highlights the NIS States by the four U.S. Census Bureau regions divided into the nine census divisions, and lists the States that comprise each census division.
Many health researchers across the United States rely upon the NIS. Over 3000 studies have been published using NIS data. Studies based upon the NIS help policymakers to understand cost, access, quality, utilization, and health outcomes of hospital services. It is critical that the NIS be designed to optimize its capacity for national estimates. However, the current NIS design—sampling hospitals and then taking all of their discharges—causes the estimates to be sensitive to situations where certain types of conditions are concentrated in certain hospitals.
For example, Figure 2 is a graph of average length of stay (ALOS) for asthma estimated from the NIS and from the complete HCUP State Inpatient Databases (SID), weighted up to the national level. These are quarterly numbers from 2001 to 2007. In the graph, the two lines are very close�the ALOS from the NIS (in black) closely overlays the ALOS from all HCUP data from the SID (in red). Asthma is a common condition that is not necessarily treated in specialty hospitals; asthma discharges are fairly equally distributed across most types of hospitals.
Figure 3 depicts a different story: ALOS for breast cancer patients. In this graph, the black line (the NIS) diverges substantially from the red line (the SID), and the NIS line shows more year-to-year variability. Breast cancer patients are more likely to be treated at a specialty hospital, which causes the estimates to be sensitive to whether particular hospitals were chosen for the sample. This illustrates the basic impetus for the NIS redesign—even when stratified by hospital characteristics, there can be considerable variation in mean outcomes estimated from one hospital sample to the next, depending on which hospitals are selected for the sample.
As part of the 2012 sample design evaluation, we reviewed a representative sample of studies that used the NIS and found that only 5 percent of the studies required all discharges from sampled hospitals. Also, researchers who require complete discharge data from every hospital can use the SID data which are readily available now through the Central Distributor, unlike when the NIS was first designed. Because the sampling frame for the NIS now contains nearly the entire universe of hospitals and discharges, we evaluated the sampling approach to determine whether a different strategy could improve the accuracy of national estimates from the NIS. As a result of this evaluation, a new NIS sample design was recommended. This evaluation:
AHRQ has elected to deploy the systematic sampling design that was recommended, effective with the 2012 NIS that is planned for public release in June 2014. The systematic sampling strategy selects a sample of discharges from all hospitals, which better represents the entire universe of hospitals and increases the information in the total sample of discharges. This produces more accurate and more consistent sample estimates. This report lays out the implementation of the new design.
Figure 1: Hospital Universe, by Year12
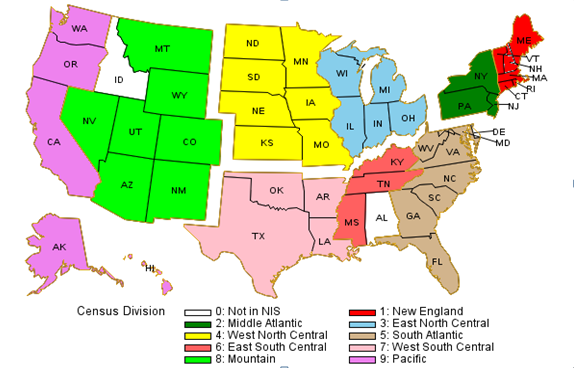
Figure 1 highlights the NIS States by the four U.S. Census Bureau regions divided into the nine census divisions, and lists the States that comprise each census division. For 2012, the 46 States participating in HCUP comprised over 97 percent of the U.S. population of hospital discharges, producing a sampling frame that is nearly representative of the entire country.
All States, by U.S Census Bureau13 Region and Census Division14
Figure 2: State Inpatient Databases (SID) versus Nationwide Inpatient Sample (NIS) for Asthma Average Length of Stay (ALOS)
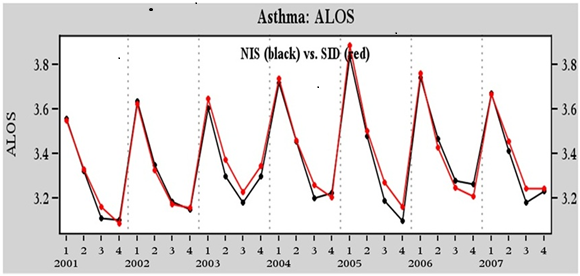
Figure 2 is a graph of average length of stay (ALOS) for asthma estimated from the NIS and from the complete HCUP State Inpatient Databases (SID), weighted up to the national level. These are quarterly numbers from 2001 to 2007. In the graph, the two lines are very close—the ALOS from the NIS closely overlays the ALOS from all HCUP data from the SID.
Figure 3: State Inpatient Databases (SID) versus Nationwide Inpatient Sample (NIS) for Breast Cancer Average Length of Stay (ALOS)
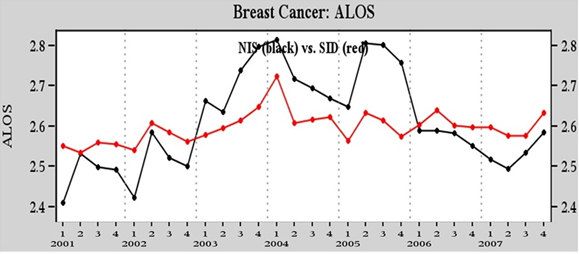
Figure 3 depicts a different story: ALOS for breast cancer patients. In this graph, the black line (the NIS) diverges substantially from the red line (the SID), and the NIS line shows more year-to-year variability.
Given the increase in national coverage of HCUP data over the years, AHRQ requested a design evaluation to ensure that the NIS design makes the best use of the data available. Because patient characteristics and mean outcomes vary significantly among hospitals, we focused on alternative sampling strategies that select samples of discharges from all hospitals rather than on selecting all discharges from a sample of hospitals.
For a previous evaluation performed during 2012, the project team considered and compared three alternative sampling designs to the present NIS design:
(1) A slight modification to the present NIS design that stratified hospitals into nine census divisions instead of four census regions
(2) A Neyman allocation design that optimized the estimates of ALOS
(3) A self-weighting systematic design that took into account patient characteristics such as diagnoses, age, and admission date, as well as hospital characteristics.
After analysis, the team recommended the self-weighting systematic design because:
The present NIS design draws 100 percent of discharges from a sample of approximately 1,000 hospitals, whereas the proposed new systematic design samples a fraction of discharges from across all HCUP hospitals (over 4,500 hospitals in 2011). The new systematic sample is a self-weighted sample design that is similar to simple random sampling, but it is more efficient. It also ensures that the sample is representative of the population on the following critical factors—
For national-level estimates, the systematic design reduces the margin of error by 42 to 48 percent over the present NIS design for the outcomes studied (total discharges, average length-of-stay, average charges, and mortality rates), thus the new NIS design will generate estimates that are about twice as precise as those from the old design. The margin of error is commonly used by the popular press to describe the reliability of sample statistics. Technically, it is the half-width of a confidence interval around a sample statistic, such as a rate or a mean. The systematic design also consistently reduced the margin of error for estimates at the DRG level.
Following the sampling strategy redesign, in preparation for implementing the systematic sampling design for the 2012 NIS, we performed additional analyses to ensure that other factors associated with the design were optimal. The analyses included the following:
We summarize the results of these activities in the following sections.
1.4.1 Enlisted HCUP Partner Support
It is important that HCUP Partners who contribute data approve the new design. Consequently, AHRQ and Truven Health researchers jointly presented the new design to HCUP Partners and requested feedback. Along with the sample design changes, AHRQ proposed the following changes to enhance confidentiality and focus the NIS on national estimates:
Partners who attended the presentation indicated their support. The NIS is not designed for State-level analyses, so little is lost analytically by omitting the State name from the NIS record. Users may turn to the SID, which would be more appropriate for State-specific analyses. The use of hospital pseudo-identifiers will help protect hospital identities while preserving the analyst�s ability to estimate hospital-level variation.
1.4.2 Removed Long-Term Acute Care Hospitals
The most recent NIS redesign was implemented for the 1998 data year. For the 1998 redesign, rehabilitation hospitals—although classified as community hospitals by the AHA—were excluded from the NIS universe because (1) the State data did not always include discharges from those hospitals, and (2) outcomes for discharges from rehabilitation hospitals were different from discharges from short-term acute care hospitals. Similarly long-term acute care hospitals are classified as community hospitals by the AHA if they have an average length-of-stay (ALOS) less than 30 days. LTAC hospitals are certified as acute care hospitals, but have an ALOS greater than 25 days, unlike other community hospitals with an ALOS of about 4.5 days. Patients in LTAC hospitals are often transferred from an intensive or critical care unit, generally have more than one serious condition, and are expected to improve and return home. LTAC hospitals typically provide comprehensive rehabilitation, respiratory therapy, head trauma treatment, and pain management services. Importantly, we determined that LTAC hospitals were not uniformly available from all States participating in HCUP. Thus, we decided to eliminate long-term acute care hospitals from future editions of the NIS. The effects of this change were relatively minor, as we report later.
1.4.3 Improved Estimates of the Total Number of Discharges in the Universe
Historically, NIS sample weights were calculated by dividing the number of universe discharges by the number of sampled discharges within each hospital stratum. The number of universe discharges was estimated using data from the AHA annual hospital survey. In particular, the total number of discharges in the universe was estimated by the sum of births and admissions contained in the AHA annual survey for all hospitals in the universe. Given that HCUP Partners supply over 95 percent of discharges nationwide, under the new design we will estimate the universe count of discharges within each stratum using the actual count of discharges contained in HCUP data. We will use the AHA counts only for non-HCUP hospitals in the universe.
This option was not considered for the previous redesign because HCUP data included a much smaller percentage of discharges in the United States, and the differences between HCUP counts and AHA counts would tend to adversely affect trends as the mix of HCUP States changed from year to year. In 2011, for hospitals in both the AHA and the SID, in 43 of 46 States, the AHA survey data estimated State discharge totals that were between 1 percent and 17 percent higher than the observed SID discharge totals. Overall, the AHA survey estimated about a 4 percent higher count of discharges than the observed SID count. Although the current high HCUP State participation rate is an important factor, there are several other reasons for switching to the HCUP count of discharges:
The effects of this change were significant for estimates of discharge counts, but not for estimates of means and rates, as we report below.
1.4.4 Used State Hospital Identifiers Rather than AHA Hospital Identifiers
A logical corollary of switching from AHA discharge estimates to SID discharge counts was to distinguish unique hospitals using the SID hospital identifiers rather than the AHA hospital identifiers. For the vast majority of hospitals, the SID hospital identifiers are in one-to-one correspondence with the AHA hospital identifiers. However, about 10 percent of the AHA identifiers actually correspond to two or more hospitals in the SID that have common ownership within a hospital system. For these �combined� AHA identifiers, the number of estimated discharges and the number of hospital beds in the AHA data reflect the sum of estimated discharges and the sum of beds, respectively, from the constituent hospitals. As a result, these combined hospitals could have been allocated to the wrong bed size stratum in the sample design. Also, the between-hospital variance was combined with the within-hospital variance for these combined hospitals.
In some States, the SID hospital identifiers demonstrate the same weakness as the AHA hospital identifiers, and those hospitals remain combined in the new design even though we are switching to the SID hospital identifier. However, use of the SID hospital identifiers disaggregates the previously combined hospitals in many other States, which is likely to improve the classification of hospitals and improve variance estimates.15 The marginal effect of this change on outcome estimates was very small.
1.4.5 Estimated the Effects of Design Changes on Sample Estimates
The switch from drawing all discharges from a sample of hospitals to drawing a sample of discharges from all hospitals improved the precision and stability of NIS sample estimates. However, the other modifications listed above affected the values of universe statistics (i.e., the values that sample statistics try to estimate). In particular, these modifications had an effect on the numbers and types of discharges in the universe. Using HCUP and AHA annual survey data for 2011, we estimated the effects of these changes:
In summary, there are three kinds of changes planned for the 2012 NIS. First, the definition of the universe will be revised. Second, the sample design will switch to a sample of discharges from all frame hospitals rather than all discharges from a sample of frame hospitals. Third, confidentiality will be enhanced by dropping:
(1) State identifiers to prevent State-level estimates (which were invalid using the current design but were tempting for researchers to use because State identifiers were present in the dataset) and
(2) data elements that were not available uniformly across the States, such as hospital identifiers, secondary payer, and data elements with State-specific coding.
The target universe remains the same: all discharges from community hospitals in the United States. However, in addition to excluding rehabilitation hospitals (beginning with 1998), we will now also exclude LTAC hospitals because:
(1) LTAC hospitals are not uniformly available from all HCUP participating States, and
(2) LTAC hospitals have longer lengths of stay than other community hospitals.
These modifications to the universe have effects (described later in this report) that are independent of the switch from the original NIS sample design to the systematic sample design.
The definition of the sampling frame remains the same under the new NIS design: all discharges from target universe hospitals in the HCUP State data.
The sample size remains the same: 20 percent of discharges in the universe.
The main change to the current sample design is that rather than draw a sample of hospitals and then keep all discharges from the sample of hospitals, we will draw a sample of discharges from all hospitals in the sampling frame. The only stratification factor that changes is that we will stratify hospitals by census division rather than census region.17
We will draw the sample using several steps.
Table 3 summarizes the changes from the present design. The changes are discussed in detail in the following sections of this report.
Table 3. The 2012 Nationwide Inpatient Sample (NIS) Design Changes
| Feature | Previous Design (1998-2011) | New 2012 Design |
|---|---|---|
| Universe | Included long-term acute care hospitals | Removed long-term acute care hospitals |
| Discharge estimates based on AHA admissions plus births | Discharge estimates based on SID discharges when available (for about 90% of all hospitals); otherwise, based on adjusted AHA counts | |
| Hospitals defined based on AHA IDs | Hospitals defined based on State-supplied hospital identifiers for HCUP states | |
| Sample design | Sample hospitals and then retain all discharges from each sampled hospital | Systematic sample of discharges from all frame hospitals |
Stratified by:
|
Stratified by:
|
|
| Sorted by three-digit hospital ZIP Code within strata before sampling | Sorted by hospital and by DRG and admission month within strata before sampling | |
| Sample without self-weighting requires weights for all estimates | Self-weighting sample requires weights for estimating totals, but not for means and rates | |
| Data elements | Includes State and hospital identifiers and data elements with State-specific coding | Drops State identifiers and data elements that were not available uniformly across the States, such as hospital identifiers, secondary payer, and data elements with State-specific coding Drop hospital weights Retain certain high value State-specific data elements (See Appendix B) |
Abbreviations: AHA, American Hospital Association; DRG, diagnosis-related group; ID, identification numbers; SID, State Inpatient Databases
The Truven Health Analytics team relied on two data sources for our analyses: the 2011 annual hospital survey by the American Hospital Association and the 2011 State Inpatient Databases. The AHA file provides hospital-level information for the universe of community hospitals, including data used to stratify hospitals and the total number of discharges used to calculate sample discharge weights. The SID files comprise the statewide all-payer discharge data that constitute the sampling frame.
Each year, the AHA�s Health Forum administers the AHA Annual Survey of Hospitals. The purpose of the survey is to collect utilization, financial, service, and personnel information on each of the nation�s hospitals. The survey�s overall response rate averages approximately 85 percent each year, which is high for a voluntary survey given its length and the size of the universe (about 6,000 hospitals). For hospitals that do not respond, the AHA imputes items based on prior-year information, so that data are available for all hospitals in the universe.
The hospital universe is defined by all hospitals that were open during any part of the calendar year and were designated as community hospitals in the AHA Annual Survey, excluding rehabilitation hospitals. For purposes of the NIS, the definition of a community hospital is that used by the AHA: "all nonfederal short-term general and other specialty hospitals, excluding hospital units of institutions." Consequently, Veterans Affairs hospitals and other Federal hospitals are excluded. Beginning with the 1998 redesign, rehabilitation hospitals are excluded. Beginning with the 2012 redesign, LTAC hospitals are also excluded.
Previously, the number of universe discharges was estimated using data from the AHA annual hospital survey. In particular, the total number of discharges in the universe was estimated by the sum of births and admissions contained in the AHA annual survey for all hospitals in the universe. HCUP Partners supply over 95 percent of discharges nationwide; therefore, beginning with the 2012 NIS, we will estimate the universe count of discharges within each stratum using the actual count of discharges contained in HCUP data and will use the AHA counts only for non-HCUP hospitals in the universe.
We used the 2011 SID discharge data as a sampling frame to evaluate the sample designs. As mentioned earlier, 46 States contributed a near census of discharges to HCUP in 2011, and these States included over 95 percent of all hospital discharges in the United States. Consequently, the 2011 SID data are comprised of over 95 percent of all U.S. hospital discharges. The participating States were shown earlier in Figure 1.
To compare the alternative sample designs, it was necessary to estimate the "true" national population values for each of the four outcomes of interest. We used 100 percent of all discharges from all community hospitals in all 46 States and weighted these near-census estimates to the population of all 50 States nationwide to obtain "true" population values. Weights were calculated as the ratio of the AHA total counts to the SID discharge totals within each NIS stratum. Because the SID data covered nearly the entire universe, these weights tended to nearly equal 1.
Table 4 provides unweighted 2011 SID values for the outcomes to be considered, overall, and for the age groups, nine census regions, and surgical and medical DRGs.
Table 4. The 2011 State Inpatient Databases Summary Statistics (unweighted)
| Total Discharges | Average Length of Stay, days | Average Charges, $ | Mortality Rate, % | |
|---|---|---|---|---|
| Overall | 35,463,469 | 4.60 | 35,318.46 | 1.90 |
| Age groups, years | ||||
| Missing | 5,568 | 5.21 | 45,104.26 | 2.28 |
| 0-17 | 5,623,140 | 3.82 | 19,623.68 | 0.36 |
| 18-44 | 8,749,171 | 3.63 | 25,660.70 | 0.39 |
| 45-64 | 8,789,873 | 4.98 | 44,185.45 | 1.73 |
| 65+ | 12,295,717 | 5.36 | 42,997.95 | 3.80 |
| Census division | ||||
| New England | 1,597,394 | 4.61 | 26,519.53 | 2.07 |
| Middle Atlantic | 5,398,623 | 5.13 | 40,576.67 | 2.06 |
| East North Central | 5,788,930 | 4.46 | 29,559.81 | 1.73 |
| West North Central | 2,456,314 | 4.28 | 27,138.76 | 1.76 |
| South Atlantic | 7,101,287 | 4.61 | 32,275.57 | 1.91 |
| East South Central | 1,796,483 | 4.70 | 28,666.96 | 2.24 |
| West South Central | 4,230,128 | 4.74 | 35,916.49 | 1.91 |
| Mountain | 2,149,322 | 4.07 | 35,345.25 | 1.45 |
| Pacific | 4,944,988 | 4.37 | 50,519.45 | 1.97 |
| Diagnosis-related group (DRG) | ||||
| Surgical | 9,257,742 | 5.29 | 65,321.08 | 1.34 |
| Medical | 26,168,987 | 4.34 | 24,672.40 | 2.09 |
| Neither* | 36,740 | 9.98 | 61,488.73 | 3.27 |
* DRG 998 and DRG 999 (36,740 discharges) are not classified as either medical or surgical.
Variation is evident in outcomes across the subgroups examined in Table 4. For example, the ALOS in the United States was 4.6 days, but this estimate varied among different age groups from 3.63 days for individuals aged 18-44 years to 5.36 days for those older than 65 years. Among the nine census divisions, ALOS varied from 4.07 to 5.13 days. The average charges were estimated to be approximately $35,000, with the older population generating higher charges. Visible differences were also observed in average charges between the different census divisions. The overall in-hospital mortality rate was estimated at 1.90 percent, with a higher mortality rate for the older population. We evaluated the accuracy of estimates for each sample design by these and other classifications.
Table 5 displays the distribution of hospitals and discharges in the 2011 NIS universe and frame, by census division. The difference between the universe and the frame used to be a major issue for earlier years of the NIS when fewer states participated. However, as shown in Table 5, the frame now includes over 90 percent of hospitals and 95 percent of discharges in the universe. The only census division with less than 80 percent of universe hospitals in the frame is East South Central, with about 73 percent of hospitals in the frame. For eight of the nine census divisions, over 90 percent of universe discharges are included in the sampling frame. The hospital characteristics used for NIS stratification are well represented in the sampling frame for each of the census divisions.
Table 5. Frame versus Universe Hospitals and Discharges by Census Division, 2011
| Census Region / Division | Universe | Sampling Frame | Frame vs. Universe | ||||
|---|---|---|---|---|---|---|---|
| Hospitals | Discharges | Hospitals | Discharges | Frame % of Universe Hospitals | Frame % of Universe Discharges | ||
| United States | 4,988 | 36,939,183 | 4,535 | 35,348,805 | 90.918 | 95.694 | |
| Northeast | All | 647 | 7,124,590 | 610 | 6,980,102 | 94.281 | 97.971 |
| New England | 195 | 1,736,605 | 161 | 1,597,394 | 82.564 | 91.983 | |
| Middle Atlantic | 452 | 5,387,984 | 449 | 5,382,708 | 99.336 | 99.902 | |
| Midwest | All | 1,448 | 8,380,428 | 1,364 | 8,228,491 | 94.198 | 98.187 |
| East North Central | 759 | 5,822,669 | 732 | 5,774,016 | 96.442 | 99.164 | |
| West North Central | 689 | 2,557,759 | 632 | 2,454,475 | 91.727 | 95.961 | |
| South | All | 1,955 | 14,124,594 | 1,698 | 13,059,790 | 86.854 | 92.461 |
| South Atlantic | 735 | 7,349,542 | 711 | 7,085,545 | 96.734 | 96.407 | |
| East South Central | 426 | 2,489,063 | 313 | 1,787,123 | 73.474 | 71.799 | |
| West South Central | 794 | 4,285,988 | 674 | 4,187,122 | 84.886 | 97.693 | |
| West | All | 938 | 7,309,571 | 863 | 7,080,422 | 92.004 | 96.865 |
| Mountain | 393 | 2,303,227 | 335 | 2,144,318 | 85.241 | 93.100 | |
| Pacific | 545 | 5,006,344 | 528 | 4,936,104 | 96.880 | 98.596 | |
We compared two sample designs: the existing NIS design and the stratified systematic design (SYS). For both designs we selected approximately the same number of observations: 8 million discharges, representing approximately 20 percent of the roughly 37 million yearly discharges in the United States.
The Existing NIS design is the sampling strategy used by the current NIS design in which the hospital sample size is equal to approximately 20 percent of the hospital universe within each sampling stratum. Within each stratum, hospitals are sampled at random from the sampling frame. Within each sampled hospital, 100 percent of discharges are included in the existing NIS design. The hospital sampling strata are defined by the following five hospital characteristics:
Geographic regions, composed of the four U.S. census regions: Northeast, Midwest, West, and South. Hospital practice patterns have been shown to vary substantially by region.
Hospital location, defined as urban or rural area hospitals. Government payment policies often differ according to this designation. Also, rural hospitals are generally smaller and offer fewer services than urban hospitals.
Teaching status, for urban hospitals, designated as teaching and nonteaching hospitals. The mission of teaching hospitals differs from that of nonteaching facilities.
Ownership, designated as public (non-Federal government owned), private not-for-profit, or private investor-owned. For some regions, some ownership categories are omitted or collapsed to protect hospital confidentiality, especially where investor-owned hospitals are rare. Hospitals in different ownership categories tend to have different missions and different responses to government regulations and policies.
Hospital size, split into small, medium, or large hospitals. Hospital size categories are based on the number of hospital beds and are specific to the hospital's region, location, and teaching status.
For improved geographic representation, within each stratum the frame of community hospitals was sorted by their State and the hospital�s three-digit ZIP Code (the first 3 digits of the common five-digit ZIP Code). Hospitals with three-digit codes that are proximal are generally near one another within a State. Within each stratum, a systematic random sample of hospitals of up to 20 percent of the total number of U.S. hospitals was selected from the sorted list of hospitals. The sample was constrained to have at least two hospitals from each stratum occasionally requiring adjacent strata to be merged. When there were insufficient numbers of hospitals within a stratum to meet the 20 percent sampling goal, all of the available hospitals were selected. Every community hospital in the sampling frame has a chance of being selected.
The strata for the SYS design are the same as those for the NIS sample design except that the four census regions are replaced by the nine census divisions—New England, Middle Atlantic, East North Central, West North Central, South Atlantic, East South Central, West South Central, Mountain, and Pacific.
This design calls for a sample of discharges from all hospitals, selected from an ordered sampling frame within the strata. Within each stratum all discharges are sorted in the following order on patient-level "control" variables: encrypted hospital ID, diagnosis related group (DRG), admission month, and a random number.
Within each stratum, a number of discharges proportionate to the number of discharges in the universe are selected systematically from the sorted list. For example, if the sampling frame was equal to the universe and 20 percent of the universe was required, then every fifth discharge would be selected from the sorted list of discharges, beginning with a randomly selected start at discharge number 1, 2, 3, 4, or 5 on the list. To ensure a self-weighted sample that has 20 percent of the universe within each stratum represented, sampling rates would vary within each stratum, depending on the proportion of the population of discharges covered by the discharges in the sampling frame. Thus, the sampling rate would not always be 20 percent within each stratum. For strata that were missing more discharges, the sampling rate would be higher to ensure that the number of sampled discharges would equal 20 percent of the universe. In our study, the overall sample size of 8 million was chosen for conformance with the current NIS design so that sample size could be ruled out as a factor in comparing the performance among the alternative sample designs.
Using this procedure, the sampling rates ensure that the SYS is a self-weighted sample (i.e., discharges will have equal sample weights). The sorting of discharges ensures representativeness on characteristics such as DRG and admission date. This systematic sampling is similar to stratified simple random sampling, but it has the potential to be more efficient if the factors on which the list is ordered are correlated with outcomes of interest such as average length of stay (ALOS), average charges, and mortality rates.
We note that systematic sampling can be vulnerable to periodicities of the discharges being selected. For example, suppose there were two groups, A and B, each with two discharges in the sampling frame, and the two groups of discharges always followed one another in the sorted list of discharges. If every fifth discharge was selected, it would be impossible to select a discharge from both group A and group B into the sample. However, it would be possible to select discharges from both groups using simple random sampling. Thus, these phenomena can theoretically lead to a sample unrepresentative of the overall population, making the design potentially less desirable than a nonsystematic sampling design. However, the random ordering of discharges within the other control factors is intended to counteract the effects of periodicities and we concluded that the benefit of a more representative sample outweighed the risk of bias due to any remaining periodicities in the data.
To evaluate the performance of the NIS and SYS designs, we estimated four outcomes—
A sample design will be considered best for a specific population parameter (e.g., total, mean, or rate) if it generates the most accurate estimate when compared to the true parameter value (for which we derive an estimate described in the next section). An accurate estimate is one that is typically close to the parameter of interest, providing the minimum error (or bias) and the best precision.
Formally, we follow the convention of using the term "accurate" to describe an estimator with low root mean-squared error (RMSE)—the square root of the mean-square error (MSE), which is the mean squared difference between the estimate and the true population value. The MSE can be expressed as bias squared plus variance (the measure of precision), two statistics that measure different aspects of estimate inaccuracy. Therefore, the design with the smallest MSE tends to provide the best tradeoff between bias and variance.
For unbiased estimates the RMSE is equivalent to the standard error. Typically, the half-width of a confidence interval for the outcome statistic is a multiple of the standard error. For example, under normality a 95 percent confidence interval would have a half-width of 1.96 times the standard error. This half-width is called the Margin of Error for the estimated outcome. We will express accuracy in terms of the relative Margin of Error, as explained next.
For ease of comparison, a relative margin of error (RME) was obtained by dividing the RMSE for the SYS design by the RMSE of the present NIS design.
RME = (SYS Margin of Error)divided into(Existing NIS Margin of Error)
Values of RME smaller than 1 mean that the SYS design performed better than the current existing NIS design, whereas RME values greater than 1 indicate the superiority of the existing NIS design over the SYS design. We made comparisons for total national estimates as well as for estimates by age group and by census division. We also made comparisons for all DRGs, but we report only summaries across DRGs overall and separately across medical and surgical DRGs.
Nearly all analyses of the NIS employ infinite population inferences, thus our calculation of the MSE should be based on infinite population statistics. Using mortality as an example, most analysts would be concerned with the �long-run� or �underlying� mortality rates at hospitals, not the observed mortality rates. The concept of a "long-run" or "underlying" statistic is embodied by infinite population inferences in which estimates from small samples usually have relatively large variances.20
Consequently, for this study we generated 500 different populations using a technique called bootstrapping. This technique draws a random sample of H hospitals with replacement from the finite universe of H hospitals (represented by all H hospitals in the annual AHA survey). This creates a new population of hospitals. For each new population of hospitals, the technique then draws a random sample of D(h) discharges with replacement from the finite population of D(h) discharges at hospital h. This process simulates 500 potential hospital and discharge populations drawn from an infinite universe of possible populations. This infinite universe is sometimes called a "superpopulation." For each bootstrap population we drew samples according to each of the two designs and we estimated outcomes and calculated errors, as described below.
Using the bootstrap to generate different populations makes sense intuitively. The mix of patients (and their outcomes) at an individual hospital is subject to random influences. For example, local disease outbreaks or natural disasters can have a substantial effect on the mix of conditions a hospital treats during any period. Also, something as simple as the timing of a patient�s admission to the hospital can affect their outcome because of differences in factors such as hospital staffing and the availability of resources at different times of the day on different days of the week and different times of the year.
We performed a stratified version of bootstrapping: hospitals were randomly selected within each hospital stratum and then we bootstrapped discharges within each hospital. The stratified bootstrap keeps the proportion of hospitals in each hospital stratum constant across the 500 bootstrap samples. For example, the number of teaching hospitals was the same in every stratified bootstrap population.
The rationale for the stratified bootstrap is that the mix of hospital types defined by the hospital sampling strata should remain fixed and not randomly vary among the populations drawn from the "superpopulation." For example, an unstratified bootstrap would allow the proportion of rural hospitals to vary from population to population causing discharge types to vary unrealistically at the national level because there are large overall differences between the types of discharges served by rural and urban hospitals. On the other hand, the stratified bootstrap allows the types of discharges to vary realistically within rural hospitals and within urban hospitals.
For each of the 500 bootstrap populations, we sampled discharges according to each of the two sample designs: the existing NIS design and the SYS design.
For each bootstrap population, we estimated the "true" population value of each statistic by weighting the discharges in the full SID, which is a near-census of discharges in the true population to that particular bootstrap population. Consequently, for each population, these weighted SID estimates represent a very good approximation to the "true" bootstrap population value of the statistics for each of the outcomes of interest. The "true" superpopulation value of each statistic was estimated as the average of the 500 bootstrap population "true" values.
We then estimated the MSE for each design as the average squared difference between the 500 sample estimates and the single superpopulation "true" value (the average across all bootstrapped samples) that remained fixed over the 500 samples. This yielded the MSE for infinite population inferences.
As described earlier, two types of changes were planned for the 2012 NIS. First, the definition of the universe was revised. Second, the sample design switched from the original NIS design to the new NIS design, the systematic sample (SYS).
The modifications to the universe have effects that are independent of the switch from the original NIS design to the SYS design. Both sample designs yield unbiased estimates—regardless of whether we use the old universe definition or the new universe definition—because both samples are weighted to whichever universe definition is in effect.21 For example, the removal of LTAC hospitals reduces the number of discharges in the universe equally for both sample designs. In section 5.1, we report these global effects.
Last year's report, based on 2010 data for the original universe definition, showed that the switch from the original NIS design to the new SYS design significantly reduced the margin of error for sample estimates. In section 5.2, we report estimated design effects on margins of error using 2011 data and the new universe definition, thus addressing both types of changes.
As discussed in an earlier chapter, there are three modifications related to the universe of hospitals and discharges:
Table 6 through Table 9 show the incremental effects of these modifications on the following universe statistics:
Statistics were also broken out by age groups and census divisions. These values were estimated using 100 percent of the 2011 SID data, representing about 95 percent of all discharges nationwide, weighted up to the universe using 2011 AHA survey data. Consequently, these are very precise finite-population estimates of these statistics for the 2011 universe under the different universe definitions.
For ease of reference, the columns are numbered. There are four column pairs:
For each column pair, the first contains the value of the statistic and the second contains the value of the statistic as a percentage of the figure shown in column 1. Therefore, the percentages represent the statistic under the indicated universe definition as a percentage of the statistic under the original universe definition. For example, column 7 of Table 6 shows that, using the completely modified definition of the universe, there were an estimated 36,939,183 discharges nationally for 2011. Column 8 shows that this represents 95.7 percent of the estimated total number of discharges using the original universe definition shown in column 1.
Table 6 contains the results for discharge counts, which are affected by the universe definition. Looking first at the row labeled "U.S." we see that the removal of LTAC hospitals (columns 3 and 4) resulted in a decrease of 0.7 percent of discharges nationwide from 38,590,733 discharges to 38,338,545 discharges (decreased to 99.3 percent of the original discharge count).
Next, using SID discharge counts in place of AHA discharge counts (columns 5 and 6) resulted in a further decrease of about 3.6 percent, for an overall decrease of 4.3 percent including the removal of LTAC hospitals (decreased to 95.7 percent of the original discharge count).
Finally, using SID hospital identifiers in place of AHA identifiers (columns 7 and 8) resulted in a negligible incremental change (compared with columns 5 and 6) in the total discharge count. Consequently, although the elimination of LTAC hospitals decreased the number of discharges in the universe by 0.7 percent, most of the 4.3 percent overall decrease was caused by the switch from AHA survey counts to SID counts of discharges in the universe.
Based on analyses of Illinois data, there is evidence that the AHA count is higher than the SID count in the aggregate, partly because of the double counting of NICU newborns, but mostly because the AHA counts tend to include long-term care (LTC) and swing bed admissions, which may not be included in the SID counts, depending on the state.
Using supplemental 2010 and 2011 data from the Illinois Department of Public Health (DOPH), we confirmed that the AHA survey count for Illinois included LTC and swing bed admissions, whereas their HCUP SID data did not. The SID discharge counts agreed with counts from the Health Department data after eliminating the double-counting of newborns in NICUs and after eliminating long term care and swing bed admissions (see Appendix A for details of this analysis).
For HCUP SID data more generally, it is likely that some hospitals include LTC and swing bed admissions in their SID data. Likewise, some hospitals (such as those in Illinois) probably include these discharges in their AHA survey responses.
Table 6. Incremental Impact of Changes to the Universe on Universe Discharge Counts, 2011
| Old Universe Definition (1998�2011) | Impact of Incremental Modifications to the Universe | |||||||
|---|---|---|---|---|---|---|---|---|
| Exclude LTAC Hospitals | ||||||||
| Use AHA Discharge Counts | Use SID Discharge Counts† | |||||||
| Use AHA Hospital ID | Use AHA Hospital ID | New Universe Definition Use SID Hospital ID | ||||||
| Total Discharges | % of Original Discharges | Total Discharges | % of Original Discharges | Total Discharges | % of Original Discharges | Total Discharges | % of Original Discharges | |
| Column Number | 1 | 2 | 3 | 4 | 5 | 6 | 7 | 8 |
| U.S. | 38,590,733 | 100.0 | 38,338,545 | 99.3 | 36,935,306 | 95.7 | 36,939,183 | 95.7 |
| New England | 1,816,085 | 100.0 | 1,802,470 | 99.3 | 1,736,605 | 95.6 | 1,736,605 | 95.6 |
| Middle Atlantic | 5,712,173 | 100.0 | 5,670,498 | 99.3 | 5,387,554 | 94.3 | 5,387,984 | 94.3 |
| East North Central | 6,047,665 | 100.0 | 6,003,154 | 99.3 | 5,822,669 | 96.3 | 5,822,669 | 96.3 |
| West North Central | 2,721,135 | 100.0 | 2,713,288 | 99.7 | 2,557,759 | 94.0 | 2,557,759 | 94.0 |
| South Atlantic | 7,630,673 | 100.0 | 7,598,619 | 99.6 | 7,349,295 | 96.3 | 7,349,542 | 96.3 |
| East South Central | 2,594,411 | 100.0 | 2,576,922 | 99.3 | 2,489,063 | 95.9 | 2,489,063 | 95.9 |
| West South Central | 4,577,845 | 100.0 | 4,510,425 | 98.5 | 4,282,943 | 93.6 | 4,285,988 | 93.6 |
| Mountain | 2,370,201 | 100.0 | 2,353,402 | 99.3 | 2,303,074 | 97.2 | 2,303,227 | 97.2 |
| Pacific | 5,120,545 | 100.0 | 5,109,767 | 99.8 | 5,006,344 | 97.8 | 5,006,344 | 97.8 |
| Age Missing | 5,985 | 100.0 | 5,934 | 99.1 | 5,696 | 95.2 | 5,697 | 95.2 |
| Age 0-17 | 6,096,152 | 100.0 | 6,080,673 | 99.7 | 5,859,144 | 96.1 | 5,861,730 | 96.2 |
| Age 18-44 | 9,502,108 | 100.0 | 9,462,878 | 99.6 | 9,121,651 | 96.0 | 9,123,630 | 96.0 |
| Age 45-64 | 9,571,581 | 100.0 | 9,503,456 | 99.3 | 9,158,076 | 95.7 | 9,159,189 | 95.7 |
| Age 65+ | 13,414,907 | 100.0 | 13,285,604 | 99.0 | 12,790,738 | 95.3 | 12,788,936 | 95.3 |
† When discharge counts or hospital identifiers are not available from the SID, estimates from the AHA will be used. This is expected to affect fewer than 10 percent of hospitals.
Abbreviations: AHA, American Hospital Association; ID, identification number; LTAC, long-term acute care; SID, State Inpatient Databases
Unfortunately, there is no way to consistently identify hospitals that include LTC and swing bed discharges in the SID. Further, it is rare to find survey data such as the Illinois DOPH survey that is independent of both the SID and the AHA survey and that contains separate counts for NICU newborns, LTC admissions, and swing bed admissions. Thus, it was not possible to perform analyses using data from multiple States.
Nevertheless, in 2011 the Illinois SID count was 95.9 percent of the AHA count, which is very close to the 95.7 percent figure for the United States as a whole (shown in column 8 of Table 6). Figure 4 shows the SID count as a percentage of the AHA count for each HCUP state for facilities that could be matched between the SID and the AHA. As shown in Figure 4, in 2011 the HCUP SID count fell short of the AHA count for all but three States. Therefore, we speculate that the Illinois mismatch between the AHA count and the SID count is often repeated in other HCUP States, with the result that the AHA count includes a class of discharges that is not generally present in the SID data. We concluded that LTC and swing bed discharges should be �removed� from the universe control total�the sample weight numerator�because these discharges are probably not well represented in the sample data. Therefore, in addition to the other reasons listed in section 1.4.3, we switched to using the SID count to effectively accomplish this removal.
Returning to Table 6, we note that the percentages in column 8 vary moderately across census divisions, ranging from 93.6 percent to 97.8 percent, and vary slightly across age groups, ranging from 95.2 percent to 96.2 percent. Part of the variation is explained by the varying impact of removing LTAC hospitals. For example, in the West South Central region there was a 1.5 percent decrease attributable to the removal of LTAC hospitals (column 4), compared with a 0.7 percent decrease overall. Likewise, the impact of LTAC hospitals was greater for the older age groups compared with the younger age groups, which is consistent with the demographics of LTAC patients.
Table 7 shows the impact of the universe definitions on ALOS. The same column pairs appear in this table as in Table 6. The percentages represent the ALOS under the specific universe definition, compared with the ALOS under the original universe definition shown in column 1. For ALOS, the elimination of LTAC hospitals had the greatest impact and the use of SID discharge counts and SID hospital identifiers had very little additional impact. ALOS tended to be higher for patients in LTAC hospitals compared with patients in non-LTAC hospitals. Consequently, removal of LTAC hospitals caused the ALOS to decrease by about 1.5 percent overall (column 4). Again, consistent with the demographics of patients in LTAC hospitals, the overall decrease was greatest for the oldest age groups.
Table 8 shows the impact of the universe definitions on average hospital charges. The pattern here was very similar to the pattern in Table 7 for ALOS. In particular, there was a nationwide decrease of about 0.7 percent (U.S. in column 4) in average charges, because average charges for patients in LTAC hospitals tended to be higher than those for patients in non-LTAC hospitals, and the impact is greater for the older age groups. This culminated in a 1.0 percent reduction for the oldest age group (age 65+ in column 4). Again, use of SID discharge counts and SID hospital identifiers had negligible effects after accounting for the effect of LTAC hospitals.
Figure 4: SID Percentage of AHA Discharge Count, by State, 2011
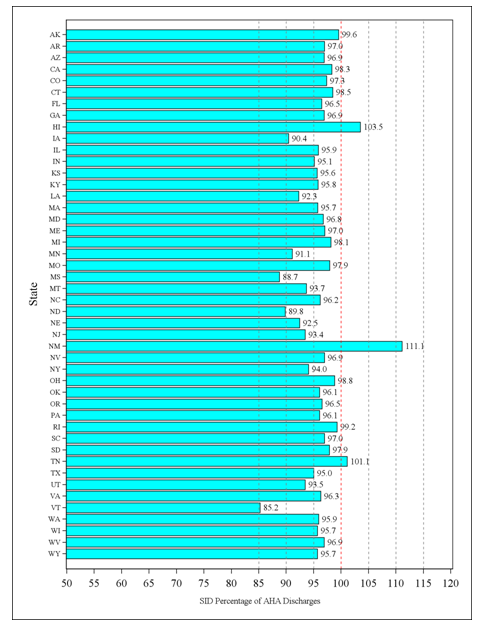
Figure 4 shows the SID count as a percentage of the AHA count for each HCUP state for facilities that could be matched between the SID and the AHA. As shown in Figure 4, in 2011 the HCUP SID count fell short of the AHA count for all but three States.
Table 9 shows the impact of the universe definitions on in-hospital mortality rates. The pattern for mortality mirrored that for ALOS and charges. The exclusion of LTAC hospitals accounted for virtually all of the mortality rate decreases. Overall, the mortality proportion decreased by 2 percent (column 8 for the U.S. as a whole), from .01905 to .01866, and the decrease was greatest for the oldest age groups.
In summary, the modifications to the universe definitions will result in one-time overall national shifts of about 4.3 percent downward for the discharge count, 1.5 percent downward for ALOS, 0.5 percent downward for average charges, and 2.0 percent downward for in-hospital mortality. These downward shifts will be evident in overall NIS trends. These shifts will have different magnitudes for different subsets of the NIS and for different diagnostic categories. For example, the shifts for most outcomes will be greater for older patients than they will be for younger patients. In turn, the shifts will tend to be greater for conditions (and their treatments) associated with higher proportions of older patients. Therefore, analysts will need to take extra care in interpreting trends estimated from the NIS that cross the 2012 data year. We address this further in our conclusions at the end of this report.
Table 7. Incremental Impact of Changes to the Universe on Universe Average Length of Stay (ALOS), 2011
| Old Universe Definition | Impact of Incremental Modifications to the Universe | |||||||
|---|---|---|---|---|---|---|---|---|
| Exclude LTAC Hospitals | ||||||||
| Use AHA Discharge Counts | Use SID Discharge Counts* | |||||||
| Use AHA Hospital ID | Use AHA Hospital ID | New Universe Definition Use SID Hospital ID | ||||||
| ALOS | % of Original ALOS | ALOS | % of Original ALOS | ALOS | % of Original ALOS | ALOS | % of Original ALOS | |
| Column Number | 1 | 2 | 3 | 4 | 5 | 6 | 7 | 8 |
| U.S. | 4.59 | 100.0 | 4.53 | 98.5 | 4.52 | 98.5 | 4.53 | 98.5 |
| New England | 4.56 | 100.0 | 4.56 | 100.1 | 4.57 | 100.3 | 4.57 | 100.3 |
| Middle Atlantic | 5.13 | 100.0 | 5.07 | 98.8 | 5.07 | 98.8 | 5.07 | 98.8 |
| East North Central | 4.45 | 100.0 | 4.40 | 98.7 | 4.40 | 98.8 | 4.40 | 98.8 |
| West North Central | 4.28 | 100.0 | 4.26 | 99.6 | 4.26 | 99.6 | 4.26 | 99.6 |
| South Atlantic | 4.61 | 100.0 | 4.56 | 99.0 | 4.57 | 99.0 | 4.57 | 99.0 |
| East South Central | 4.70 | 100.0 | 4.65 | 98.9 | 4.65 | 99.0 | 4.66 | 99.3 |
| West South Central | 4.74 | 100.0 | 4.51 | 95.2 | 4.51 | 95.1 | 4.51 | 95.1 |
| Mountain | 4.10 | 100.0 | 4.03 | 98.3 | 4.01 | 98.0 | 4.01 | 98.0 |
| Pacific | 4.36 | 100.0 | 4.33 | 99.2 | 4.33 | 99.2 | 4.33 | 99.2 |
| Age Missing | 5.21 | 100.0 | 5.17 | 99.2 | 5.17 | 99.2 | 5.17 | 99.2 |
| Age 0-17 | 3.82 | 100.0 | 3.82 | 100.1 | 3.82 | 100.0 | 3.82 | 100.1 |
| Age 18-44 | 3.63 | 100.0 | 3.61 | 99.5 | 3.61 | 99.4 | 3.61 | 99.4 |
| Age 45-64 | 4.97 | 100.0 | 4.89 | 98.4 | 4.89 | 98.4 | 4.89 | 98.4 |
| Age 65+ | 5.36 | 100.0 | 5.24 | 97.7 | 5.24 | 97.7 | 5.24 | 97.8 |
* When discharge counts or hospital identifiers are not available from the SID, estimates from the AHA will be used. This is expected to affect fewer than 10 percent of hospitals.
Abbreviations: AHA, American Hospital Association; ID, identification number; LTAC, long-term acute care; SID, State Inpatient Databases
Table 8. Incremental Impact of Changes to the Universe on Universe Average Total Charges, 2011
| Old Universe Definition | Impact of Incremental Modifications to the Universe | |||||||
|---|---|---|---|---|---|---|---|---|
| Exclude LTAC Hospitals | ||||||||
| Use AHA Discharge Counts | Use SID Discharge Counts* | |||||||
| Use AHA Hospital ID | Use AHA Hospital ID | New Universe Definition Use SID Hospital ID | ||||||
| Average Charges U.S. $ | % of Original Average Charges | Average Charges U.S. $ | % of Original Average Charges | Average Charges U.S. $ | % of Original Average Charges | Average Charges U.S. $ | % of Original Average Charges | |
| Column Number | 1 | 2 | 3 | 4 | 5 | 6 | 7 | 8 |
| U.S. | 34,962 | 100.0 | 34,711 | 99.3 | 34,779 | 99.5 | 34,790 | 99.5 |
| New England | 25,498 | 100.0 | 25,569 | 100.3 | 25,730 | 100.9 | 25,731 | 100.9 |
| Middle Atlantic | 40,513 | 100.0 | 40,343 | 99.6 | 40,378 | 99.7 | 40,377 | 99.7 |
| East North Central | 29,470 | 100.0 | 29,295 | 99.4 | 29,317 | 99.5 | 29,317 | 99.5 |
| West North Central | 27,032 | 100.0 | 26,985 | 99.8 | 27,096 | 100.2 | 27,099 | 100.2 |
| South Atlantic | 32,187 | 100.0 | 31,979 | 99.4 | 32,031 | 99.5 | 32,051 | 99.6 |
| East South Central | 28,828 | 100.0 | 28,631 | 99.3 | 28,778 | 99.8 | 28,852 | 100.1 |
| West South Central | 35,597 | 100.0 | 34,649 | 97.3 | 34,662 | 97.4 | 34,666 | 97.4 |
| Mountain | 35,183 | 100.0 | 34,981 | 99.4 | 34,948 | 99.3 | 34,951 | 99.3 |
| Pacific | 50,462 | 100.0 | 50,279 | 99.6 | 50,282 | 99.6 | 50,288 | 99.7 |
| Age Missing | 44,856 | 100.0 | 44,308 | 98.8 | 44,345 | 98.9 | 44,350 | 98.9 |
| Age 0-17 | 19,446 | 100.0 | 19,476 | 100.2 | 19,476 | 100.2 | 19,491 | 100.2 |
| Age 18-44 | 25,458 | 100.0 | 25,398 | 99.8 | 25,433 | 99.9 | 25,434 | 99.9 |
| Age 45-64 | 43,767 | 100.0 | 43,496 | 99.4 | 43,575 | 99.6 | 43,590 | 99.6 |
| Age 65+ | 42,431 | 100.0 | 42,001 | 99.0 | 42,124 | 99.3 | 42,142 | 99.3 |
* When discharge counts or hospital identifiers are not available from the SID, estimates from the AHA will be used. This is expected to affect fewer than 10 percent of hospitals.
Abbreviations: AHA, American Hospital Association; ID, identification number; LTAC, long-term acute care; SID, State Inpatient Databases
Table 9. Incremental Impact of Changes to the Universe on Universe In-Hospital Mortality Rates, 2011
| Old Universe Definition | Impact of Incremental Modifications to the Universe | |||||||
|---|---|---|---|---|---|---|---|---|
| Exclude LTAC Hospitals | ||||||||
| Use AHA Discharge Counts | Use SID Discharge Counts* | |||||||
| Use AHA Hospital ID | Use AHA Hospital ID | New Universe Definition Use SID Hospital ID | ||||||
| Mortality Rate | % of Original Mortality Rate | Mortality Rate | % of Original Mortality Rate | Mortality Rate | % of Original Mortality Rate | Mortality Rate | % of Original Mortality Rate | |
| Column Number | 1 | 2 | 3 | 4 | 5 | 6 | 7 | 8 |
| U.S. | 0.01905 | 100.0 | 0.01867 | 98.0 | 0.01866 | 97.9 | 0.01866 | 98.0 |
| New England | 0.02075 | 100.0 | 0.02075 | 100.0 | 0.02073 | 99.9 | 0.02073 | 99.9 |
| Middle Atlantic | 0.02060 | 100.0 | 0.01987 | 96.5 | 0.01988 | 96.5 | 0.01987 | 96.5 |
| East North Central | 0.01727 | 100.0 | 0.01706 | 98.8 | 0.01707 | 98.8 | 0.01707 | 98.8 |
| West North Central | 0.01761 | 100.0 | 0.01754 | 99.6 | 0.01752 | 99.5 | 0.01752 | 99.5 |
| South Atlantic | 0.01913 | 100.0 | 0.01882 | 98.4 | 0.01883 | 98.5 | 0.01883 | 98.4 |
| East South Central | 0.02230 | 100.0 | 0.02199 | 98.6 | 0.02198 | 98.6 | 0.02210 | 99.1 |
| West South Central | 0.01921 | 100.0 | 0.01818 | 94.6 | 0.01816 | 94.5 | 0.01816 | 94.5 |
| Mountain | 0.01462 | 100.0 | 0.01446 | 98.9 | 0.01440 | 98.5 | 0.01440 | 98.5 |
| Pacific | 0.01975 | 100.0 | 0.01954 | 99.0 | 0.01952 | 98.9 | 0.01952 | 98.9 |
| Age Missing | 0.02309 | 100.0 | 0.02230 | 96.6 | 0.02229 | 96.5 | 0.02226 | 96.4 |
| Age 0-17 | 0.00360 | 100.0 | 0.00360 | 100.1 | 0.00360 | 100.1 | 0.00361 | 100.2 |
| Age 18-44 | 0.00386 | 100.0 | 0.00383 | 99.3 | 0.00384 | 99.3 | 0.00384 | 99.4 |
| Age 45-64 | 0.01729 | 100.0 | 0.01704 | 98.6 | 0.01704 | 98.6 | 0.01706 | 98.7 |
| Age 65+ | 0.03809 | 100.0 | 0.03729 | 97.9 | 0.03728 | 97.9 | 0.03729 | 97.9 |
* When discharge counts or hospital identifiers are not available from the SID, estimates from the AHA will be used. This is expected to affect fewer than 10 percent of hospitals.
Abbreviations: AHA, American Hospital Association; ID, identification number; LTAC, long-term acute care; SID, State Inpatient Databases
Last year, we compared three alternative NIS sample designs by calculating several statistics using 2010 data and concluded that the systematic (SYS) design was preferable because it resulted in substantial decreases in the margin of error for estimates; hence, SYS-generated estimates had greater precision. Consequently, for this year�s analysis (presented in this report), we compared only the original NIS design to the SYS design using 2011 data. The main reason for this comparison was to ensure that the modifications to the universe described in section 5.1 had no serious effects on the reductions in the margins of error previously estimated for the SYS design compared with the original NIS design.
As shown in section 5.1, the modifications to the universe resulted in a significant reduction in the total number of discharges in the universe and resulted in smaller changes for national estimates of ALOS, total charges, and hospital mortality using 2011 data. Therefore, modifications to the universe will cause shifts in the levels of sample estimates for totals, means, and rates, which would occur regardless of the sample design. The analyses in this section will assess the impact of modifying the definition of the universe on sampling error.
We measured the difference in sampling error between the two designs (original NIS versus SYS) by the relative margin of error (RME). The RME expresses the margin of error of the estimated outcome under the SYS design as a multiple of the margin of error for the estimated outcome under the original NIS design. Therefore, RME values less than 1.0 indicate that the SYS design produces estimates with lower sampling error compared with the original NIS design. The RME values in this report used 2011 data to estimate values for the new universe definition. As we will show, the values based on the new universe definition are very close to the RME values in last year�s report, which were based on 2010 data used to estimate values for the old universe.22 Consequently, in the new universe, the SYS design continues to enjoy the originally estimated reductions in sampling error.
We calculated the RME for national estimates overall, by age group, and by census division. In addition, RME was calculated by DRG, but rather than report the statistics for each of the 75223 DRGs individually, we use box plots and scatter plots to summarize the distribution of RME across all DRGs and separately summarize the medical DRGs and surgical DRGs. We estimated the RME corresponding to each incremental change in the universe definition—
The results in this section are based on the stratified bootstrap algorithm described in the methods section. As explained in the methods section, these statistics are calculated from a superpopulation perspective,26 which is consistent with most uses of the NIS. Consequently, the RME values are not adjusted by finite population correction factors.
5.2.1 Overall Results
The RME values for national estimates are shown in Table 10. The columns are numbered for easy reference. Columns 1 and 2 contain the RME values using 2010 data and 2011 data, respectively, under the old universe definition. The differences between columns 1 and 2 are caused solely from using data from two different years. The remaining columns are all based on 2011 data, and each succeeding column corresponds to the RME values corresponding to an incremental change in the universe, based on column 2. Column 3 contains the RME values when LTAC hospitals are excluded from the old universe. Column 4 contains RME values when LTAC hospitals are excluded and SID discharge counts are used in place of AHA discharge counts to estimate sample weights. Finally, column 5 contains RME values when all modifications are in effect, including the use of SID hospital identifiers in place of AHA hospital identifiers to designate separate hospital entities. Therefore, the values in column 5 represent our best estimate of the effect of the SYS design on the relative margins of error that can be expected under the new universe definition.
Table 10. Relative Margin of Error (RME) for National Estimates, Overall
| Old Universe Definition | Impact of Incremental Modifications to the Universe, 2011 Data | ||||
|---|---|---|---|---|---|
| 2010 Data | 2011 Data | Exclude LTAC Hospitals | |||
| Use AHA Discharge Counts | Use SID Discharge Counts* | ||||
| Use AHA Hospital ID | Use AHA Hospital ID | New Universe Definition Use SID Hospital ID (Final New NIS Design) | |||
| Column # | 1 | 2 | 3 | 4 | 5 |
| Discharges | 1.00 | 1.00 | 1.00 | 1.00 | 1.00 |
| ALOS | 0.54 | 0.53 | 0.52 | 0.52 | 0.53 |
| Average charges | 0.56 | 0.55 | 0.58 | 0.57 | 0.55 |
| Mortality | 0.53 | 0.57 | 0.55 | 0.55 | 0.51 |
* When discharge counts or hospital identifiers are not available from the SID, estimates from the AHA will be used. This is expected to affect fewer than 10 percent of hospitals.
Abbreviations: AHA, American Hospital Association; ID, identification number; LTAC, long-term acute care; SID, State Inpatient Databases
For each outcome, the RME values differ little across the columns. Consequently, at the national level, the RMEs were unaffected by changes to the universe definition.
By design, all samples were weighted so that the sum of the weights equaled the national population of discharges calculated for the universe. Thus, at the national level and across all discharges, the estimated discharge totals were equal for both the SYS and the original NIS design. This caused all of the RMEs to equal 1 for this particular outcome at the national level.
On the other outcomes, the SYS design outperformed the original NIS design by a substantial margin. The RME can be interpreted as the ratio of the width of a confidence interval estimated under the SYS design to that estimated under the original NIS design. For example, the width of a confidence interval for ALOS estimated from a sample under the SYS design was about one-half (53 percent) as wide as the width of a confidence interval for ALOS estimated under the original NIS design.
The superior performance of the SYS is not surprising, because patient characteristics and mean outcomes vary significantly among hospitals. Variation in mean outcomes such as ALOS, charges, and mortality rates for discharges among hospitals causes a net loss of information in a design that draws a sample of hospitals, compared with a design that draws the same total number of discharges across the entire spectrum of hospitals participating in HCUP. As a result, even when stratified by hospital characteristics, there can be considerable variation in mean outcomes estimated from one hospital sample to the next, depending on which hospitals are selected for the sample. The SYS sample strategy, which selects a sample of discharges from all hospitals, better represents the entire universe of hospitals and increases the information in the total sample of discharges. This produces more accurate and more consistent sample estimates.
5.2.2 Results by Age Group
Table 11 contains the estimates of RME at the national level for four age groups. Similar to the overall results, the RME estimates indicated better performances for the SYS design compared with the original NIS design. There is little difference in the RME across columns, which indicates that the new universe has not compromised the substantial improvements estimated last year for the SYS design.
Column 5 contains the RMEs for the redesign based on the new universe definition. The RME for total discharges ranged between 0.56 and 0.76, which is well below 1.0 for all age groups. The RME for the youngest age group (0.56) was substantially lower than the RMEs for the older age groups (0.71-0.76). This is likely because discharges from children�s hospitals, whose patients are all in the youngest age group, are sampled uniformly by the SYS design. In contrast, the existing NIS design includes some children�s hospitals and excludes others. This would lead to more variability in discharge estimates using the existing design, resulting in a bigger improvement under the SYS design for the youngest age group compared with the older age groups. The RMEs for the other outcomes are even lower, ranging between 0.50 and 0.56 across age groups. The low RMEs for the 0�17 age group raise questions about the need for a nationwide Kids' Inpatient Database (KID) after the NIS redesign is implemented; however, this will be evaluated in the future after the production of the KID using 2012 data (the next scheduled release of the KID).
5.2.3 Results by Census Division
The RMEs for each census division are reported in Table 12. The SYS design outperformed the original NIS design by a wide margin in every division. Again, there was little difference in RME values across the columns 2 through 5, which means that the changes to the universe had little impact on the RME values originally estimated for the SYS design. Differences between columns 1 and 2 were driven solely by sampling variability and by differences between the 2010 and 2011 data.27
Table 11. Relative Margin of Error (RME) for National Estimates, By Age Group
| Outcome | Age Group | Old Universe Definition | Impact of Incremental Modifications to the Universe, 2011 Data | |||
|---|---|---|---|---|---|---|
| 2010 Data | 2011 Data | Exclude LTAC Hospitals | ||||
| Use AHA Discharge Counts | Use SID Discharge Counts* | |||||
| Use AHA Hospital ID | Use AHA Hospital ID | New Universe Definition Use SID Hospital ID | ||||
| Column # | 1 | 2 | 3 | 4 | 5 | |
| Discharges | 0-17 | 0.60 | 0.61 | 0.58 | 0.58 | 0.56 |
| 18-44 | 0.78 | 0.83 | 0.76 | 0.77 | 0.76 | |
| 45-64 | 0.76 | 0.74 | 0.74 | 0.76 | 0.71 | |
| 65+ | 0.68 | 0.74 | 0.75 | 0.76 | 0.71 | |
| ALOS | 0-17 | 0.50 | 0.54 | 0.51 | 0.51 | 0.52 |
| 18-44 | 0.53 | 0.51 | 0.50 | 0.50 | 0.50 | |
| 45-64 | 0.57 | 0.53 | 0.51 | 0.50 | 0.52 | |
| 65+ | 0.53 | 0.54 | 0.55 | 0.57 | 0.55 | |
| Charges | 0-17 | 0.49 | 0.52 | 0.53 | 0.53 | 0.52 |
| 18-44 | 0.56 | 0.54 | 0.57 | 0.57 | 0.53 | |
| 45-64 | 0.59 | 0.55 | 0.56 | 0.55 | 0.55 | |
| 65+ | 0.56 | 0.56 | 0.57 | 0.57 | 0.56 | |
| Mortality | 0-17 | 0.52 | 0.53 | 0.55 | 0.53 | 0.56 |
| 18-44 | 0.57 | 0.55 | 0.55 | 0.55 | 0.55 | |
| 45-64 | 0.55 | 0.60 | 0.57 | 0.57 | 0.56 | |
| 65+ | 0.51 | 0.57 | 0.56 | 0.55 | 0.56 | |
* When discharge counts or hospital identifiers are not available from the SID, estimates from the AHA will be used. This is expected to affect fewer than 10 percent of hospitals.
Abbreviations: AHA, American Hospital Association; ALOS, average length of stay; ID, identification number; LTAC, long-term acute care; SID, State Inpatient Databases
Table 12. Relative Margin of Error (RME) for National Estimates, By Census Division
| Outcome | Census Division | Old Universe Definition | Impact of Incremental Modifications to the Universe, 2011 Data | |||
|---|---|---|---|---|---|---|
| 2010 Data | 2011 Data | Exclude LTAC Hospitals | ||||
| Use AHA Discharge Counts | Use SID Discharge Counts* | |||||
| Use AHA Hospital ID | Use AHA Hospital ID | New Universe Definition Use SID Hospital ID | ||||
| Column # | 1 | 2 | 3 | 4 | 5 | |
| Discharges | New England | 0.37 | 0.37 | 0.40 | 0.40 | 0.36 |
| Middle Atlantic | 0.76 | 0.67 | 0.70 | 0.67 | 0.55 | |
| East North Central | 0.43 | 0.54 | 0.51 | 0.56 | 0.53 | |
| West North Central | 0.31 | 0.37 | 0.36 | 0.40 | 0.40 | |
| South Atlantic | 0.22 | 0.40 | 0.45 | 0.48 | 0.34 | |
| East South Central | 0.10 | 0.15 | 0.14 | 0.15 | 0.14 | |
| West South Central | 0.33 | 0.38 | 0.34 | 0.31 | 0.28 | |
| Mountain | 0.41 | 0.43 | 0.39 | 0.42 | 0.45 | |
| Pacific | 0.56 | 0.53 | 0.55 | 0.57 | 0.55 | |
| ALOS | New England | 0.48 | 0.46 | 0.47 | 0.48 | 0.48 |
| Middle Atlantic | 0.56 | 0.57 | 0.53 | 0.54 | 0.52 | |
| East North Central | 0.56 | 0.52 | 0.57 | 0.57 | 0.51 | |
| West North Central | 0.54 | 0.50 | 0.52 | 0.51 | 0.48 | |
| South Atlantic | 0.58 | 0.54 | 0.51 | 0.51 | 0.52 | |
| East South Central | 0.52 | 0.57 | 0.50 | 0.51 | 0.50 | |
| West South Central | 0.53 | 0.53 | 0.56 | 0.55 | 0.45 | |
| Mountain | 0.51 | 0.53 | 0.47 | 0.52 | 0.56 | |
| Pacific | 0.54 | 0.49 | 0.53 | 0.53 | 0.51 | |
| Charges | New England | 0.49 | 0.48 | 0.47 | 0.48 | 0.47 |
| Middle Atlantic | 0.58 | 0.62 | 0.56 | 0.56 | 0.52 | |
| East North Central | 0.57 | 0.54 | 0.58 | 0.58 | 0.55 | |
| West North Central | 0.57 | 0.53 | 0.51 | 0.51 | 0.43 | |
| South Atlantic | 0.69 | 0.63 | 0.59 | 0.59 | 0.58 | |
| East South Central | 0.47 | 0.52 | 0.52 | 0.52 | 0.53 | |
| West South Central | 0.57 | 0.53 | 0.51 | 0.51 | 0.51 | |
| Mountain | 0.50 | 0.52 | 0.52 | 0.52 | 0.52 | |
| Pacific | 0.57 | 0.53 | 0.53 | 0.53 | 0.56 | |
| Mortality | New England | 0.55 | 0.51 | 0.52 | 0.51 | 0.51 |
| Middle Atlantic | 0.48 | 0.52 | 0.52 | 0.52 | 0.52 | |
| East North Central | 0.53 | 0.53 | 0.53 | 0.53 | 0.53 | |
| West North Central | 0.58 | 0.53 | 0.54 | 0.54 | 0.55 | |
| South Atlantic | 0.60 | 0.63 | 0.59 | 0.59 | 0.55 | |
| East South Central | 0.52 | 0.56 | 0.55 | 0.57 | 0.53 | |
| West South Central | 0.51 | 0.56 | 0.58 | 0.57 | 0.51 | |
| Mountain | 0.54 | 0.55 | 0.53 | 0.52 | 0.53 | |
| Pacific | 0.57 | 0.55 | 0.51 | 0.51 | 0.51 | |
* When discharge counts or hospital identifiers are not available from the SID, estimates from the AHA will be used. This is expected to affect fewer than 10 percent of hospitals.
Abbreviations: AHA, American Hospital Association; ALOS, average length of stay; ID, identification number; LTAC, long-term acute care; SID, State Inpatient Databases
As previously noted, by design, the RME for discharges was always equal to 1.0 at the national level. However, that is not the case at the census division level. Under the SYS design, the sample weights ensure that every sample estimate is equal to the universe value for each of the nine census divisions. Under the original NIS design, the sample weights ensure that every sample estimate is equal to the universe value for each of the four census regions. Therefore, at the census division level, samples under the SYS design will always estimate the same number of discharges in the universe, but samples under the original NIS design will estimate different numbers of discharges in the universe (depending on the proportion of discharges sampled from each census division within each census region). Therefore, the improvements in discharge count estimates per census division are a reflection of the different geographic stratifiers used for the two designs.
The RME values for the other outcomes are in line with the overall RMEs shown earlier (see Table 10), ranging from 0.43 to 0.58. These represent dramatic reductions in sampling error under the new SYS design.
5.2.4 Results for DRG-Specific Estimates
We summarize the distribution of DRG-specific RME estimates with box plots. An important consideration in reviewing these results is that the sample sizes vary substantially across the 752 DRGs in the data, unlike the previous estimates that were based on very large samples. Consequently, RME estimates vary across DRGs in part because of the varying sample sizes. We present distributions of RME for all DRGs, by DRGs within age groups, and by DRGs within census divisions.
We depict data in a series of figures with one set of boxes, grouped for each outcome (total discharges, ALOS, average charges, and in-hospital mortality). In addition, there is one set of boxes for each incremental change to the universe definition, shown in different colors in the following figures.
See Figure 5 which displays the distributions by DRG, as an example. The vertical axis represents the RME. The white dot in each box represents the mean RME taken over all 752 DRGs. The horizontal line in the middle of each box represents the median. The top of each box represents the 75th percentile and the bottom of each box represents the 25th percentile. Therefore, 50 percent of all DRGs have RME values that range from the bottom to the top of each box. The vertical lines—whiskers—that emanate from the bottom and top of each box terminate at the minimum and maximum RME values, respectively. These distributions are not weighted for the number of discharges in each DRG. Small DRGs have just as much weight as large DRGs in Figure 5, and they often represent the extremes.
5.2.4.1 DRG Results Overall
As shown in Figure 5, the distribution of RME values showed very little variation across the universe definitions. Consequently, the reductions in relative error did not depend on our redefinitions of the universe. In addition, the SYS design substantially reduced the margin of error for nearly all DRGs for ALOS, discharges, and average charges because the distributions completely fell below a value of 1.0 for those outcomes. For mortality, the upper whisker reached 1. This occurred because some DRGs have observed mortality rates of zero or one in the HCUP data (that is, no patients in that DRG died in the hospital, or all patients in that DRG died) and the sample estimates will always be zero or one for either design. However, improvements in the margin of error tend to be substantial for DRGs in which the mortality rate is between zero and one.
5.2.4.2 DRG Results by Age Group
Figure 6, Figure 7, Figure 8, and Figure 9 show the distributions of RME values that are specific to each age group for total discharges, ALOS, average charges, and mortality rates, respectively. Again, the universe definitions had little impact, and the SYS design consistently outperformed the original NIS design. For mortality (Figure 9), the fact that the tops of the boxes align with 1.0 with a few "outliers" above 1.0 for the younger age groups is, again, the result of very low and very high mortality DRGs, which have very little mortality variance. Therefore, there is very little opportunity for any design to outperform another design. However, for the older age groups, the SYS design exhibits substantial gains.
5.2.4.3 DRG Results by Census Division
Figure 10 shows the distributions of RME values that are specific to each census division for total discharges, ALOS, average charges, and mortality rates, respectively. This figure only shows the results for the final universe definition, not incremental changes; the effects of the universe definitions were negligible (data not shown). Again, the SYS design consistently outperformed the original NIS design at the DRG level across regions. Although the RME values exceeded 1.0 in some regions, it was for a very small number of DRGs that tended to have low discharge counts.
Figure 5: Distribution of Diagnostic Related Group (DRG)-Specific Estimates of Relative Margin of Error, Overall
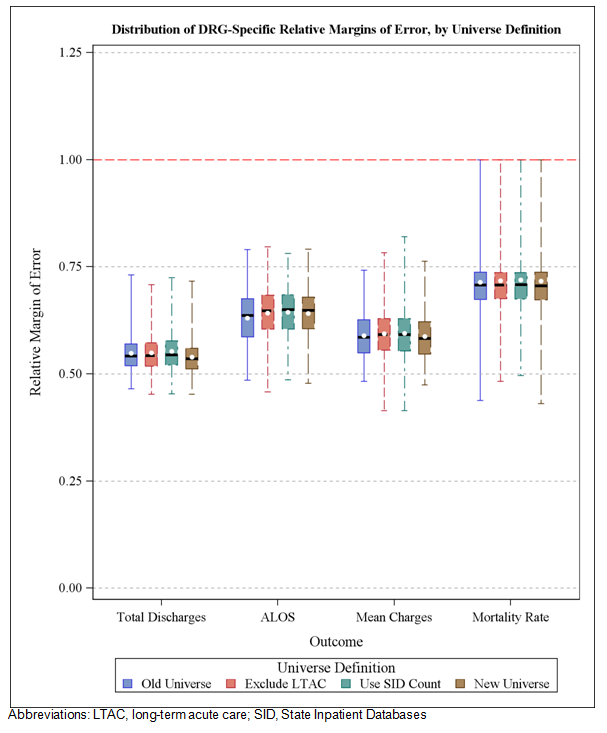
Figure 5 shows the Distribution of Diagnostic Related Group (DRG)-Specific Estimates of Relative Margin of Error (RME), Overall by Universe Definition. As shown in Figure 5, the distribution of RME values showed very little variation across the universe definitions. Consequently, the reductions in relative error did not depend on our redefinitions of the universe. In addition, the SYS design substantially reduced the margin of error for nearly all DRGs for ALOS, discharges, and average charges because the distributions completely fell below a value of 1.0 for those outcomes. For mortality, the upper whisker reached 1. This occurred because some DRGs have observed mortality rates of zero or one in the HCUP data (that is, no patients in that DRG died in the hospital, or all patients in that DRG died) and the sample estimates will always be zero or one for either design. However, improvements in the margin of error tend to be substantial for DRGs in which the mortality rate is between zero and one.
Figure 6: Distribution of Diagnosis Related Group (DRG)-Specific Estimates of Relative Margin of Error (RME) for Total Discharges, by Age Groups
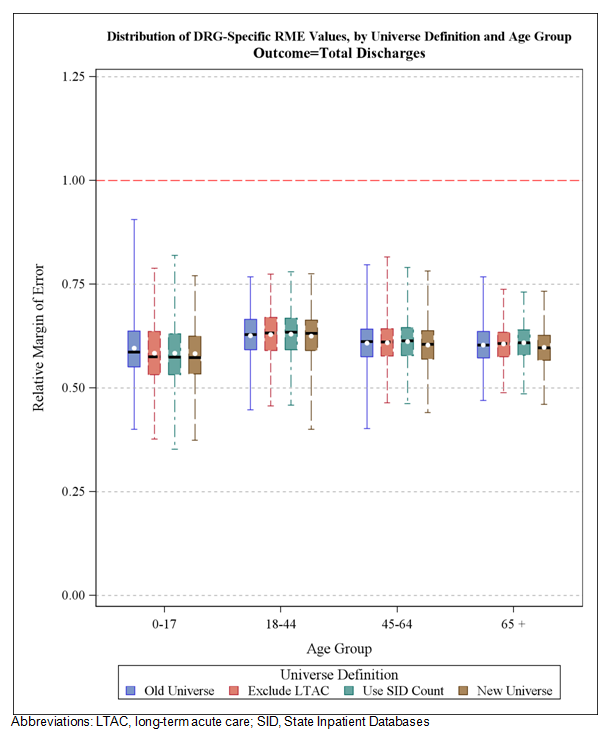
Figure 6, Figure 7, Figure 8, and Figure 9 show the distributions of RME values that are specific to each age group for total discharges, ALOS, average charges, and mortality rates, respectively. Again, the universe definitions had little impact, and the SYS design consistently outperformed the original NIS design. For mortality (Figure 9), the fact that the tops of the boxes align with 1.0 with a few �outliers� above 1.0 for the younger age groups is, again, the result of very low and very high mortality DRGs, which have very little mortality variance. Therefore, there is very little opportunity for any design to outperform another design. However, for the older age groups, the SYS design exhibits substantial gains.
Figure 7: Distribution of Diagnosis Related Group (DRG)-Specific Estimates of Relative Margin of Error (RME) for Average Length of Stay (ALOS), by Age Groups
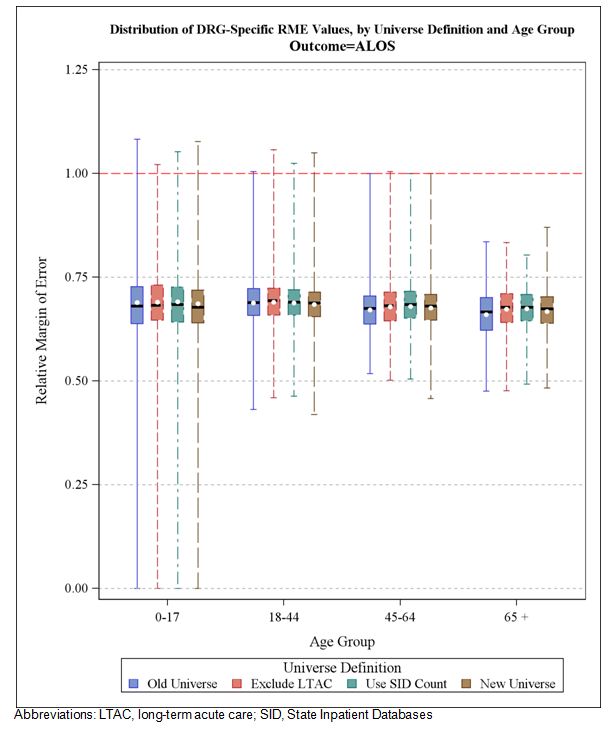
Figure 6, Figure 7, Figure 8, and Figure 9 show the distributions of RME values that are specific to each age group for total discharges, ALOS, average charges, and mortality rates, respectively. Again, the universe definitions had little impact, and the SYS design consistently outperformed the original NIS design. For mortality (Figure 9), the fact that the tops of the boxes align with 1.0 with a few �outliers� above 1.0 for the younger age groups is, again, the result of very low and very high mortality DRGs, which have very little mortality variance. Therefore, there is very little opportunity for any design to outperform another design. However, for the older age groups, the SYS design exhibits substantial gains.
Figure 8: Distribution of Diagnosis Related Group (DRG)-Specific Estimates of Relative Margin of Error (RME) for Average Charges, by Age Groups
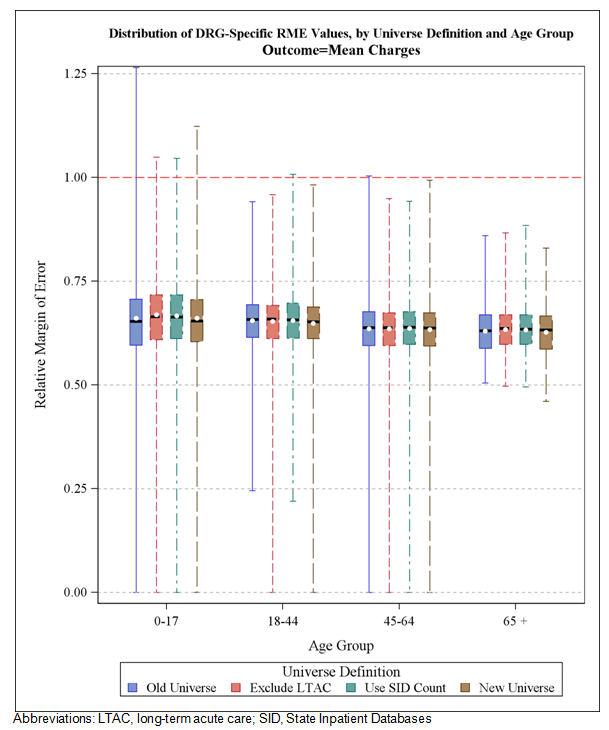
Figure 6, Figure 7, Figure 8, and Figure 9 show the distributions of RME values that are specific to each age group for total discharges, ALOS, average charges, and mortality rates, respectively. Again, the universe definitions had little impact, and the SYS design consistently outperformed the original NIS design. For mortality (Figure 9), the fact that the tops of the boxes align with 1.0 with a few �outliers� above 1.0 for the younger age groups is, again, the result of very low and very high mortality DRGs, which have very little mortality variance. Therefore, there is very little opportunity for any design to outperform another design. However, for the older age groups, the SYS design exhibits substantial gains.
Figure 9: Distribution of Diagnosis Related Group (DRG)-Specific Estimates of Relative Margin of Error (RME) for Mortality Rates, by Age Groups
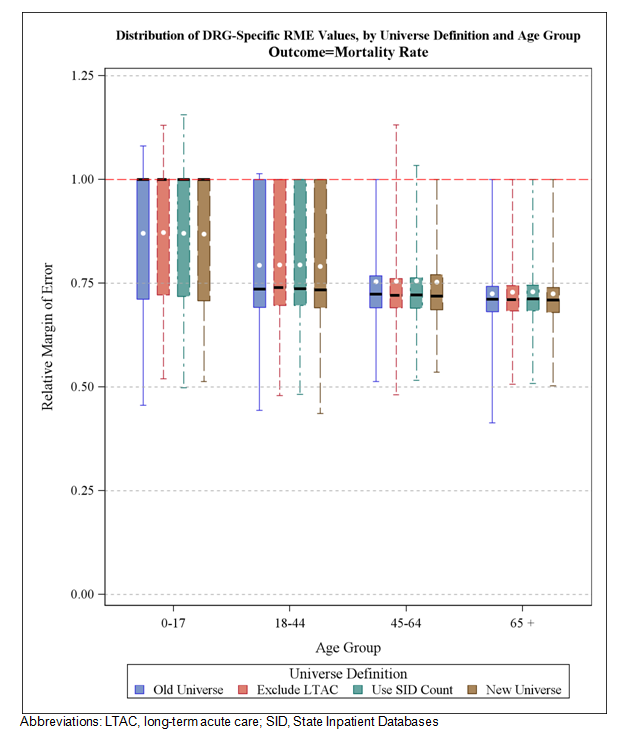
Figure 6, Figure 7, Figure 8, and Figure 9 show the distributions of RME values that are specific to each age group for total discharges, ALOS, average charges, and mortality rates, respectively. Again, the universe definitions had little impact, and the SYS design consistently outperformed the original NIS design. For mortality (Figure 9), the fact that the tops of the boxes align with 1.0 with a few �outliers� above 1.0 for the younger age groups is, again, the result of very low and very high mortality DRGs, which have very little mortality variance. Therefore, there is very little opportunity for any design to outperform another design. However, for the older age groups, the SYS design exhibits substantial gains.
Figure 10: Distribution of Diagnosis Related Group (DRG)-Specific Estimates of Relative Margin of Error (RME) for Outcomes, by Census Division
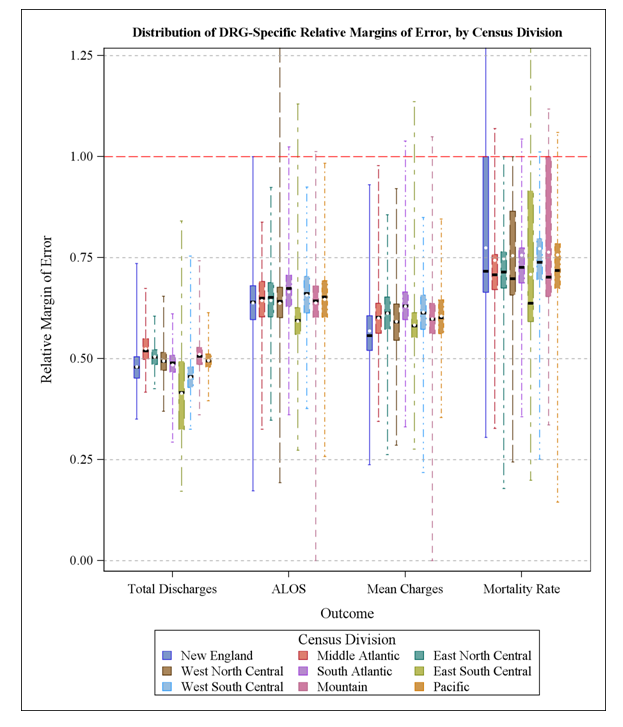
Figure 10 shows the distributions of RME values that are specific to each census division for total discharges, ALOS, average charges, and mortality rates, respectively. This figure only shows the results for the final universe definition, not incremental changes; the effects of the universe definitions were negligible (data not shown). Again, the SYS design consistently outperformed the original NIS design at the DRG level across regions. Although the RME values exceeded 1.0 in some regions, it was for a very small number of DRGs that tended to have low discharge counts.
In the 2012 study, findings from the environmental scan of the literature suggested that the NIS data are used for vital research on hospital outcomes in the United States by a broad range of health researchers and other professionals. Specifically, NIS data are used for hospital comparisons and disparity estimates, information pertaining to health risk factors, and the cost and quality of healthcare. NIS data have been analyzed using statistical methods designed for the analysis of categorical variables (e.g., logistic regression) and simple summary statistics (means, proportions, and tests of group differences). Last year�s study focused on the efficiency of a new design for providing national estimates in comparison with the design currently in use.
In particular, that report recommended the stratified systematic sample (SYS) design because:
In preparation for implementing the systematic sampling design for the 2012 NIS (to be released in June 2014), we:
The switch from drawing all discharges from a sample of hospitals to drawing a sample of discharges from all hospitals improved the quality of NIS sample estimates. However, the other modifications listed above affected the values of universe statistics (the values that sample statistics try to estimate). In particular, these modifications had an effect on the numbers and types of discharges in the universe; changes aimed at making more accurate national estimates for the universe of hospitals addressed by the NIS - short-term, acute care general and specialty hospitals.
Therefore, for this report, using HCUP and AHA annual survey data for 2011, we estimated the effects of these changes:
Importantly, none of these changes eroded the improvements we saw in the previous study in the accuracy of estimated outcomes. These changes did not alter the substantial reductions in the margins of error resulting from the new SYS design.
Finally, recognizing the effect that these changes will have on trends estimated from historical data, we recommend that AHRQ offer users a set of "trend weights" such as those that were offered following the redesign of the 1998 NIS.29 For each past NIS, perhaps beginning with the 1998 NIS, we would recalculate the number of discharges in the universe (the weight numerator) after eliminating LTAC hospitals and using SID counts of discharges in place of AHA admission counts. Although these new weights will not have much effect on estimates of variance, they will have a substantial effect on estimates of totals and, to a lesser extent, on estimates of means and rates, historically. These trend weights should be preferred for trend analyses that combine the 2012 NIS with historical NIS data to adjust for the 2012 NIS redesign.
To investigate the differences between the AHA-based discharge estimates and the SID-based discharge counts, we searched the internet for discharge count information that was independent of the AHA survey and the SID data. We identified very few sources independent of the AHA survey and the SID data on which to base estimates of annual discharge counts for each hospital. We found the following:
We performed an in-depth analysis of the Illinois data because the Illinois data offered calendar year counts separate from those contained in the AHA and SID data and reported the counts separately for different hospital units. Also, we knew from information on "HCUP SID File Compositions" that the Illinois SID file excluded stays in skilled nursing facilities or nursing homes attached to a hospital, whereas stays in other specialty units within the hospital (e.g., psychiatric, rehabilitation, acute long-term care) were included in the SID data. This seemed like a good opportunity to test whether the double counting of NICU patients, coupled with the exclusion of nursing bed stays, could possibly explain most of the difference between the AHA-based counts and the SID-based counts.
We merged the SID data with the Illinois hospital data for all hospital identifiers that were matched 1:1 with an AHA hospital identifier and for which the AHA admission counts were not imputed. This resulted in 96 matches for the 2010 data and 142 matches for the 2011 data.* The main results are summarized in Table A-1 for data years 2010 and 2011.
*Matching was completed manually for the 2010 data based on limited data available on the Illinois Department of Health website. Matching was more successful by computer for the 2011 data based on more extensive data files provided by the Illinois DOPH.
For each year, the first row of statistics shows the count of SID discharges in the analytic data and the SID percentage of AHA counts. The SID count was 96.34 percent and 96.67 percent of the AHA count in 2010 and 2011, respectively. The second row expresses the AHA count as a percentage of the SID count, which represents the inverse of the first row percentages, but they are useful for comparisons with rows below it.
The third row (Illinois admissions plus newborns) expresses the Illinois count as a percentage of the SID count and as a percentage of the AHA count. This includes nursing bed discharges, and it double counts NICU patients because they are contained in the newborn count and in the total discharge count. This Illinois count represented 99.37 percent and 100.42 percent of the AHA count in 2010 and 2011, respectively. Therefore, these Illinois counts were very close to the AHA-based counts. However, these counts were 3.14 percent and 3.44 percent higher than the SID counts in 2010 and 2011, respectively, which were close to the AHA/SID differences shown in the second row (3.80 percent and 3.44 percent).
The fourth row (Illinois admissions plus newborns minus NICU) reflects the effect of eliminating the double counting of NICU patients by subtracting the count of NICU discharges from the sum of admissions plus newborns. This brought the Illinois counts closer to the SID counts by 0.59 percent and 0.66 percent in 2010 and 2011, respectively. As a result, we believe that the AHA-based counts are inflated by about 0.6 percent due to the double counting of NICU discharges.
Finally, the fifth row (Illinois admissions plus newborns minus NICU and swing, rehabilitation, and LTC beds) subtracts discharge counts from the NICU, swing beds, rehabilitation beds, and long-term care beds. Subtracting these counts from the Illinois discharge total resulted in close agreements between the Illinois counts and the SID counts. The adjusted Illinois counts equaled 99.75 percent and 100.80 percent of the SID count in 2010 and 2011, respectively.
Table A-1. Summary of AHA Illinois Hospitals Matched 1:1 to SID Hospitals and Matched to Illinois Deptartment of Health Survey and Without AHA Imputation
| 2010 Data | Discharges | SID Discharges, % | AHA Counts, % |
|---|---|---|---|
| SID total discharges | 885,249 | 100.0 | 96.34 |
| AHA total counts (admissions + newborns) | 918,880 | 103.80 | 100.00 |
| Illinois admissions + newborns | 913,090 | 103.14 | 99.37 |
| Illinois admissions + newborns minus NICU | 907,842 | 102.55 | 98.80 |
| Illinois admissions + newborns minus NICU and swing, rehabilitation, and long-term care beds | 882,894 | 99.73 | 96.08 |
| 2011 Data | |||
| SID total discharges | 1,258,133 | 100.00 | 96.67 |
| AHA total discharges (admissions + newborns) | 1,301,467 | 103.44 | 100.00 |
| Illinois admissions + newborns | 1,306,966 | 103.88 | 100.42 |
| Illinois admissions + newborns minus NICU | 1,298,650 | 103.22 | 99.78 |
| Illinois admissions + newborns minus NICU and swing, rehabilitation, and long-term care beds | 1,268,143 | 100.80 | 97.44 |
Abbreviations: AHA, American Hospital Association; NICU; neonatal intensive care unit; SID, State Inpatient Databases
Consequently, the difference between the SID-based count of discharges and the AHA-based count in Illinois was almost completely explained by the AHA-based count having double-counted NICU patients and having included discharge counts from the NICU, swing beds, rehabilitation beds, and long-term care beds.
Table A-1 showed results in the aggregate. However, we also analyzed counts at the hospital level. We regressed each hospital�s 2011 SID count on the department-specific admission counts taken from the 2011 Illinois survey.* There was one observation for each hospital. The dependent variable was the number of SID discharges. The predictors were the number of admissions for that hospital for each category given by the Illinois DOPH survey data. Below are the estimated coefficients (column labeled "Estimate") with their degrees of freedom (DF) and 95 percent confidence limits:
*We used median regressions to obtain these results, which estimate coefficients that minimize the absolute value of errors. We did not use OLS regression because we were not interested in minimizing squared error and the resulting coefficients would be more heavily influenced by outliers.
| Parameter Estimates | ||||
|---|---|---|---|---|
| Parameter | DF | Estimate | 95% Confidence Limits | |
| Med_Surg_Admissions | 1 | 0.9941 | 0.9690 | 1.0039 |
| OBGYN_plus_Births | 1 | 0.9823 | 0.9693 | 1.0184 |
| NICU_Admissions | 1 | 0.1255 | -0.3888 | 0.3953 |
| Direct_ICU_Admission | 1 | 0.9712 | 0.8817 | 1.0680 |
| Pediatric_Admissions | 1 | 1.0554 | 1.0423 | 1.1534 |
| LTC_Admissions | 1 | -0.0222 | -0.1037 | 0.0580 |
| Swing_Bed_Admissions | 1 | -0.0198 | -0.0972 | 0.0241 |
| Rehabilitation_Admis | 1 | 0.9460 | 0.8579 | 1.1347 |
| Acute_Mental_Admissi | 1 | 0.9997 | 0.9624 | 1.0434 |
| LTC_Acute_Admissions | 1 | 1.0030 | 0.9135 | 1.0216 |
We combined OBGYN with total live births because those two counts were highly correlated (nearly equal counts of OBGYN and births for each hospital). We wanted to avoid the collinearity that would result from entering them as separate predictors. For most of the admission categories, the coefficients were not significantly different from 1.0 (the confidence interval includes the value of 1). For NICU, LTC, and swing bed admissions, the coefficients were not significantly different from zero (the confidence interval includes the value of 0). The NICU admissions were already included in the count of live births, so it is not surprising that its coefficient was not statistically different from zero. However, the near-zero coefficients for LTC and swing bed admissions indicate that those types of admissions were not included in the count of SID discharges.
To further clarify the results, we fit one other regression with just three predictor variables—
Below are the coefficients:
| Parameter Estimates | ||||
|---|---|---|---|---|
| Parameter | DF | Estimate | 95% Confidence Limits | |
| Admissions | 1 | 0.9919 | 0.9883 | 0.9953 |
| LTC_Admissions | 1 | -0.9722 | -1.0866 | -0.9280 |
| Swing_Bed_Admissions | 1 | -0.9869 | -1.0640 | -0.9579 |
This regression indicated that the SID discharge count was estimated by 99.2 percent of the Illinois DOPH survey total admission count (including newborns) minus 97.2 percent of the LTC admissions minus 98.7 percent of the swing bed admissions. Again, the message is clear that the Illinois SID data excluded LTC and swing bed admissions. More to the point, the AHA-based counts apparently included these types of admissions for Illinois. Consequently, at the hospital level, the difference between the AHA counts and the SID counts were almost completely explained by the AHA-based counts double counting NICU patients and including LTC and swing bed admissions.
Table B-1. Data Elements in the NIS Inpatient Core Files
Data elements that are italicized are not included in the 2011 NIS Inpatient Core files, but are only available in previous years� files.
| Type of Data Element | HCUP Name | Years Available | Coding Notes | Plan for 2012 |
|---|---|---|---|---|
| Admission information | ||||
| Admission day | AWEEDEND | 1998-2011 | Admission on weekend: (0) admission on Monday-Friday, (1) admission on Saturday-Sunday | Keep |
| ADAYWK | 1988-1997 | Admission day of week: (1) Sunday, (2) Monday, (3) Tuesday, (4) Wednesday, etc. | N/A | |
| Admission month | MONTH | 1998-2011 | Admission month coded from (1) January to (12) December | Keep |
| Admission source | ASOURCE | 1988-2011 | Admission source, uniform coding: (1) ER, (2) another hospital, (3) another facility including long-term care, (4) court/law enforcement, (5) routine/birth/other | Drop |
| ASOURCE_X | 1998-2011 | Admission source, as received from data source using State-specific coding | Drop | |
| ASOURCEUB92 | 2003-2011 | Admission source (UB-92 standard coding). For newborn admissions (ATYPE = 4): (1) normal newborn, (2) premature delivery, (3) sick baby, (4) extramural birth; For non-newborn admissions (ATYPE NE 4): (1) physician referral, (2) clinic referral, (3) HMO referral, (4) transfer from a hospital, (5) transfer from a skilled nursing facility, (6) transfer from a another healthcare facility, (7) emergency room, (8) court/law enforcement, (A) transfer from a critical access hospital, (B) transfer from another home health agency, (C) readmission to same home health agency, (D) transfer from one distinct unit of the hospital to another distinct unit of the same hospital resulting in a separate claim to the payer, (E) transfer from ambulatory surgery center, (F) transfer from hospice and under hospice plan | Drop | |
| POINTOFORIGIN_X | 2009-2011 | Point of origin for admission or visit, as received from source | Drop | |
| POINTOFORIGIN_UB04 | 2007-2011 | Point of origin for admission or visit, UB-04 standard coding. For newborn admission (ATYPE = 4): (5) Born inside this hospital, (6) Born outside of this hospital; For non-newborn admissions (ATYPE NE 4): (1) Non-healthcare facility point of origin, (2) Clinic, (4) Transfer from a hospital (different facility), (5) Transfer from a skilled Nursing Facility (SNF) or Intermediate Care Facility (ICF), (6) Transfer from another healthcare facility, (7) Emergency room, (8) Court/law enforcement, (B) Transfer from another Home Health Agency, (C) Readmission to Same Home Health Agency, (D) Transfer from one distinct unit of the hospital to another distinct unit of the same hospital resulting in a separate claim to the payer, (E) Transfer from ambulatory surgery center, (F) Transfer from hospice and is under a hospice plan of care or enrolled in a hospice program | Drop | |
| Transferred into hospital | TRAN_IN | 2008-2011 | Transfer In Indicator: (0) not a transfer, (1) transferred in from a different acute care hospital [ATYPE NE 4 & (ASOURCE=2 or POO=4)], (2) transferred in from another type of health facility [ATYPE NE 4 & (ASOURCE=3 or POO=5,6)] | Keep |
| Indicator of emergency department service | HCUP_ED | 2007-2011 | Indicator that discharge record includes evidence of emergency department (ED) services: (0) Record does not meet any HCUP Emergency Department criteria, (1) Emergency Department revenue code on record, (2) Positive Emergency Department charge (when revenue center codes are not available), (3) Emergency Department CPT procedure code on record, (4) Admission source of ED, (5) State-defined ED record; no ED charges available | Keep |
| Admission type | ATYPE | 1988-2011 | Admission type, uniform coding: (1) emergency, (2) urgent, (3) elective, (4) newborn, (5) Delivery (coded in 1988-1997 data only), (5) trauma center beginning in 2003 data, (6) other | Drop |
| ELECTIVE | 2002-2011 | Indicates elective admission: (1) elective, (0) non-elective admission | Keep | |
| Patient demographic and location information | ||||
| Age at admission | AGE | 1988-2011 | Age in years coded 0-124 years | Keep |
| AGEDAY | 1988-2011 | Age in days coded 0-364 only when the age in years is less than 1 | Drop | |
| AGE_NEONATE | Neonatal age (first 28 days after birth) indicator: (0) non-neonatal age (1) neonatal age | Add | ||
| Sex of patient | FEMALE | 1998-2011 | Indicates sex for NIS beginning in 1998: (0) male, (1) female | Keep |
| SEX | 1988-1997 | Indicates sex for NIS prior to 1998: (1) male, (2) female | N/A | |
| Race of patient | RACE | 1988-2011 | Race, uniform coding: (1) white, (2) black, (3) Hispanic, (4) Asian or Pacific Islander, (5) Native American, (6) other | Keep |
| Location of patient�s residence | PL_NCHS2006 | 2007-2011 | Patient Location: NCHS Urban-Rural Code (V2006). This is a six-category urban-rural classification scheme for U.S. counties: (1) "Central" counties of metro areas of >=1 million population,(2) "Fringe" counties of metro areas of >=1 million population,(3) Counties in metro areas of 250,000-999,999 population,(4) Counties in metro areas of 50,000-249,999 population,(5) Micropolitan counties,(6) Not metropolitan or micropolitan counties | Keep |
| PL_UR_CAT4 | 2003-2006 | Urban�rural designation for patient�s county of residence: (1) large metropolitan, (2) small metropolitan, (3) micropolitan, (4) non-metropolitan or micropolitan | N/A | |
| Median household income for patient's ZIP Code | ZIPINC_QRTL | 2003-2011 | Median household income quartiles for patient's ZIP Code. For 2008, the median income quartiles are defined as: (1) $1 - $38,999; (2) $39,000 - $47,999; (3) $48,000 - 62,999; and (4) $63,000 or more | Keep |
| ZIPINC | 1998-2002 | Median household income category in files beginning in 1998: (1) $1-$24,999, (2) $25,000-$34,999, (3) $35,000-$44,999, (4) $45,000 and above | N/A | |
| ZIPINC4 | 1988-1997 | Median household income category in files prior to 1998: (1) $1-$25,000, (2) $25,001-$30,000, (3) $30,001-$35,000, (4) $35,001 and above | N/A | |
| ZIPINC8 | 1988-1997 | Median household income category in files prior to 1998: (1) $1-$15,000, (2) $15,001-$20,000, (3) $20,001-$25,000, (4) $25,001-$30,000, (5) $30,001-$35,000, (6) $35,001-$40,000, (7) $40,001-$45,000, (8) $45,001 or more | N/A | |
| Payer information | ||||
| Primary expected payer | PAY1 | 1988-2011 | Expected primary payer, uniform: (1) Medicare, (2) Medicaid, (3) private including HMO, (4) self-pay, (5) no charge, (6) other | Keep |
| PAY1_N | 1988-1997 | Expected primary payer, nonuniform: (1) Medicare, (2) Medicaid, (3) Blue Cross, Blue Cross PPO, (4) commercial, PPO, (5) HMO, PHP, etc., (6) self-pay, (7) no charge, (8) Title V, (9) Worker's Compensation, (10) CHAMPUS, CHAMPVA, (11) other government, (12) other | N/A | |
| PAY1_X | 1998-2011 | Expected primary payer, as received from the data source | Drop | |
| Secondary expected payer | PAY2 | 1988-2011 | Expected secondary payer, uniform: (1) Medicare, (2) Medicaid, (3) private including HMO, (4) self-pay, (5) no charge, (6) other | Drop |
| PAY2_N | 1988-1997 | Expected secondary payer, nonuniform: (1) Medicare, (2) Medicaid, (3) Blue Cross, Blue Cross PPO, (4) commercial, PPO, (5) HMO, PHP, etc., (6) self-pay, (7) no charge, (8) Title V, (9) Worker's Compensation, (10) CHAMPUS, CHAMPVA, (11) other government, (12) other | N/A | |
| PAY2_X | 1998-2011 | Expected secondary payer, as received from the data source | Drop | |
| Diagnosis and procedure information | ||||
| ICD-9-CM diagnoses | DX1 � DX25 | 1988-2011 | Diagnoses, principal and secondary (ICD-9-CM). Beginning in 2003, the diagnosis array does not include any external cause of injury codes. These codes have been stored in a separate array ECODEn. Beginning in 2009, the diagnosis array was increased from 15 to 25. | Keep |
| NDX | 1988-2011 | Number of diagnoses coded on the original record | Keep | |
| DSNDX | 1988-1997 | Number of diagnosis fields provided by the data source | N/A | |
| DXSYS | 1988-1997 | Diagnosis coding system (ICD-9-CM) | N/A | |
| DXV1 - DXV15 | 1988-1997 | Diagnosis validity flags | N/A | |
| External causes of injury and poisoning | ECODE1 - ECODE4 | 2003-2011 | External cause of injury and poisoning code, primary and secondary (ICD-9-CM). Beginning in 2003, external cause of injury codes are stored in a separate array ECODEn from the diagnosis codes in the array DXn. Prior to 2003, these codes are contained in the diagnosis array (DXn). | Keep |
| NECODE | 2003-2011 | Number of external cause of injury codes on the original record. A maximum of 4 codes are retained on the NIS. | Keep | |
| ICD-9-CM procedures | PR1 - PR15 | 1988-2011 | Procedures, principal and secondary (ICD-9-CM) | Keep |
| NPR | 1988-2011 | Number of procedures coded on the original record | Keep | |
| DSNPR | 1988-1997 | Number of procedure fields in this data source | N/A | |
| PRSYS | 1988-1997 | Procedure system (1) ICD-9-CM, (2) CPT-4, (3) HCPCS/CPT-4 | N/A | |
| PRV1 - PRV15 | 1988-1997 | Procedure validity flag: (0) Indicates a valid and consistent procedure coe, (1) Indicates an invalid code for the discharge date | N/A | |
| PRDAY1 | 1988-2011 | Number of days from admission to principal procedure | Keep | |
| PRDAY2 - PRDAY15 | 1998-2011 | Number of days from admission to secondary procedures | Keep | |
| DRG information | ||||
| Diagnosis Related Group (DRG) | DRG | 1988-2011 | DRG in use on discharge date | Keep |
| DRG_NoPOA | 2008-2011 | DRG in use on discharge date, calculated without Present On Admission (POA) indicators | Keep | |
| DRGVER | 1988-2011 | Grouper version in use on discharge date | Keep | |
| DRG10 | 1988-1999 | DRG Version 10 (effective October 1992 - September 1993) | N/A | |
| DRG18 | 1998-2005 | DRG Version 18 (effective October 2000 - September 2001) | N/A | |
| DRG24 | 2006-2011 | DRG Version 24 (effective October 2006 - September 2007) | Keep | |
| Major Diagnosis Category (MDC) | MDC | 1988-2011 | MDC in use on discharge date | Keep |
| MDC_noPOA | 2009-2011 | MDC in use on discharge date, calculated without Present on Admission (POA) indicators | Keep | |
| MDC10 | 1988-1999 | MDC Version 10 (effective October 1992 - September 1993) | N/A | |
| MDC18 | 1998-2005 | MDC Version 18 (effective October 2000 - September 2001) | N/A | |
| MDC24 | 2006-2011 | MDC Version 24 (effective October 2006 - September 2007) | Keep | |
| Other data elements derived from ICD-9-CM codes
see also: Table B-3, Data Elements in the NIS Disease Severity Measures File and Table B-4, Data Elements in the NIS Diagnosis and Procedures Groups File |
||||
| Clinical Classifications Software (CCS) category | DXCCS1 � DXCCS25 | 1988-2011 | Clinical Classifications Software (CCS) category for all diagnoses for NIS beginning in 1998. Beginning in 2009, the diagnosis array was increased from 15 to 25. | Keep |
| DCCHPR1 | 1998-1997 | CCS category for principal diagnosis for NIS prior to 1998. CCS was formerly called the Clinical Classifications for Health Policy Research (CCHPR) | N/A | |
| E_CCS1 - E_CCS4 | 2003-2011 | CCS category for the external cause of injury and poisoning codes | Keep | |
| PRCCS1 - PRCCS15 | 1998-2011 | CCS category for all procedures for NIS beginning in 1998 | Keep | |
| PCCHPR1 | 1988-1997 | CCS category for principal diagnosis for NIS prior to 1998. CCS was formerly called the Clinical Classifications for Health Policy Research (CCHPR) | N/A | |
| Number of chronic conditions | NCHRONIC | 2008-2011 | Count of chronic conditions in the diagnosis vector | Keep |
| Operating room procedure indicator | ORPROC | 2009-2011 | Major operating room procedure indicator for the record: (0) no major operating room procedure, (1) major operating room procedure | Keep |
| Neonatal/ maternal flag | NEOMAT | 1988-2011 | Assigned from diagnoses and procedure codes: (0) not maternal or neonatal, (1) maternal diagnosis or procedure, (2) neonatal diagnosis, (3) maternal and neonatal on same record | Keep |
| Indicates in-hospital birth | HOSPBRTH | 2006-2011 | Indicator that discharge record includes diagnosis of birth that occurred in the hospital: (0) Not an in-hospital birth, (1) In-hospital birth | Keep |
| Resource use information | ||||
| Total charges | TOTCHG | 1988-2011 | Total charges, edited | Keep |
| TOTCHG_X | 1988-2011 | Total charges, as received from data source | Drop | |
| Length of stay | LOS | 1988-2011 | Length of stay, edited | Keep |
| LOS_X | 1988-2011 | Length of stay, as received from data source | Drop | |
| Discharge information | ||||
| Discharge quarter | DQTR | 1988-2011 | Coded: (1) First quarter, Jan - Mar, (2) Second quarter, Apr - Jun, (3) Third quarter, Jul - Sep, (4) Fourth quarter, Oct - Dec | Keep |
| DQTR_X | 2006-2011 | Discharge quarter, as received from data source | Drop | |
| Discharge year | YEAR | 1988-2011 | Keep | |
| Disposition of patient (discharge status) | DISP | 1988-1997 | Disposition of patient, uniform coding used prior to 1998: (1) routine, (2) short-term hospital, (3) skilled nursing facility, (4) intermediate care facility, (5) another type of facility, (6) home healthcare, (7) against medical advice, (20) died | N/A |
| DIED | 1988-2011 | Indicates in-hospital death: (0) did not die during hospitalization, (1) died during hospitalization | Keep | |
| DISPUB92 | 1998-2006 | Disposition of patient, UB-92 coding: (1) routine, (2) short-term hospital, (3) skilled nursing facility, (4) intermediate care, (5) another type of facility, (6) home healthcare, (7) against medical advice, (8) home IV provider,(20) died in hospital, (40) died at home, (41) died in a medical facility, (42) died, place unknown, (43) alive, Federal health facility, (50) Hospice, home, (51) Hospice, medical facility, (61) hospital-based Medicare approved swing bed , (62) another rehabilitation facility, (63) long-term care hospital, (64) certified nursing facility, (65) psychiatric hospital, (66) critical access hospital (71) another institution for outpatient services, (72) this institution for outpatient services, (99) discharged alive, destination unknown | N/A | |
| DISPUB04 | 2006-2011 | Disposition of patient, UB04 standard coding: (1 )Discharged to Home or Self Care (Routine Discharge), (2) Discharged/transferred to a Short-Term Hospital for Inpatient Care, (3) Discharged/transferred to a Skilled Nursing Facility (SNF), (4) Discharged/transferred to an Intermediate Care Facility (ICF), (5) Discharged/transferred to a Designated Cancer Center or Children's Hospital (Effective 10/1/07), (5) Discharged/transferred to another type of institution not defined elsewhere (Effective prior to 10/1/07), (6) Discharged/transferred to Home under care of Organized Home Health Service Organization, (7) Left Against Medical Advice or Discontinued Care, (8) home IV provider, (9) Admitted as an inpatient to this hospital - valid only on outpatient data, (20) Expired, (40) Expired at home, (41) Expired in a Medical Facility, (42) Expired - place unknown, (43) Discharged/transferred to a Federal Health Care Facility, (50) Hospice � Home, (51) Hospice - Medical Facility , (61) Discharged/transferred to a Hospital-Based Medicare approved Swing Bed, (62) Discharged/transferred to an Inpatient Rehabilitation Facility (IRF) including Rehabilitation Distinct part unit of a hospital, (63) Discharged/transferred to a Medicare certified Long Term Care Hospital (LTCH), (64) Discharged/transferred to a Nursing Facility certified by Medicaid, but not certified by Medicare, (65) Discharged/transferred to a Psychiatric Hospital or Psychiatric distinct part unit of a hospital, (66) Discharged/transferred to a Critical Access Hospital (CAH), (70) Discharged/transferred to another type of institution not defined elsewhere (Effective 10/1/07), (71) Another institution for outpatient services, (72) This institution for outpatient services, (99) Discharged alive, destination unknown | Drop | |
| DISPUNIFORM | 1998-2011 | Disposition of patient, uniform coding used beginning in 1998: (1) routine, (2) transfer to short-term hospital, (5) other transfers, including skilled nursing facility, intermediate care, and another type of facility, (6) home healthcare, (7) against medical advice, (20) died in hospital, (99) discharged alive, destination unknown | Keep | |
| TRAN_OUT | 2010-2011 | Transfer Out Indicator: (0) not a transfer, (1) transferred out to a different acute care hospital, (2) transferred out to another type of health facility | Keep | |
| Weights (to calculate national estimates) | ||||
| Discharge weights (weights for 1988-1993 are on Hospital Weights file) | DISCWT | 1998-2011 | Discharge weight on Core file and Hospital Weights file for NIS beginning in 1998. In all data years except 2000, this weight is used to create national estimates for all analyses. In 2000 only, this weight is used to create national estimates for all analyses, excluding those that involve total charges. | Keep |
| DISCWT_U | 1993-1997 | Discharge weight on Core file and Hospital Weights file for NIS prior to 1998 | N/A | |
| DISCWTcharge | 2000 | Discharge weight for national estimates of total charges. In 2000 only, this weight is used to create national estimates for analyses that involve total charges. | N/A | |
| DISCWT10 | 1998-2004 | Discharge weight on 10% subsample Core file for NIS from 1998 to 2004. In all data years except 2000, this weight is used to create national estimates for all analyses. In 2000 only, this weight is used to create national estimates for all analyses, excluding those that involve total charges. | N/A | |
| D10CWT_U | 1993-1997 | Discharge weight on 10% subsample Core file for NIS prior to 1998 | N/A | |
| DISCWTcharge10 | 2000 | Discharge weight for national estimates of total charges on 10% subsample file. In 2000 only, this weight is used to create national estimates for analyses that involve total charges. | N/A | |
| Hospital information | ||||
| Hospital identifiers (encrypted) | DSHOSPID | 1998-2011 | Hospital number as received from the data source | Drop |
| HOSPID | 1988-2011 | HCUP hospital number (links to Hospital Weights file) | Drop | |
| HOSP_NIS | NIS hospital number (links to Hospital Weights file; does not link to previous years) | Add | ||
| Hospital location | HOSPST | 1988-2011 | State postal code for the hospital (e.g., AZ for Arizona) | Drop |
| HOSP_DIVISION | Census Divisin of hospital (STRATA): (1) New England, (2) Middle Atlantic, (3) East North Central, (4) West North Central, (5) South Atlantic, (6) East South Central, (7) West South Central, (8) Mountain, (9) Pacific | Add | ||
| HOSPSTCO | 1988-2002 | Modified Federal Information Processing Standards (FIPS) State/county code for the hospital links to Area Resource File (available from the Bureau of Health Professions, Health Resources and Services Administration). Beginning in 2003, this data element is available only on the Hospital Weights file. | N/A | |
| Hospital stratifier | NIS_STRATUM | 1998-2011 | Stratum used to sample hospitals, based on geographic region, control, location/teaching status, and bed size. Stratum information is also contained in the Hospital Weights file. | Keep |
| Other identifiers | ||||
| Physician identifiers, synthetic | MDID_S | 1988-2000 | Synthetic attending physician number in files prior to 2001 | N/A |
| MDNUM1_R | 2003-2009 | Re-identified attending physician number in files starting in 2003 | N/A | |
| MDNUM1_S | 2001-2002 | Synthetic attending physician number in files beginning in 2001 and discontinued in 2003 | N/A | |
| SURGID_S | 1988-2000 | Synthetic primary surgeon number in files prior to 2001 | N/A | |
| MDNUM2_R | 2003-2009 | Re-identified secondary physician number in files starting in 2003 | N/A | |
| MDNUM2_S | 2001-2002 | Synthetic secondary physician number in files beginning in 2001 and discontinued in 2003 | N/A | |
| Data source information | DSNUM | 1988-1997 | Data source number | N/A |
| DSTYPE | 1988-1997 | Data source type: (1) State data organization, (2) Hospital association, (3) Consortia | N/A | |
| Record identifier, synthetic | KEY | 1998-2011 | Unique record number for file beginning in 1998 | Drop |
| Record identifier, synthetic | KEY_NIS | Unique record number for file beginning in 2012. | Add | |
| SEQ | 1988-1997 | Unique record number for NIS prior to 1998 | N/A | |
| SEQ_SID | 1994-1997 | Unique record number for NIS and SID prior to 1998 | N/A | |
| PROCESS | 1988-1997 | Processing number for NIS prior to 1998 | N/A | |
Table B-2. Data Elements in the NIS Hospital Weights Files
Data elements that are italicized are not included in the 2011 NIS Hospital Weights File, but are only available in previous years� files.
| Type of Data Element | HCUP Name | Years Available | Coding Notes | Plan for 2012 |
|---|---|---|---|---|
| Admission information | ||||
| Discharge counts | N_DISC_U | 1988-2011 | Number of target universe discharges in the stratum | Keep |
| S_DISC_U | 1998-2011 | Number of sampled discharges in the sampling stratum (NIS_STRATUM or STRATUM) | Keep | |
| S_DISC_S | 1988-1997 | Number of sampled discharges in the stratum STRAT_ST | N/A | |
| N_DISC_F | 1988-1997 | Number of frame discharges in the stratum | N/A | |
| N_DISC_S | 1988-1997 | Number of State's discharges in the stratum | N/A | |
| TOTAL_DISC | 1998-2011 | Total number of discharges from this hospital in the NIS | Keep | |
| TOTDSCHG | 1988-1997 | Total number of discharges from this hospital in the NIS | N/A | |
| Discharge weights | DISCWT | 1998-2011 | Discharge weight used in the NIS beginning in 1998. In all data years except 2000, this weight is used to create national estimates for all analyses. In 2000 only, this weight is used to create national estimates for all analyses, excluding those that involve total charges. | Keep |
| DISCWT_U | 1988-1997 | Discharge weights used in the NIS prior to 1998. | N/A | |
| DISCWT_F | 1988-1997 | Discharge weights to the sample frame are available only in 1988-1997 | N/A | |
| DISCWT_S | 1988-1997 | Discharge weights to the State are available only in 1988-1997 | N/A | |
| DISCWTcharge | 2000 | Discharge weight for national estimates of total charges for 2000 only. | N/A | |
| Discharge Year | YEAR | 1988-2011 | Discharge year | Keep |
| Hospital counts | N_HOSP_F | 1988-1997 | Number of frame hospitals in the stratum | N/A |
| N_HOSP_S | 1988-1997 | Number of State's hospitals in the stratum | N/A | |
| N_HOSP_U | 1988-2011 | Number of target universe hospitals in the stratum | Keep | |
| S_HOSP_S | 1988-1997 | Number of sampled hospitals in STRAT_ST | N/A | |
| S_HOSP_U | 1988-2011 | Number of sampled hospitals in the stratum (NIS_STRATUM or STRATUM) | Keep | |
| Hospital identifiers | HOSPID | 1988-2011 | HCUP hospital number (links to Inpatient Core files) | Drop |
| HOSP_NIS | NIS hospital number (links to Hospital Weights file; does not link to previous years) | Add | ||
| AHAID | 1988-2011 | AHA hospital identifier that matches AHA Annual Survey Database (not available for all States) | Drop | |
| IDNUMBER | 1988-2011 | AHA hospital identifier without the leading 6 (not available for all States) | Drop | |
| HOSPNAME | 1993-2011 | Hospital name from AHA Annual Survey Database (not available for all States) | Drop | |
| Hospital location | HOSPADDR | 1993-2011 | Hospital address from AHA Annual Survey Database (not available for all States) | Drop |
| HOSPCITY | 1993-2011 | Hospital city from AHA Annual Survey Database (not available for all States) | Drop | |
| HOSPST | 1988-2011 | Hospital State postal code for hospital (e.g., AZ for Arizona) | Drop | |
| HOSPSTCO | 2002-2011 | Modified Federal Information Processing Standards (FIPS) State/county code | Drop | |
| HFIPSSTCO | 2005-2011 | Unmodified Federal Information Processing Standards (FIPS) State/county code for the hospital. Links to the Area Resource File (available from the Bureau of Health Professions, Health Resources and Services Administration) | Drop | |
| HOSPZIP | 1993-2011 | Hospital ZIP Code from AHA Annual Survey Database (not available for all States) | Drop | |
| Hospital characteristics | HOSP_BEDSIZE | 1998-2011 | Bed size of hospital (STRATA): (1) small, (2) medium, (3) large) | Keep |
| H_BEDSZ | 1993-1997 | Bed size of hospital: (1) small, (2) medium, (3) large | N/A | |
| ST_BEDSZ | 1988-1992 | Bed size of hospital: (1) small, (2) medium, (3) large | N/A | |
| HOSP_CONTROL | 1998-2011 | Control/ownership of hospital, collapsed (STRATA): (0) government or private, collapsed category, (1) government, nonfederal, public, (2) private, non-profit, voluntary, (3) private, invest-own, (4) private, collapsed category | Drop | |
| H_CONTRL | 1993-1997, 2008-2011 | Control/ownership of hospital: (1) government, nonfederal (2) private, non-profit (3) private, investor-own | Keep | |
| ST_OWNER | 1988-1992 | Control/ownership of hospital: (1) public (2) private, non-profit (3) private for profit | N/A | |
| HOSP_LOCATION | 1998-2011 | Location: (0) rural, (1) urban | Drop | |
| H_LOC | 1993-1997 | Location: (0) rural, (1) urban | N/A | |
| HOSP_LOCTEACH | 1998-2011 | Location/teaching status of hospital (STRATA): (1) rural, (2) urban non-teaching, (3) urban teaching | Keep | |
| HOSP_MHSMEMBER | 2007-2011 | Multi-hospital system membership: (0) non-member, (1) member | Drop | |
| HOSP_MHSCLUSTER | 2007-2011 | Multi-hospital system cluster code: (1) centralized health system, (2) centralized physician/insurance health system, (3) moderately centralized health system, (4) decentralized health system, (5) independent hospital system, (6) unassigned | Drop | |
| HOSP_RNPCT | 2007-2011 | Percentage of RNs among all nurses (RNs and LPNs) | Drop | |
| HOSP_RNFTEAPD | 2007-2011 | RN FTEs per 1000 adjusted inpatient days | Drop | |
| HOSP_LPNFTEAPD | 2007-2011 | LPN FTEs per 1000 adjusted inpatient days | Drop | |
| HOSP_NAFTEAPD | 2007-2011 | Nurse aides per 1000 adjusted inpatient days | Drop | |
| HOSP_OPSURGPCT | 2007-2011 | Percentage of all surgeries performed in outpatient setting | Drop | |
| H_LOCTCH | 1993-1997 | Location/teaching status of hospital: (1) rural, (2) urban non-teaching, (3) urban teaching | N/A | |
| LOCTEACH | 1988-1992 | Location/teaching status of hospital: (1) rural, (2) urban non-teaching, (3) urban teaching | N/A | |
| HOSP_REGION | 1998-2011 | Region of hospital (Formerly STRATA): (1) Northeast, (2) Midwest, (3) South, (4) West | Keep | |
| HOSP_Division | Census Divisin of hospital (STRATA): (1) New England, (2) Middle Atlantic, (3) East North Central, (4) West North Central, (5) South Atlantic, (6) East South Central, (7) West South Central, (8) Mountain, (9) Pacific | Add | ||
| H_REGION | 1993-1997 | Region of hospital: (1) Northeast, (2) Midwest, (3) South, (4) West | N/A | |
| ST_REG | 1988-1992 | Region of hospital: (1) Northeast, (2) Midwest, (3) South, (4) West | N/A | |
| HOSP_TEACH | 1998-2011 | Teaching status of hospital: (0) non-teaching, (1) teaching | Drop | |
| H_TCH | 1993-1997 | Teaching status of hospital: (0) non-teaching, (1) teaching | N/A | |
| NIS_STRATUM | 1998-2011 | Stratum used to sample hospitals beginning in 1998; includes geographic region, control, location/teaching status, and bed size | Keep | |
| STRATUM | 1988-1997 | Stratum used to sample hospitals prior to 1998; includes geographic region, control, location/teaching status, and bed size | N/A | |
| STRAT_ST | 1988-1997 | Stratum for State-specific weights | N/A | |
| Hospital weights | HOSPWT | 1998-2011 | Weight to hospitals in AHA universe (i.e., total U.S.) beginning in 1998 | Drop |
| HOSPWT_U | 1988-1997 | Weight to hospitals in AHA universe (i.e., total U.S.) prior to 1998 | N/A | |
| HOSPWT_F | 1988-1997 | Weight to hospitals in the sample frame | N/A | |
| HOSPWT_S | 1988-1997 | Weight to hospitals in the State | N/A | |
Table B-3. Data Elements in the NIS Disease Severity Measures Files
Data elements that are italicized are not included in the 2011 NIS Inpatient Core files, but are only available in previous years� files. All other data elements listed below are available for all States in the 2011 NIS Disease Severity Measures files.
| Type of Data Element | HCUP Name | Years Available | Coding Notes | Plan for 2012 |
|---|---|---|---|---|
| Admission information | ||||
| AHRQ Comorbidity Software (AHRQ) | CM_AIDS | 2002-2011 | AHRQ comorbidity measure: Acquired immune deficiency syndrome : (0) Comorbidity is not present, (1) Comorbidity is present | Keep |
| CM_ALCOHOL | 2002-2011 | AHRQ comorbidity measure: Alcohol abuse: (0) Comorbidity is not present, (1) Comorbidity is present | Keep | |
| CM_ANEMDEF | 2002-2011 | AHRQ comorbidity measure: Deficiency anemias : (0) Comorbidity is not present, (1) Comorbidity is present | Keep | |
| CM_ARTH | 2002-2011 | AHRQ comorbidity measure: Rheumatoid arthritis/collagen vascular diseases : (0) Comorbidity is not present, (1) Comorbidity is present | Keep | |
| CM_BLDLOSS | 2002-2011 | AHRQ comorbidity measure: Chronic blood loss anemia: (0) Comorbidity is not present, (1) Comorbidity is present | Keep | |
| CM_CHF | 2002-2011 | AHRQ comorbidity measure: Congestive heart failure: (0) Comorbidity is not present, (1) Comorbidity is present | Keep | |
| CM_CHRNLUNG | 2002-2011 | AHRQ comorbidity measure: Chronic pulmonary disease: (0) Comorbidity is not present, (1) Comorbidity is present | Keep | |
| CM_COAG | 2002-2011 | AHRQ comorbidity measure: Coagulopathy: (0) Comorbidity is not present, (1) Comorbidity is present | Keep | |
| CM_DEPRESS | 2002-2011 | AHRQ comorbidity measure: Depression: (0) Comorbidity is not present, (1) Comorbidity is present | Keep | |
| CM_DM | 2002-2011 | AHRQ comorbidity measure: Diabetes, uncomplicated: (0) Comorbidity is not present, (1) Comorbidity is present | Keep | |
| CM_DMCX | 2002-2011 | AHRQ comorbidity measure: Diabetes with chronic complications: (0) Comorbidity is not present, (1) Comorbidity is present | Keep | |
| CM_DRUG | 2002-2011 | AHRQ comorbidity measure: Drug abuse: (0) Comorbidity is not present, (1) Comorbidity is present | Keep | |
| CM_HTN_C | 2002-2011 | AHRQ comorbidity measure: Hypertension, (combine uncomplicated and complicated): (0) Comorbidity is not present, (1) Comorbidity is present | Keep | |
| CM_HYPOTHY | 2002-2011 | AHRQ comorbidity measure: Hypothyroidism: (0) Comorbidity is not present, (1) Comorbidity is present | Keep | |
| CM_LIVER | 2002-2011 | AHRQ comorbidity measure: Liver disease: (0) Comorbidity is not present, (1) Comorbidity is present | Keep | |
| CM_LYMPH | 2002-2011 | AHRQ comorbidity measure: Lymphoma : (0) Comorbidity is not present, (1) Comorbidity is present | Keep | |
| CM_LYTES | 2002-2011 | AHRQ comorbidity measure: Fluid and electrolyte disorders: (0) Comorbidity is not present, (1) Comorbidity is present | Keep | |
| CM_METS | 2002-2011 | AHRQ comorbidity measure: Metastatic cancer: (0) Comorbidity is not present, (1) Comorbidity is present | Keep | |
| CM_NEURO | 2002-2011 | AHRQ comorbidity measure: Other neurological disorders: (0) Comorbidity is not present, (1) Comorbidity is present | Keep | |
| CM_OBESE | 2002-2011 | AHRQ comorbidity measure: Obesity: (0) Comorbidity is not present, (1) Comorbidity is present | Keep | |
| CM_PARA | 2002-2011 | AHRQ comorbidity measure: Paralysis: (0) Comorbidity is not present, (1) Comorbidity is present | Keep | |
| CM_PERIVASC | 2002-2011 | AHRQ comorbidity measure: Peripheral vascular disorders: (0) Comorbidity is not present, (1) Comorbidity is present | Keep | |
| CM_PSYCH | 2002-2011 | AHRQ comorbidity measure: Psychoses: (0) Comorbidity is not present, (1) Comorbidity is present | Keep | |
| CM_PULMCIRC | 2002-2011 | AHRQ comorbidity measure: Pulmonary circulation disorders: (0) Comorbidity is not present, (1) Comorbidity is present | Keep | |
| CM_RENLFAIL | 2002-2011 | AHRQ comorbidity measure: Renal failure: (0) Comorbidity is not present, (1) Comorbidity is present | Keep | |
| CM_TUMOR | 2002-2011 | AHRQ comorbidity measure: Solid tumor without metastasis : (0) Comorbidity is not present, (1) Comorbidity is present | Keep | |
| CM_ULCER | 2002-2011 | AHRQ comorbidity measure: Peptic ulcer disease excluding bleeding: (0) Comorbidity is not present, (1) Comorbidity is present | Keep | |
| CM_VALVE | 2002-2011 | AHRQ comorbidity measure: Valvular disease: (0) Comorbidity is not present, (1) Comorbidity is present | Keep | |
| CM_WGHTLOSS | 2002-2011 | AHRQ comorbidity measure: Weight loss: (0) Comorbidity is not present, (1) Comorbidity is present | Keep | |
| All Patient Refined DRG (3M) | APRDRG | 2002-2011 | All Patient Refined DRG | Keep |
| APRDRG_Risk_Mortality | 2002-2011 | All Patient Refined DRG: Risk of Mortality Subclass: (0) No class specified,(1) Minor likelihood of dying,(2) Moderate likelihood of dying,(3) Major likelihood of dying,(4) Extreme likelihood of dying | Keep | |
| APRDRG_Severity | 2002-2011 | All Patient Refined DRG: Severity of Illness Subclass: (0) No class specified,(1) Minor loss of function (includes cases with no comorbidity or complications),(2) Moderate loss of function,(3) Major loss of function,(4)Extreme loss of function | Keep | |
| All-Payer Severity-adjusted DRG (Optum Insight) | APSDRG | 2002-2009 | All-Payer Severity-adjusted DRG | N/A |
| APSDRG_Mortality_Weight | 2002-2009 | All-Payer Severity-adjusted DRG: Mortality Weight | N/A | |
| APSDRG_LOS_Weight | 2002-2009 | All-Payer Severity-adjusted DRG: Length of Stay Weight | N/A | |
| APSDRG_Charge_Weight | 2002-2009 | All-Payer Severity-adjusted DRG: Charge Weight | N/A | |
| Disease Staging (Thomson Reuters) | DS_DX_Category1 | 2002-2010 | Disease Staging: Principal Disease Category | N/A |
| DS_Stage1 | 2002-2010 | Disease Staging: Stage of Principal Disease Category | N/A | |
| DS_LOS_Level | 2002-2007 | Disease Staging: Length of Stay Level: (1) Very low (less than 5% of patients),(2) Low (5 - 25% of patients),(3) Medium (25 - 75% of patients),(4) High (75 - 95% of patients),(5) Very high (greater than 95% of patients) | N/A | |
| DS_LOS_Scale | 2002-2007 | Disease Staging: Length of Stay Scale | N/A | |
| DS_Mrt_Level | 2002-2007 | Disease Staging: Mortality Level: (0) Extremely low - excluded from percentile calculation (mortality probability less than .0001), (1) Very low (less than 5% of patients), (2) Low (5 - 25% of patients), (3) Medium (25 - 75% of patients), (4) High (75 - 95% of patients), (5) Very high (greater than 95% of patients) | N/A | |
| DS_Mrt_Scale | 2002-2007 | Disease Staging: Mortality Scale | N/A | |
| DS_RD_Level | 2002-2007 | Disease Staging: Resource Demand Level : (1) Very low (less than 5% of patients),(2) Low (5 - 25% of patients),(3) Medium (25 - 75% of patients),(4) High (75 - 95% of patients),(5) Very high (greater than 95% of patients) | N/A | |
| DS_RD_Scale | 2002-2007 | Disease Staging: Resource Demand Scale | N/A | |
| Linkage Data Elements | HOSPID | 2002-2011 | HCUP hospital identification number | Drop |
| HOSP_NIS | NIS hospital number (links to Hospital Weights file; does not link to previous years) | Add | ||
| KEY | 2002-2011 | HCUP record identifier | Drop | |
| KEY_NIS | Unique record number for file beginning in 2012 | Add | ||
Table B-4. Data Elements in the NIS Diagnosis and Procedure Groups Files
Data elements that are italicized are not included in the 2011 NIS Inpatient Core files, but are only available in previous years� files. All other data elements listed below are available for all States in the 2011 NIS Diagnosis and Procedure Groups files.
| Type of Data Element | HCUP Name | Years Available | Coding Notes | Plan for 2012 |
|---|---|---|---|---|
| Clinical Classifications Software category for Mental Health and Substance Abuse (CCS-MHSA) | CCSMGN1 � CCSMGN15 | 2005 - 2006 | CCS-MHSA general category for all diagnoses | N/A |
| CCSMSP1 � CCSMSP15 | 2005 - 2006 | CCS-MHSA specific category for all diagnoses | N/A | |
| ECCSMGN1 � ECCSMGN4 | 2005 - 2006 | CCS-MHSA general category for all external cause of injury codes | N/A | |
| Chronic Condition Indicator | CHRON1 � CHRON25 | 2005 - 2011 | Chronic condition indicator for all diagnoses: (0) non-chronic condition, (1) chronic condition. Beginning in 2009, the diagnosis array was increased from 15 to 25. | Keep |
| CHRON1 � CHRON25 | 2005 - 2011 | Chronic condition indicator body system for all diagnoses: (1) Infectious and parasitic disease, (2) Neoplasms, (3) Endocrine, nutritional, and metabolic diseases and immunity disorders, (4) Diseases of blood and blood-forming organs, (5) Mental disorders, (6) Diseases of the nervous system and sense organs, (7) Diseases of the circulatory system, (8) Diseases of the respiratory system, (9) Diseases of the digestive system, (10) Diseases of the genitourinary system, (11) Complications of pregnancy, childbirth, and the puerperium, (12) Diseases of the skin and subcutaneous tissue, (13) Diseases of the musculoskeletal system, (14) Congenital anomalies, (15) Certain conditions originating in the perinatal period, (16) Symptoms, signs, and ill-defined conditions, (17) Injury and poisoning, (18) Factors influencing health status and contact with health services. Beginning in 2009, the diagnosis array was increased from 15 to 25. | Keep | |
| Multi-Level Clinical Classifications Software (CCS) Category | DXMCCS1 | 2009 - 2011 | Multi-level clinical classification software (CCS) for principal diagnosis. Four levels for diagnoses presenting both the general groupings and very specific conditions | Keep |
| E_MCCS1 | 2009 - 2011 | Multi-level clinical classification software (CCS) for first listed E Code. Four levels for E codes presenting both the general groupings and very specific conditions | Keep | |
| PRMCCS1 | 2009 - 2011 | Multi-level clinical classification software (CCS) for principal procedure. Three levels for procedures presenting both the general groupings and very specific conditions | Keep | |
| Procedure Class | PCLASS1 � PCLASS15 | 2005 - 2011 | Procedure Class for all procedures: (1) Minor Diagnostic, (2) Minor Therapeutic, (3) Major Diagnostic, (4) Major Therapeutic | Keep |
| Linkage Data Elements | HOSPID | 2002 - 2011 | HCUP hospital identification number | Drop |
| HOSP_NIS | NIS hospital number (links to Hospital Weights file; does not link to previous years) | Add | ||
| KEY | 2002-2011 | HCUP record identifier | Drop | |
| KEY_NIS | Unique record number for file beginning in 2012 | Add |
1With the redesign, beginning with 2012 data AHRQ is changing the name from the "Nationwide Inpatient Sample" to the "National Inpatient Sample."
2Houchens, RL, Ross, DN, Setodji, CM, Uscher-Pines, L, and Roderick J.A. Little. Nationwide Inpatient Sample Redesign Final Report. September 14, 2012. Deliverable #1823.03. Agency for Healthcare Quality and Research, Rockville, MD.
3The nine census divisions (New England, Middle Atlantic, East North Central, West North Central, South Atlantic, East South Central, West South Central, Mountain, Pacific) will be the smallest geographic areas that can be represented using the new NIS rather than the four census regions of the original NIS (Northeast, South, Midwest, West).
4Because the NIS was not stratified by State, State-level estimates were not reliable in the original NIS. Dropping State identifiers also facilitated masking of hospital identifiers.
5LTAC hospitals are certified as acute care hospitals, but have an ALOS greater than 25 days. Patients in LTAC hospitals are often transferred from an intensive or critical care unit, generally have more than one serious condition, and are expected to improve and return home. LTAC hospitals typically provide comprehensive rehabilitation, respiratory therapy, head trauma treatment, and pain management services.
6This difference in hospital identifiers renders the NIS hospital-level weights inaccurate. Consequently, hospital-level weights will no longer be provided with the NIS.
7This includes a revision of the hospital sampling strata to stratify hospitals by the nine census divisions rather than by the four census regions used in the existing NIS design. Switching to the systematic design had no effect on the universe and, therefore, no effect on values of universe statistics.
8 For calendar year 2011, the data combined DRG version 28 (effective 10/1/2010 with 747 DRGs) and version 29 (effective 10/1/2011 with 751 DRGs). One DRG (number 15) in version 28 was replaced by two DRGs (numbers 16 and 17) in version 29, resulting in 752 different DRGs.
11Changes in the NIS Sampling and Weighting Strategy for 1998. Rockville, MD: Agency for Healthcare Research and Quality; January 2002. Available at https://www.hcup-us.ahrq.gov/db/nation/nis/reports/Changes_in_NIS_Design_1998.pdf.
12New Hampshire participates in HCUP, but did not provide data in time for the 2010 or 2011 NIS.
13U.S. Census Bureau. Census Bureau Regions and Divisions with State FIPS Codes. http://www2.census.gov/geo/pdfs/maps-data/maps/reference/us_regdiv.pdf. Accessed November 5, 2013.
14States and areas in italics do not participate in HCUP.
15This difference in hospital identifiers renders the NIS hospital-level weights inaccurate. Consequently, hospital-level weights will no longer be provided with the NIS.
16This includes a revision of the hospital sampling strata to stratify hospitals by the nine census divisions rather than by the four census regions used in the existing NIS design. Switching to the systematic design had no effect on the universe and, therefore, no effect on values of universe statistics.
17However, researchers will still be able to make estimates for census regions by aggregating census divisions.
18Census region: Northeast, Midwest, South, West
19Census division: New England, Middle Atlantic, East North Central, West North Central, South Atlantic, East South Central, West South Central, Mountain, Pacific
20The variance of a finite population statistic approaches zero as the sample size approaches the population size, regardless of the population size.
21500 simulated samples produced estimates statistically equal to the universe values.
22In last year�s report, the RME was labeled RRMSE (relative root mean squared error).
23For calendar year 2011, the data combined DRG version 28 (effective 10/1/2010 with 747 DRGs) and version 29 (effective 10/1/2011 with 751 DRGs). One DRG (number 15) in version 28 was replaced by two DRGs (numbers 16 and 17) in version 29, resulting in 752 different DRGs.
24SID counts are used for HCUP hospitals; modified AHA counts are used for non-HCUP hospitals.
25SID identifiers are used for HCUP hospitals; AHA identifiers are used for non-HCUP hospitals.
26The superpopulation perspective treats the population as infinite, resulting in larger sample variances compared with the finite population perspective. Most NIS studies are concerned with �long run� rates and averages.
27One state, North Dakota, was added to HCUP in 2011.
28This includes a revision of the hospital sampling strata to stratify hospitals by the nine census divisions rather than by the four census regions used in the existing NIS design. Switching to the systematic design had no effect on the universe and, therefore, no effect on values of universe statistics.
29On a related matter, given that the state will no longer be a NIS data element and that some variables, like race, are missing for entire states, we recommend that AHRQ provide a new Methods Series report with recommendations on missing data methods that NIS users can employ to address missing values.