TABLE OF CONTENTS
HIGHLIGHTS
INTRODUCTION
HCUP PARTNERS
1. OVERVIEW
2. DIAGNOSES
3. PROCEDURES
4. COSTS
5. MHSA
SOURCES/METHODS
DEFINITIONS
FOR MORE INFO
ACKNOWLEDGMENTS
CITATION
FACTS & FIGURES 2008 PDF
|
EXHIBIT 5.12 Emergency Department Visits for MH and SA Conditions (PDF)
Number of Discharges and Percent Distribution of Emergency Department (ED) Visits for Discharges with All-listed MHSA Diagnoses,* 2007
| ALL-LISTED CCS DIAGNOSIS |
NUMBER OF DISCHARGES IN THOUSANDS |
PERCENT OF DISCHARGES |
| All emergency department visits |
122,332 |
100.0% |
| Mental health-related disorders |
9,927 |
8.1 |
| Depression |
4,150 |
3.4 |
| Anxiety disorders |
3,277 |
2.7 |
| Bipolar disorders |
1,373 |
1.1 |
| Schizophrenia/other psychotic disorders |
1,205 |
1.0 |
| Suicide/intentional self-inflicted injury |
521 |
0.4 |
| Attention-deficit/conduct/disruptive behavior disorders |
496 |
0.4 |
| Pregnancy-related/other misc. MH disorders |
348 |
0.3 |
| Personality disorders |
231 |
0.2 |
| Adjustment disorders |
213 |
0.2 |
| Alcohol-related disorders |
2,815 |
2.3 |
| Drug-related disorders |
2,195 |
1.8 |
*All-listed diagnoses include the first-listed diagnosis plus additional conditions that coexist at the time of the ED visit, or that develop during the stay following the ED visit, and which have an effect on the treatment or length of stay in the ED or hospital. All-listed diagnoses are used because there is no indication of the principal cause of the ED visit on the discharge record.
Source: AHRQ, Center for Delivery, Organization, and Markets, Healthcare Cost and Utilization Project, Nationwide Emergency Department Sample, 2007. |
The latest available HCUP data on emergency department (ED) visits is for 2007, one year earlier than the most current data for inpatient stays.
- In 2007, there were 122.3 million ED visits for all conditions.
- An all-listed MH diagnosis appeared in discharge records for 8.1 percent of all ED visits (9.9 million visits).
- A diagnosis of depression was noted during 4.2 million ED visits and a diagnosis of anxiety during 3.3 million visits.
- An alcohol-related disorder was noted during 2.3 percent of ED visits (2.8 million visits) and a drug-related disorder during 1.8 percent of visits (2.2 million visits).

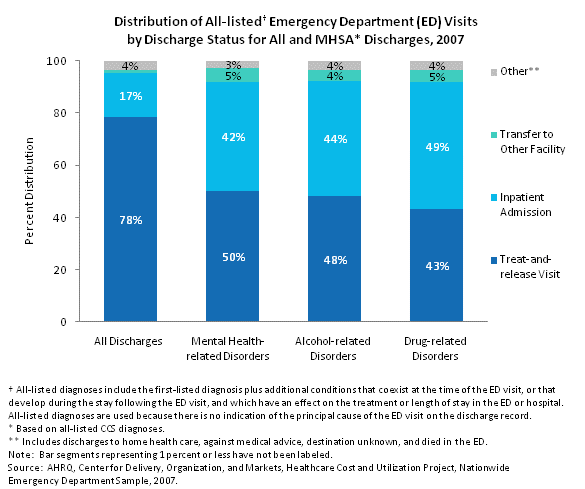
Distribution of all-listed emergency department (ED) visits by discharge status for all and MHSA discharges, 2007. Column chart. Percent distribution. All discharges: Other: 4%; transfer to other facility: 1%; inpatient admission: 17%; treat-and-release visit: 78%. Mental health-related disorders: Other: 3%; transfer to other facility: 5%; inpatient admission: 42%; treat-and-release visit: 50%. Alcohol-related disorders: Other: 4%; transfer to other facility: 4%; inpatient admission: 44%; treat-and-release visit: 48%. Drug-related disorders: Other: 4%; transfer to other facility: 5%; inpatient admission: 49%; treat-and-release visit: 43%. Note: All-listed diagnoses include the first-listed diagnosis plus additional conditions that coexist at the time of the ED visit, or that develop during the stay following the ED visit, and which have an effect on the treatment or length of stay in the ED or hospital. All-listed diagnoses are used because there is no indication of the principal cause of the ED visit on the discharge record. Note: MHSA discharges are based on all-listed CCS diagnoses. Note: Other includes discharges to home healthcare, against medical advice, destination unknown, and died in the ED.
- The vast majority of ED visits resulted in the patient’s treatment and release from the ED (78 percent). About one in five visits (20.4 million or 17 percent) resulted in inpatient hospital admission.12
- MHSA-related ED visits were more likely to result in inpatient admission than all discharges.
- Among ED visits involving a MH-related disorder, 42 percent resulted in inpatient admission to a short-term hospital and 5 percent in transfer to another facility, such as a psychiatric hospital, skilled nursing facility, or intermediate care facility.
- Similarly, 44 percent of ED visits involving an alcohol-related disorder resulted in inpatient admission and 4 percent were transferred to another facility.
- Almost half (49 percent) of ED visits involving a drug-related disorder led to inpatient admission; 5 percent of these visits resulted in transfer to another facility.

(text version)
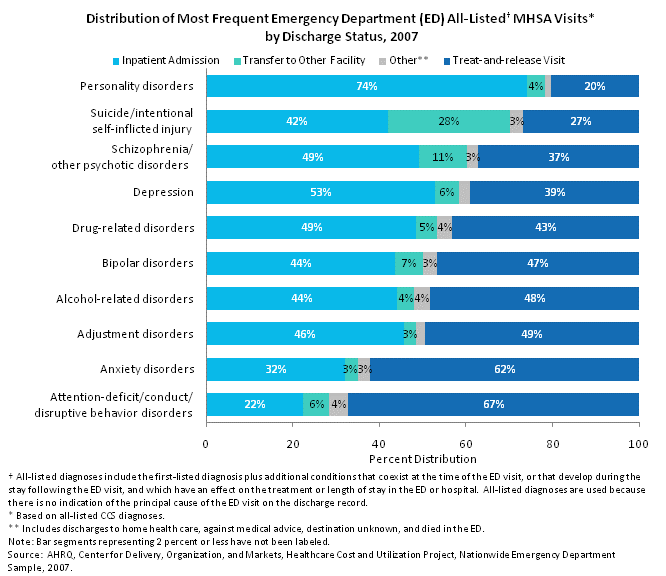
The discharge status of ED visits involving MHSA conditions varied by specific condition.
- Three-quarters of ED visits for personality disorders led to an inpatient admission in 2007 and another 4 percent in a transfer to another facility, such as a psychiatric hospital or to a skilled nursing or intermediate care facility. Only 20 percent of these visits resulted in treatment and release from the ED.
- Among ED visits for suicide or intentional self-inflicted injury, 42 percent ended in an inpatient admission and another 28 percent in transfer to another facility.
- Almost half of the ED visits involving a diagnosis of schizophrenia resulted in an inpatient admission, and in 11 percent of the cases the patient was transferred to another facility.
- ED visits with a depression diagnosis were more likely to result in admission to a healthcare facility (inpatient hospital admission, 53 percent, or transfer to another facility, 6 percent) than in treat-and-release (39 percent).
- For ED visits in which bipolar disorder was a listed diagnosis, 44 percent led to an inpatient admission; about half (47 percent) were treat-and-release. Another 7 percent of these visits resulted in the patient being transferred to a psychiatric hospital or to a skilled nursing or intermediate care facility.
- Around half of all drug- and alcohol- related visits to the ED ended in an inpatient admission to a hospital (49 percent and 44 percent, respectively), with another 4-5 percent resulting in admission to another facility.
- ED visits for adjustment disorders led to an inpatient admission 46 percent of the time and treat-and-release 49 percent of the time.
- ED visits involving an anxiety or attention-deficit/conduct/disruptive behavior disorder led more often to treat-and-release (62 and 67 percent, respectively) than to inpatient admissions or transfers.
|