| HCUP Methods Series Methods for Calculating Patient Travel Distance to Hospital in HCUP Data |
| Report #2021-02 |
| Contact Information: Healthcare Cost and Utilization Project (HCUP) Agency for Healthcare Research and Quality 5600 Fishers Lane Room 07W17B Mail Stop 7W25B Rockville, MD 20857 www.hcup-us.ahrq.gov For Technical Assistance with HCUP Products: Email: hcup@ahrq.gov or Phone: 1-866-290-HCUP |
| Recommended Citation: Weiss AJ, Pickens G, Roemer M. Methods for Calculating Patient Travel Distance to Hospital in HCUP Data. 2021. HCUP Methods Series Report # 2021-02 ONLINE. December 6, 2021. U.S. Agency for Healthcare Research and Quality. Available: www.hcup-us.ahrq.gov/reports/methods/methods.jsp. |
LIST OF REPORT SUPPLEMENTS Supplement 1. Distribution of difference (in miles) between geocode methods, by patient region, division, and urban/rural location, 2018 Supplement 2. Distribution of travel distance (in miles) by scenario, patient region, division, and urban/rural location, 2018 Supplement 3. Distribution of difference in travel distance (in miles) between scenarios, by patient region, division, and urban/rural location, 2018 This report examines patient travel distance to the hospital using inpatient data from the Healthcare Cost and Utilization Project (HCUP). Different methods are compared for identifying the latitude and longitude coordinates (geocodes) of the patient and hospital locations. Patient location is determined from the patient ZIP Code in HCUP data using two different methods of geocoding: geographic centroid versus population-weighted centroid of the ZIP Code. Hospital location is determined from the hospital address provided by the American Hospital Association (AHA) using two different geocoding methods: AHA-provided geocodes versus Google Maps geocodes. Finally, the distance between the patient and hospital location was determined using two different methods for calculating travel distance: straight line versus driving distance. There was a relatively small difference between the two patient geocoding methods (median of 0.6 miles) and a very small difference between the two hospital geocoding methods (median of 0.02 miles). Overall, the median straight-line patient-hospital travel distance was 6.6 miles, with 75 percent of distances less than 15 miles and 90 percent of distances less than 30 miles. The median driving distance was 8.7 miles. Most of the difference in travel distance was due to the distance metric (driving vs. straight-line) with little difference due to the patient or hospital geocoding method. Driving distances were approximately 30 percent longer on average than straight-line distances, and this relationship was relatively constant with only small variations for geographic area. Geographically, the longest distances were in the South region, East South Central division, and noncore (rural) areas. The shortest distances were in the Northeast region, New England division, and large central metropolitan areas. Distances were generally longer for patients residing in ZIP Codes with greater area (covering more square miles). These results may be useful to researchers studying how patient travel distance to the hospital relates to topics such as healthcare access, decisions about where to obtain hospital care, and outcomes of medical and surgical treatment. Patient travel distance to the hospital is an important factor related to access to care and where patients obtain inpatient care. The distance between a patient�s residence and the nearest hospital has increased in recent years.1,2 From 2005 to 2015, the number of people who lived more than 60 minutes from any hospital increased by more than 80 percent.3 Research has focused on how patients� distance to the nearest hospital has been affected by hospital closures and mergers.4 In addition to studies focused on healthcare access, travel distance also is an important metric for research that explores how patient choice, type of illness and surgical needs, and hospital quality impact where patients receive inpatient care. For example, patients will travel farther for an elective admission than they will for an emergent admission.5 Travel distance also may be related to treatment outcomes. In one study, patients who traveled farther to high-volume centers for treatment of pancreatic cancer had better postoperative outcomes than patients who were treated locally at low-volume centers.6 Other studies exploring factors related to travel distance have found longer travel distances for patients who are younger, have higher levels of education, are of White race, are from higher income areas, reside in rural areas, are in better health, and are privately insured.7,8,9,10 Understanding the distance patients travel to obtain hospital care also has important policy implications, because disparities in travel distance may affect access to care, costs associated with travel, and inequities in care.11,12 Methods for defining travel distance require determining the patient and hospital locations and specifying a metric for measuring the distance between them. For patient location, patient ZIP Code centroids are frequently used because exact patient residence address information is frequently unavailable in research datasets due to confidentiality.13 For hospital location, hospital addresses are known and precise locations can typically be determined. To measure the distance between the patient location and the point of care (hospital or emergency department), the shortest or "straight-line" distance (i.e., the geodetic or great circle distance) is commonly used because it can be readily calculated (e.g., through statistical software programs such as SAS®).14,15 An alternative distance metric that has been used is the driving distance or driving times that can be obtained from various mapping software such as Google Maps, 16,17,18 MapQuest,19 OpenStreetMaps,20 and ArcGIS Network Analyst.21 HCUP data are the most comprehensive source of hospital inpatient stays in the United States and may be a valuable resource for research involving the distance that patients travel to the hospital. This report focuses on describing methods for calculating patient-hospital travel distance using HCUP data. The objective of this report is to compare patient-hospital travel distances based on HCUP inpatient data using two different methods of geocoding patient and hospital locations and two different methods of calculating the distance between the patient and hospital. Geocoding entails obtaining the latitude and longitude coordinates of the patient or hospital location. Table 1 provides a summary of the three scenarios that are compared in this report. Table 1. Scenarios to compare patient location, hospital location, and travel distance measures |
| Scenario | Patient geocoding method | Hospital geocoding method | Distance measure |
|---|---|---|---|
| Baseline: standard, most available approach |
A. Geographic centroid of patient�s ZIP Code (calculated in SAS) | A. AHA-provided geocode of AHA-defined hospital | A. Straight-line distance (calculated in SAS) |
| Scenario 1: more precise location methods |
B. Population-weighted centroid of patient�s ZIP Code (from Esri) | B. Google Maps geocode of AHA-defined hospital address | A. Straight-line distance (calculated in SAS) |
| Scenario 2: more precise location methods and distance metric |
B. Population-weighted centroid of patient�s ZIP Code (from Esri) | B. Google Maps geocode of AHA-defined hospital address | B. Driving distance (from Google Maps) |
| Abbreviation: AHA, American Hospital Association | |||
The Baseline scenario represents a relatively simple and accessible approach to obtain travel distance. Patient location is defined as the geographic centroid of the patient�s ZIP Code, the coordinates of which can be readily obtained using SAS software. Hospital location is defined as the geocode provided by the American Hospital Association (AHA). Finally, the distance between the patient and hospital is determined by the straight-line distance calculated using SAS software. Scenario 1 employs the same straight-line distance method (from SAS) as the Baseline scenario but uses alternative patient and hospital geocodes that may be somewhat more precise but also may be more difficult to obtain. Patient location is defined as the population-weighted centroid of the patient�s ZIP Code obtained from ZIP Code files available from Esri. Hospital location is the geocode of the AHA-defined hospital address produced by Google Maps Scenario 2 employs the same patient and hospital geocoding methods (population-weighted ZIP Code centroids and Google Maps, respectively) as Scenario 1 but uses an alternative distance metric. Specifically, the distance between the patient and hospital locations is determined by the shortest driving distance obtained from Google Maps. State-level data on U.S. hospitalizations (inpatient care) are available through the HCUP State Inpatient Databases (SID), which include the patient residence ZIP Code (full patient address is not available in HCUP data) and an identifier for the hospital. The actual hospital address can be obtained by linking hospital identifiers in the SID to the AHA data (see the "Non-HCUP Data" section below). HCUP SID are available in 2018 for 47 States and the District of Columbia; 2018 SID are not available for Alabama, Idaho, and New Hampshire. The data used for this report are based on all available 2018 SID. Data exclusions are described below and summarized in Table 2 under the "Analysis File" section.
The following non-HCUP data were used to obtain hospital and patient geocodes (latitude and longitude coordinates) and to associate point ZIP Codes such as PO boxes with area-level ZIP Codes. 2018 American Hospital Association (AHA) Annual Survey of Hospitals The AHA database contains self-reported hospital information on a wide range of hospital characteristics, including organizational structure, service lines, and staffing. AHA data are used as part of the standard development of the HCUP databases (e.g., SID) to identify the types of hospitals (e.g., community hospitals) and to provide supplemental data elements, such as bed size, teaching status, and control/ownership of the hospital. We used the AHA data for this report to obtain the geocode of the hospital for the Baseline scenario and the hospital address to use for obtaining the Google Maps geocode. We identified a few cases where the AHA hospital geocodes appeared to be incorrect (i.e., the ZIP Code of the hospital address provided in the AHA data and the AHA-provided geocode did not coincide). In some cases, we were able to determine that the ZIP Code was incorrect, and in other cases, the geocode was incorrect. In two cases, these appeared to be extreme geocode errors whereby the geocode put the hospital in a different State from the ZIP Code. These errors were infrequent. We used the AHA hospital address and geocode data as provided in the AHA database. Our Scenario 1 used a more precise measure of hospital location based on Google Maps that would eliminate these AHA data errors. SAS SASHELP.ZIPCODE This SAS dataset contains the geographic centroid and county assignment for each ZIP Code. SAS obtains the ZIP Code geocodes included in this dataset from ZipCodeDownload.com. We used this SAS dataset to obtain the geocodes of the patients� ZIP Code geographic centroids to define patient location under the Baseline scenario. Visual examination comparing the SAS version of the ZIP Code geographic centroids with geographic centroids computed directly from the Esri 2018 USA Zip Code Areas file (described below) using GIS software (QGIS version 3.14.16, open source) revealed instances where the SAS-provided geographic centroids appeared to be incorrect (e.g., in a far corner of a ZIP Code or in an entirely different ZIP Code). We used the SAS dataset geographic ZIP Codes as provided for the Baseline scenario. Our Scenarios 1 and 2 used an alternative measure of patient location defined as the population-weighted ZIP Code centroid provided by Esri. Esri 2018 USA ZIP Code Points24 This file contains "five-digit U.S. ZIP Code areas as points, plus all ZIP Codes that have no associated area such as post office box ZIP Codes and single site ZIP Codes (government, building, or organization)."25 Points are the latitude and longitude coordinates of the population-weighted centroid of the ZIP Code. Fields in the data file include ZIP Code, post office name, and type for the ZIP Code locations in the United States. There are two types of ZIP Codes: those that cover a defined geographic area and those that do not cover any geographic area (e.g., post offices or large-volume customers). We accessed this file to obtain the population-weighted centroids of the patient�s ZIP Code for Scenarios 1 and 2 and to identify ZIP Codes that do not cover any geographic area in order to map them to their enclosing ZIP Code area. Esri 2018 USA Zip Code Areas26 This file contains "five-digit ZIP Code areas used by the U.S. Postal Service to deliver mail more effectively."27 Areas are defined by a sequence of latitude/longitude pairs that create a polygon defining each ZIP Code. Fields in the data file include ZIP Code, post office name, population, square mile area, and latitude/longitude coordinates for the ZIP Code area. This file was used to associate ZIP Codes that do not cover any geographic area (i.e., ZIP Codes with a post office box or other single delivery site) with the ZIP Code area enclosing it using GIS software (QGIS version 3.14.16, open source)28 and to obtain the area (square miles) of the ZIP Code. Table 2 provides a summary of the HCUP 2018 inpatient data included in the analysis file used for this report. Data exclusions, as described in the "HCUP Data" section above, are presented in the table along with the number of impacted records Table 2. Construction of analysis file: inclusions and exclusions from HCUP SID, 2018 |
| Distance analysis file build steps | Included records | Excluded records (from prior step) | ||||
|---|---|---|---|---|---|---|
| Discharges | Patient ZIP Codes | Unique hospital / patient ZIP Code pairs | Discharges | Patient ZIP Codes | Unique hospital / patient ZIP Code pairs | |
| 1. Initial file: All 2018 HCUP SID data for community, nonrehabilitation, non-LTAC hospitals that map to AHA data. | 34,254,432 | 41,635 | 1,141,891 | - | - | - |
| 2. Exclude data for hospitals and patients not in the continental United States (i.e., Alaska, Hawaii, U.S. territories). | 34,072,002 | 32,848 | 1,130,291 | 182,430 | 8,787 | 11,600 |
| 3. Exclude data for patient ZIP Codes with no Esri reference data and use reference data to map unique ZIP Codes (e.g., PO boxes) to surrounding ZIP Code area. | 34,028,846 | 30,511 | 1,074,774 | 43,156 | 2,337 | 55,517 |
| 4. Exclude data for patients transferred in from another hospital. | 30,687,994 | 30,494 | 985,802 | 3,340,852 | 17 | 88,972 |
| 5. Exclude extreme travel distances under the Baseline scenario. ANALYTIC UNIVERSE |
30,278,849 | 30,419 | 690,451 | 409,145 | 75 | 295,351 |
| 6. Exclude pairs not sampled for Google Maps processing (Scenario 2). | 11,296,867 | 29,499 | 261,704 | 18,981,982 | 29,840 | 428,747 |
| 7. Exclude sampled pairs with no distances available under Scenario 2. ANALYTIC SAMPLE |
11,296,457 | 29,476 | 261,639 | 410 | 23 | 65 |
| Abbreviations: AHA, American Hospital Association; HCUP, Healthcare Cost and Utilization Project; LTAC, long-term acute care hospital; PO, post office; SID, State Inpatient Databases | ||||||
The initial HCUP data were 2018 SID from 47 States and the District of Columbia (not included are Alabama, Idaho, and New Hampshire) with a total of 34,254,432 discharges, 41,635 unique patient ZIP Codes, and 1,141,891 unique hospital/patient ZIP Code pairs. Following exclusions, the final analytic universe for this report as produced in step 5 of Table 2 was 30,278,849 discharges, 30,419 patient ZIP Codes, and 690,451 unique hospital/patient ZIP Code pairs. Compared with the initial data, the final analytic universe had:
Steps 6 and 7 represent an approximately one-third sample of hospital/patient ZIP Code pairs used to obtain driving distances from Google Maps (Scenario 2). Discharges in the analytic sample were weighted to represent the universe of all discharges (step 5) in the analysis, as subsequently described. METHODS OF GEOCODING AND CALCULATING TRAVEL DISTANCE HCUP data only provide patient residence ZIP Code; more specific patient residence location information (e.g., patient street address) is not part of the HCUP data in order to protect patient identity.29 To approximate the patient location for calculating travel distances, we used two different patient geocoding methods:
We used two different hospital geocoding methods to determine the hospital location for calculating travel distances:
The hospital geocodes under Method (B) were originally obtained for all hospitals in the 2018 HCUP data (including hospitals that were not part of this report) as part of the development of the HCUP Hospital Market Structure (HMS) files. This geocoding process is summarized below:
Patient-Hospital Travel Distance Two different patient-hospital distance measures were used to calculate the travel distance between the patient and hospital.
The process for obtaining travel distances under Method (B) is summarized below:
Table 3. Weights applied to discharges sampled for Scenario 2 |
| Pairs sampled | Sample, discharges | Universe, discharges | Weight |
|---|---|---|---|
| Certainty pairs | 489,370 | 489,370 | 1.000000 |
| Probability pairs | 10,807,497 | 29,789,479 | 2.756372 |
| Total | 11,296,867 | 30,278,849 |
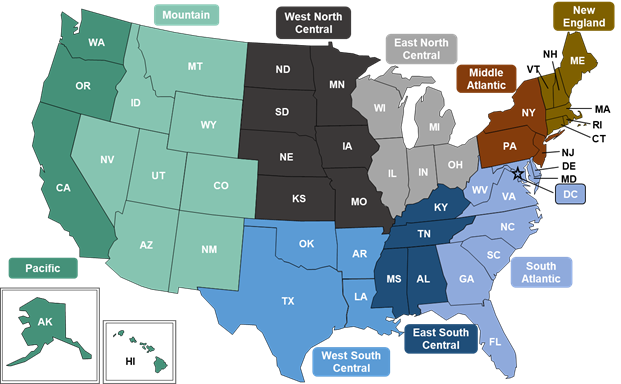
COMPARING METHODS OF GEOCODING AND CALCULATING TRAVEL DISTANCE Comparing Methods of Geocoding Patients and Hospitals Table 4 compares the distance between the two patient geocoding methods (geographic centroid vs. population-weighted centroid of the patient�s ZIP Code) and the distance between the two hospital geocoding methods (Google Maps vs. AHA). For reference, the median area of the patient�s ZIP Code in square miles is also provided. Analysis is based on the universe of 30,278,849 discharges from 690,451 unique hospital/patient ZIP Code pairs. The median and interquartile range (IQR) are provided overall and for three patient geographic areas: census region, census division, and urban/rural location. Census region and division are defined by the U.S. Census Bureau geography as illustrated in Figure 1. Figure 1. Nine U.S. census divisions across four U.S. census regions Northeast (orange), Midwest (grey), South (blue), and West (green)
Color-coded map showing the nine U.S. census divisions across the four U.S. census regions. The Northeast contains two divisions: New England (Connecticut, Maine, Massachusetts, New Hampshire, Rhode Island, Vermont) and Middle Atlantic (New Jersey, New York, Pennsylvania). The Midwest contains two divisions: East North Central (Indiana, Illinois, Michigan, Ohio, Wisconsin) and West North Central (Iowa, Kansas, Minnesota, Missouri, Nebraska, North Dakota, South Dakota). The South contains three divisions: South Atlantic (Delaware, District of Columbia, Florida, Georgia, Maryland, North Carolina, South Carolina, Virginia, West Virginia), East South Central (Alabama, Kentucky, Mississippi, Tennessee), and West South Central (Arkansas, Louisiana, Oklahoma, Texas). The West contains two divisions: Mountain (Arizona, Colorado, Idaho, Nevada, New Mexico, Montana, Utah, Wyoming) and Pacific (Alaska, California, Hawaii, Oregon, Washington). Urban/rural location uses the classification scheme for U.S. counties developed by the National Center for Health Statistics (NCHS). This classification scheme is based on the Office of Management and Budget (OMB) definition of a metropolitan service area as including a city and a population of at least 50,000 residents.36
Supplement 1 provides additional geocoding distance difference statistics (minimum and maximum values, and the 1st, 5th, 10th, 90th, 95th, and 99th percentiles) as well as statistics for census division by urban/rural location. Table 4. Difference (in miles) between geocode methods, by patient region, division, and urban/rural location, 2018 |
| Patient geographic area | Number of discharges | Distance between patient geocodes (geographic vs. population centroids) | Distance between hospital geocodes (Google Maps vs. AHA) | Median area of patient�s ZIP Code, square miles | ||
|---|---|---|---|---|---|---|
| Median | IQR | Median | IQR | |||
| Overall | 30,278,849 | 0.57 | 0.95 | 0.02 | 0.04 | 21.21 |
| Census region | ||||||
| Northeast | 5,642,604 | 0.36 | 0.62 | 0.02 | 0.05 | 9.38 |
| Midwest | 6,813,637 | 0.54 | 0.79 | 0.02 | 0.05 | 24.84 |
| South | 11,840,725 | 0.74 | 1.24 | 0.02 | 0.05 | 33.82 |
| West | 5,981,883 | 0.53 | 0.86 | 0.02 | 0.03 | 13.47 |
| Census division | ||||||
| New England | 1,316,203 | 0.40 | 0.57 | 0.02 | 0.04 | 13.77 |
| Middle Atlantic | 4,326,401 | 0.34 | 0.63 | 0.03 | 0.05 | 6.90 |
| East North Central | 4,756,279 | 0.53 | 0.77 | 0.03 | 0.05 | 20.49 |
| West North Central | 2,057,358 | 0.55 | 0.84 | 0.01 | 0.04 | 41.66 |
| South Atlantic | 6,593,006 | 0.72 | 1.17 | 0.02 | 0.05 | 28.99 |
| East South Central | 1,485,736 | 0.95 | 1.47 | 0.02 | 0.07 | 71.81 |
| West South Central | 3,761,983 | 0.71 | 1.28 | 0.02 | 0.04 | 34.64 |
| Mountain | 1,869,929 | 0.76 | 1.32 | 0.02 | 0.03 | 19.71 |
| Pacific | 4,111,954 | 0.46 | 0.71 | 0.02 | 0.03 | 11.87 |
| Urban/rural location | ||||||
| Large central metropolitan | 9,476,906 | 0.34 | 0.46 | 0.03 | 0.04 | 7.36 |
| Large fringe metropolitan | 7,495,376 | 0.56 | 0.89 | 0.02 | 0.04 | 19.26 |
| Medium metropolitan | 6,278,831 | 0.69 | 1.04 | 0.02 | 0.05 | 29.30 |
| Small metropolitan | 2,789,001 | 0.91 | 1.30 | 0.02 | 0.04 | 66.30 |
| Micropolitan | 2,487,059 | 1.06 | 1.54 | 0.02 | 0.05 | 127.89 |
| Noncore | 1,751,676 | 1.16 | 1.80 | 0.02 | 0.04 | 141.11 |
| Abbreviation: AHA, American Hospital Association; IQR, interquartile range | ||||||
| Patient geographic area | Number of discharges | Baseline | Scenario 1 | Scenario 2* | |||
|---|---|---|---|---|---|---|---|
| Median | IQR | Median | IQR | Median | IQR | ||
| Overall | 30,277,975 | 6.60 | 11.33 | 6.38 | 11.22 | 8.70 | 14.52 |
| Census region | |||||||
| Northeast | 5,668,069 | 5.37 | 8.78 | 5.23 | 8.78 | 7.19 | 11.80 |
| Midwest | 6,796,353 | 6.44 | 12.03 | 6.31 | 12.13 | 8.51 | 15.41 |
| South | 11,821,334 | 7.83 | 13.50 | 7.74 | 13.35 | 10.37 | 17.07 |
| West | 5,992,220 | 5.83 | 9.36 | 5.49 | 9.19 | 7.62 | 12.25 |
| Census division | |||||||
| New England | 1,279,539 | 5.35 | 10.17 | 5.41 | 10.45 | 7.03 | 13.44 |
| Middle Atlantic | 4,388,530 | 5.40 | 8.29 | 5.20 | 8.32 | 7.22 | 11.29 |
| East North Central | 4,729,934 | 6.25 | 10.62 | 6.12 | 10.70 | 8.18 | 13.95 |
| West North Central | 2,066,419 | 7.41 | 16.41 | 7.18 | 16.27 | 9.63 | 19.81 |
| South Atlantic | 6,554,272 | 7.07 | 11.92 | 6.98 | 11.55 | 9.40 | 15.16 |
| East South Central | 1,490,042 | 10.11 | 19.51 | 10.37 | 18.79 | 13.51 | 22.69 |
| West South Central | 3,777,020 | 8.61 | 14.29 | 8.40 | 14.59 | 11.11 | 18.65 |
| Mountain | 1,805,465 | 6.53 | 10.58 | 5.84 | 10.11 | 7.91 | 13.27 |
| Pacific | 4,186,755 | 5.57 | 8.89 | 5.37 | 8.87 | 7.44 | 11.69 |
| Urban/rural location | |||||||
| Large central metropolitan | 9,456,092 | 5.09 | 6.34 | 4.99 | 6.32 | 6.79 | 8.85 |
| Large fringe metropolitan | 7,522,861 | 7.42 | 10.88 | 7.32 | 10.90 | 9.77 | 14.62 |
| Medium metropolitan | 6,270,798 | 6.27 | 10.11 | 6.18 | 9.87 | 8.27 | 12.34 |
| Small metropolitan | 2,817,827 | 5.98 | 12.95 | 5.41 | 12.97 | 7.38 | 16.13 |
| Micropolitan | 2,398,600 | 14.20 | 31.30 | 13.78 | 31.25 | 16.89 | 38.57 |
| Noncore | 1,811,797 | 26.21 | 31.10 | 26.05 | 31.73 | 32.13 | 38.77 |
| Abbreviation: IQR, interquartile range Notes: The analysis for all three scenarios excluded 874 discharges associated with 65 unique patient-hospital pairs that had no driving distance (returned from Google Maps with "route not available") under Scenario 2. For Scenario 2, analysis is based on weighted discharges. |
|||||||
| Patient geographic area | Number of discharges | Scenario 2 vs. Baseline (total difference) | Scenario 1 vs. Baseline (geocoding difference) | Scenario 2 vs. Scenario 1 (distance metric difference) | |||
|---|---|---|---|---|---|---|---|
| Median | IQR | Median | IQR | Median | IQR | ||
| Overall | 30,277,975 | 1.97 | 3.55 | (0.04) | 0.65 | 2.00 | 3.33 |
| Census region | |||||||
| Northeast | 5,668,069 | 1.58 | 3.21 | (0.04) | 0.41 | 1.71 | 2.98 |
| Midwest | 6,796,353 | 1.88 | 3.41 | (0.03) | 0.60 | 1.90 | 3.28 |
| South | 11,821,334 | 2.31 | 3.96 | (0.03) | 0.86 | 2.33 | 3.66 |
| West | 5,992,220 | 1.80 | 3.10 | (0.08) | 0.67 | 1.89 | 2.97 |
| Census division | |||||||
| New England | 1,279,539 | 1.58 | 3.28 | (0.06) | 0.46 | 1.76 | 3.03 |
| Middle Atlantic | 4,388,530 | 1.58 | 3.14 | (0.04) | 0.40 | 1.66 | 2.97 |
| East North Central | 4,729,934 | 1.77 | 3.20 | (0.05) | 0.60 | 1.77 | 3.05 |
| West North Central | 2,066,419 | 2.14 | 3.97 | (0.00) | 0.58 | 2.21 | 3.86 |
| South Atlantic | 6,554,272 | 2.13 | 3.63 | (0.02) | 0.82 | 2.19 | 3.35 |
| East South Central | 1,490,042 | 2.87 | 4.70 | 0.02 | 1.13 | 2.67 | 4.13 |
| West South Central | 3,777,020 | 2.45 | 4.12 | (0.04) | 0.81 | 2.47 | 3.93 |
| Mountain | 1,805,465 | 1.78 | 3.47 | (0.10) | 0.93 | 1.89 | 3.32 |
| Pacific | 4,186,755 | 1.80 | 3.00 | (0.07) | 0.60 | 1.89 | 2.87 |
| Urban/rural location | |||||||
| Large central metropolitan | 9,456,092 | 1.66 | 2.63 | (0.04) | 0.41 | 1.71 | 2.52 |
| Large fringe metropolitan | 7,522,861 | 2.22 | 3.62 | (0.05) | 0.63 | 2.27 | 3.44 |
| Medium metropolitan | 6,270,798 | 1.79 | 3.12 | (0.03) | 0.77 | 1.81 | 2.79 |
| Small metropolitan | 2,817,827 | 1.67 | 3.70 | (0.08) | 1.07 | 1.68 | 3.21 |
| Micropolitan | 2,398,600 | 2.87 | 6.67 | 0.01 | 1.19 | 2.71 | 6.45 |
| Noncore | 1,811,797 | 5.17 | 9.02 | (0.03) | 1.24 | 5.25 | 8.73 |
| Abbreviation: IQR, interquartile range Notes: The analysis for all three scenarios excluded 874 discharges associated with 65 unique patient-hospital pairs that had no driving distance (returned from Google Maps with "route not available") under Scenario 2. For Scenario 2, analysis is based on weighted discharges. |
|||||||
| Patient geographic area | Number of discharges | Scenario 2 vs. Baseline (total difference) | Scenario 1 vs. Baseline (geocoding difference) | Scenario 2 vs. Scenario 1 (distance metric difference) | |||
|---|---|---|---|---|---|---|---|
| RMSE | RMSE | RMSE | |||||
| Overall | 30,277,975 | 4.70 | 0.39 | 5.03 | |||
| Census region | |||||||
| Northeast | 5,668,069 | 4.05 | 0.14 | 4.11 | |||
| Midwest | 6,796,353 | 4.88 | 0.13 | 4.97 | |||
| South | 11,821,334 | 4.61 | 0.98 | 5.28 | |||
| West | 5,992,220 | 5.61 | 0.35 | 5.75 | |||
| Census division | |||||||
| New England | 1,279,539 | 4.08 | 0.18 | 4.13 | |||
| Middle Atlantic | 4,388,530 | 3.99 | 0.16 | 4.09 | |||
| East North Central | 4,729,934 | 4.35 | 0.13 | 4.42 | |||
| West North Central | 2,066,419 | 6.22 | 0.23 | 6.35 | |||
| South Atlantic | 6,554,272 | 4.19 | 1.65 | 5.12 | |||
| East South Central | 1,490,042 | 5.86 | 0.26 | 5.95 | |||
| West South Central | 3,777,020 | 5.19 | 0.17 | 5.27 | |||
| Mountain | 1,805,465 | 7.30 | 0.59 | 7.58 | |||
| Pacific | 4,186,755 | 4.67 | 0.25 | 4.78 | |||
| Urban/rural location | |||||||
| Large central metropolitan | 9,456,092 | 3.09 | 0.12 | 3.20 | |||
| Large fringe metropolitan | 7,522,861 | 4.11 | 0.16 | 4.23 | |||
| Medium metropolitan | 6,270,798 | 3.61 | 2.16 | 4.49 | |||
| Small metropolitan | 2,817,827 | 5.71 | 0.40 | 5.94 | |||
| Micropolitan | 2,398,600 | 8.13 | 0.45 | 8.22 | |||
| Noncore | 1,811,797 | 10.56 | 0.40 | 10.64 | |||
| Abbreviation: RMSE, root mean square error Notes: The analysis for all three scenarios excluded 874 discharges associated with 65 unique patient-hospital pairs that had no driving distance (returned from Google Maps with "route not available") under Scenario 2. For Scenario 2, analysis is based on weighted discharges. |
|||||||
| Covariate | Coefficient |
|---|---|
| Baseline distance | 1.1797 |
| Census division | |
| New England | 1.9454 |
| Middle Atlantic | 1.9970 |
| East North Central | 1.7714 |
| West North Central | 1.7067 |
| South Atlantic | 1.5099 |
| East South Central | 1.8704 |
| West South Central | 1.7828 |
| Mountain | 2.0252 |
| Pacific | 2.0232 |
| Urban/rural location | |
| Large central metropolitan | -0.7346 |
| Large fringe metropolitan | -0.5275 |
| Medium metropolitan | -1.4546 |
| Small metropolitan | -1.0043 |
| Micropolitan | -0.8427 |
| Noncore (reference category) | 0.0000 |
Overall, the coefficient to adjust the baseline distance is 1.1797; thus, a 5-mile straight-line distance would convert to a 5.90 mile driving distance (5*1.1797) before incorporating geographic characteristics. The coefficients allow for further refinement to the driving distance estimate based on the patient residence census division and urban/rural location. For example, a 5-mile straight-line distance in a medium metropolitan area in the South Atlantic division translates to a 5.95-mile driving distance: (5*1.1797) + 1.5099 � 1.4546 = 5.95. A 5-mile straight-line distance in a noncore area in the Mountain division translates to a 7.92-mile driving distance: (5*1.1797) + 2.0252 � 0.0000 = 7.92. The conversion of straight-line distance to driving distance varies by geographic area. The relative impact of geographic area on driving distance is larger for shorter distances. For example, for a patient residing in the Northeast in a large metropolitan area, the driving distance estimate is 2.4 miles for a corresponding 1-mile straight-line distance (more than double the distance), whereas the driving distance estimate is 36.6 miles for a corresponding 30-mile straight-line distance (less than one-fourth longer). Patient-hospital travel distance is an important metric for a wide range of research involving patient access to healthcare and patient choice of care. HCUP State inpatient data include patient residence ZIP Code and AHA-identifiable hospitals. In this report, we compared two methods of geocoding patient location, two methods of geocoding hospital location, and two travel distance measures. Most of the difference in travel distance between methods is associated with the distance measure (driving vs. straight-line) with little difference due to geocoding methods. The SAS ZIP Code and AHA hospital source data used for geocoding patient and hospital locations did have some errors. We did not attempt to correct these data errors in order to identify the overall impact of the data on geocoding and travel distance differences. Even with some source data errors, there was little change in travel distance using more refined approaches to geocoding patient and hospital location. Depending on the number of hospital-patient ZIP Code pairs, and the level of precision desired, HCUP data users may wish to closely examine and potentially resolve any source data errors (e.g., AHA hospital location, SAS ZIP Code geographic centroids). The results presented in this report suggest that this step may be unnecessary in most cases given the minimal impact on the results, but data correction may be more important when studying a small geographic area with limited sample size. HCUP data only provide patient residence ZIP Code and not complete address, so some imprecision exists in the patient location. The results presented in this report indicate that there is little difference in travel distance overall using patient geocodes defined as the geographic versus population-weighted centroids of the patient�s ZIP Code. However, the impact of imprecise patient location may be greater in ZIP Codes that cover large areas. The information presented in this report suggests approaches that researchers can use to estimate patient-hospital travel distances. The Baseline method (patient ZIP Code geographic centroid geocodes, AHA hospital geocodes, straight-line distance) provides a reasonable estimate of travel distances, especially for comparative purposes. Driving distance may be of more interest for studies where the distance itself is inherently important. In such cases, estimating driving distances from straight-line distances via the equation provided in this report may be a more tenable solution than obtaining driving distances directly from mapping software, especially in large volume. |
|
Alaska Department of Health and Social Services Alaska State Hospital and Nursing Home Association Arizona Department of Health Services Arkansas Department of Health California Office of Statewide Health Planning and Development Colorado Hospital Association Connecticut Hospital Association Delaware Division of Public Health District of Columbia Hospital Association Florida Agency for Health Care Administration Georgia Hospital Association Hawaii Laulima Data Alliance Hawaii University of Hawai'i at Hilo Illinois Department of Public Health Indiana Hospital Association Iowa Hospital Association Kansas Hospital Association Kentucky Cabinet for Health and Family Services Louisiana Department of Health Maine Health Data Organization Maryland Health Services Cost Review Commission Massachusetts Center for Health Information and Analysis Michigan Health & Hospital Association Minnesota Hospital Association Mississippi State Department of Health Missouri Hospital Industry Data Institute Montana Hospital Association Nebraska Hospital Association |
Nevada Department of Health and Human Services New Hampshire Department of Health & Human Services New Jersey Department of Health New Mexico Department of Health New York State Department of Health North Carolina Department of Health and Human Services North Dakota (data provided by the Minnesota Hospital Association) Ohio Hospital Association Oklahoma State Department of Health Oregon Association of Hospitals and Health Systems Oregon Office of Health Analytics Pennsylvania Health Care Cost Containment Council Rhode Island Department of Health South Carolina Revenue and Fiscal Affairs Office South Dakota Association of Healthcare Organizations Tennessee Hospital Association Texas Department of State Health Services Utah Department of Health Vermont Association of Hospitals and Health Systems Virginia Health Information Washington State Department of Health West Virginia Department of Health and Human Resources, West Virginia Health Care Authority Wisconsin Department of Health Services Wyoming Hospital Association |
1 Centers for Disease Control and Prevention. "Distance to Nearest Hospital" Files: NAMCS and NHAMCS (1999 to 2009). www.cdc.gov/nchs/data/ahcd/distance_to_nearest_hospital_file.pdf. Accessed November 6, 2020.
|