STATISTICAL BRIEF #106
|
|
February 2011
Lauren M. Wier, M.P.H., Anne Elixhauser Ph.D., Anne Pfuntner B.U.E.P., David H. Au, M.D., M.S.
Introduction Chronic obstructive pulmonary disease (COPD) is a heterogeneous group of respiratory conditions made up predominantly of chronic bronchitis and emphysema and is defined by airflow limitation that is not completely reversible.1 In the United States, current estimates suggest about 12 million people have been diagnosed with COPD, but there are likely many more who unknowingly have the disease.2 COPD recently became the third leading cause of death in the United States, and about half of those who have COPD die within 10 years of diagnosis.3 COPD is incurable; however, lifestyle changes, primarily quitting smoking, can moderate the rate of lung loss for many patients with COPD.2 COPD typically presents after prolonged exposure to smoking tobacco or other noxious inhaled substances. At the time of diagnosis, many patients have moderate to severe disease. As a result, COPD is primarily diagnosed in middle-aged and older adults.3 Because COPD is predominantly caused by smoking cigarettes, patients with COPD often have many coexisting conditions that are also associated with tobacco use including cardiovascular disease and diabetes. One of the hallmarks of COPD is exacerbation which marks an acute deterioration in symptoms. COPD exacerbations occur up to 2 to 3 times per year. The cause of these exacerbations is often unknown, though frequently patients have viral or bacterial infections. This Statistical Brief presents data from the Healthcare Cost and Utilization Project (HCUP) comparing patient characteristics and hospital utilization among patients 40 years and older for all COPD stays, including stays for an acute exacerbation of COPD and stays without an acute exacerbation (i.e., all other COPD stays).4 In addition, this report examines the secondary diagnoses commonly associated with a principal diagnosis of COPD, the principal diagnoses of patients who have COPD as a secondary diagnosis, and the procedures that are frequently performed during stays for COPD. All differences between estimates noted in the text are statistically significant at the 0.05 level or better. Findings In 2008, there were about 822,500 hospital stays for chronic obstructive pulmonary disease (COPD) among adults age 40 years and older. As shown in table 1, COPD stays that explicitly coded an acute exacerbation accounted for 514,000 (62.5 percent) of all COPD stays. The remaining COPD stays discharged with a principal diagnosis of COPD, but without explicitly noting "acute exacerbation," accounted for 308,500 (37.5 percent) of COPD hospitalizations. Thus, nearly 1 out of every 5 patients 40 years or older in U.S. hospitals has a diagnosis of COPD. The mean length of hospitalizations (about 4.7 days) and average cost per stay ($7,500) were similar for acute exacerbation and other COPD hospitalizations. Characteristics of COPD hospital stays While the vast majority of COPD stays were discharged to home, routine discharge was less common among acute exacerbation stays (65.0 percent) than among other COPD stays (71.5 percent). Conversely, the percentage of stays discharged to long term care (e.g., nursing homes and rehab) was greater among stays for acute exacerbation of COPD relative to other COPD (14.6 versus 10.9 percent). |
|
| Table 1. Characteristics of hospital stays for patients admitted to U.S. hospitals for COPD, principal diagnosis, 2008 | |||
| All COPD | Principal COPD diagnosis of acute exacerbation | Principal COPD diagnosis without acute exacerbation | |
|---|---|---|---|
| Number of discharges | 822,500 | 514,000 | 308,500 |
| Mean length of stay (days) | 4.8 | 4.7 | 4.8‡ |
| Mean hospital costs | $7,500 | $7,500 | $7,500‡ |
| Aggregate national costs | $6.1 billion | $3.8 billion | $2.3 billion |
| Percentage routine discharge to home | 67.4 | 65.0 | 71.5 |
| Percentage transferred to another facility (skilled nursing facility, intermediate care, and another type of facility such as a nursing home) | 13.2 | 14.6 | 10.9 |
| Percentage died in hospital | 1.6 | 1.8 | 1.3 |
| Primary expected payer (percentage) | |||
| Medicare | 68.7 | 71.6 | 64.0 |
| Medicaid | 9.8 | 8.8 | 11.5 |
| Privately insured | 15.5 | 14.1 | 17.8 |
| Uninsured | 3.4 | 3.1 | 4.1 |
| Mean age (years) | 68.7 | 69.7 | 67.2 |
| ‡ Non-acute exacerbation COPD discharges are not statistically different from acute exacerbation COPD discharges at p>0.05. Source: AHRQ, Center for Delivery, Organization, and Markets, Healthcare Cost and Utilization Project, Nationwide Inpatient Sample (NIS), 2008 | |||
Medicare was the most common expected payer for hospital stays for patients with acute exacerbation and other COPD (71.6; 64.0 percent), followed by private insurance (14.1; 17.8 percent) and Medicaid (8.8; 11.5 percent).
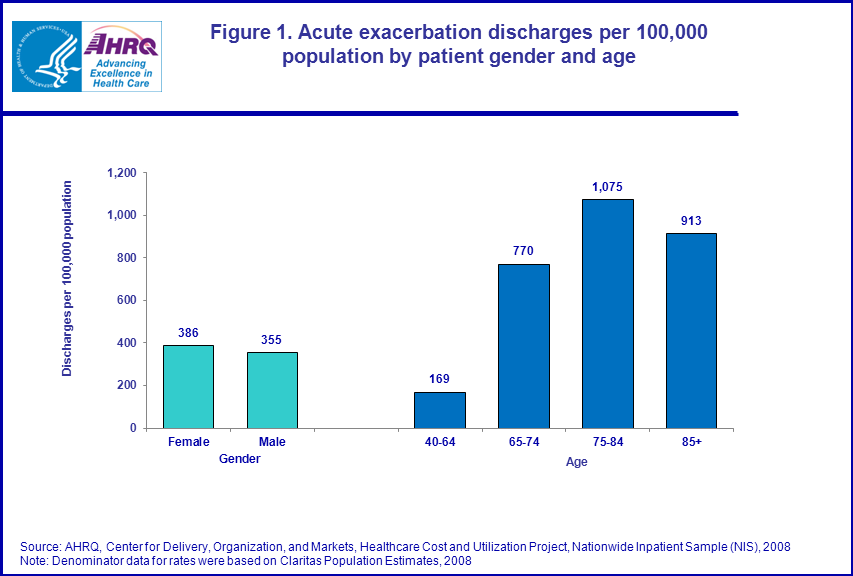
Patients with acute exacerbation were, on average, 2.5 years older than patients with other COPD (69.7 versus 67.2 years older, respectively). As shown in figure 1, hospitalization rates for acute exacerbation increased with age up to 75–84 years (1,075 stays per 100,000 population), but dropped for patients 85 years and older (913 stays per 100,000). The rate of hospitalization was slightly higher among females than males for all COPD stays, for stays with acute exacerbation and without. |
|
Figure 1. Acute exacerbation discharges per 100,000 population by patient sex and age. Bar chart; discharges per 100,000 population; by sex; female, 386; male 355; by age; ages 40 to 64, 169; ages 65 to 74, 770; ages 75 to 84, 1,075; age 85 and older, 913. Source: AHRQ, Center for Delivery, Organization, and Markets, Healthcare Cost and Utilization Project, Nationwide Inpatient Sample (NIS), 2008
Note: Denominator data for rates were based on Claritas Population Estimates, 2008 |
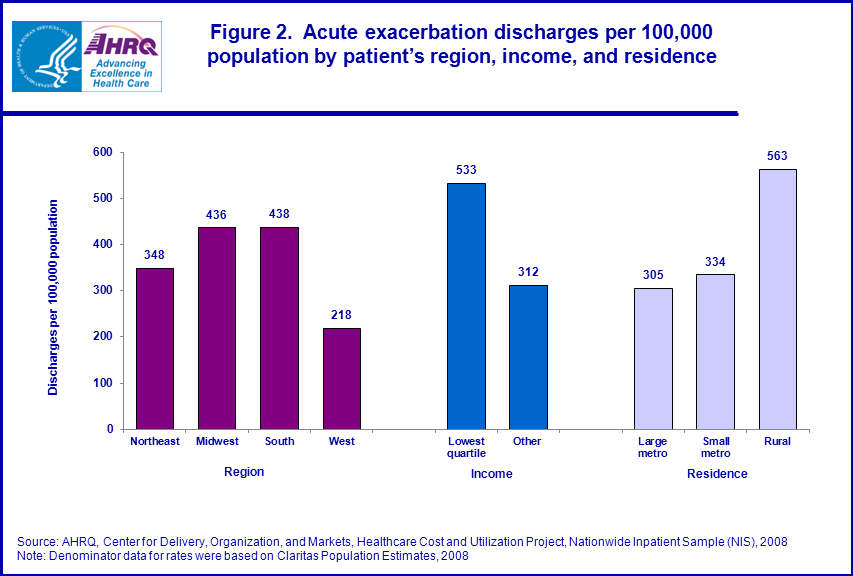
As shown in figure 2, hospitalization rates for acute exacerbation were highest in the Midwest and the South. These regions also had the highest smoking prevalence (about 19.5 percent, relative to 14.6 and 17.5 percent in the Northeast and West, respectively).5 Hospitalization rates for acute exacerbation were highest in the poorest communities and in rural areas. Although the definitions may not be identical, research indicates that smoking rates are higher among individuals with incomes below the poverty level (31.5 percent relative to 19.6 percent among those at or above poverty level)6 and among adults living in rural areas (22.2 percent versus 17.3 percent in suburban and 18.1 percent in urban areas).7
|
|
Figure 2. Acute exacerbation discharges per 100,000 population by patient’s region, income, and residence; Bar chart; discharges per 100,000 population; by region; Northeast, 348; Midwest, 436; South, 438; West, 218. By income; lowest quartile, 533; other, 312. By residence; large metro, 305; small metro, 334; rural, 563. Source: AHRQ, Center for Delivery, Organization, and Markets, Healthcare Cost and Utilization Project, Nationwide Inpatient Sample (NIS), 2008. Note: Denominator data for rates were based on Claritas Population Estimates, 2008 |
Most common comorbidities associated with COPD
Table 2 shows the ten most common comorbidities for hospitalized patients with COPD in 2008. Comorbidities are complicating conditions that effect the management of the main reason for hospitalization (or the principal diagnosis, in this case, COPD). Hypertension was the most common comorbidity, present among about half of hospital stays for patients with acute and other COPD. Other common comorbidities included current or past tobacco-related diagnoses (44–48 percent), coronary atherosclerosis (hardening of the arteries; 28–31 percent), and lipid disorders (28 percent). Diabetes without complication and congestive heart failure (CHF) each occurred in about one-quarter of acute exacerbation and other COPD stays. Patients with acute exacerbation experienced respiratory failure and pneumonia comorbidities more frequently than patients with other COPD. Over 20 percent of COPD patients with acute exacerbation had respiratory failure and/or pneumonia, compared to 13–15 percent for other COPD patients. |
| Table 2. Most common secondary diagnoses associated with a principal diagnosis of COPD, 2008 | ||||||
| Secondary diagnoses | All COPD | Acute exacerbation | Without acute exacerbation | |||
|---|---|---|---|---|---|---|
| Number (%) | Rank | Number (%) | Rank | Number (%) | Rank | |
| Essential hypertension | 415,800 (50.6%) | 1 | 257,500 (50.1%) | 1 | 158,300 (51.3%) | 1 |
| Current and/or past use/abuse of tobacco | 379,700 (46.2%) | 2 | 244,400 (47.5%) | 2 | 135,300 (43.9%) | 2 |
| Coronary atherosclerosis andother heart disease | 245,600 (29.9%) | 3 | 159,100 (31.0%) | 3 | 86,500 (28.0%) | 4 |
| Disorders of lipid metabolism | 228,400 (27.8%) | 4 | 141,100 (27.5%) | 4 | 87,300 (28.3%) | 3 |
| Diabetes mellitus without complication | 207,600 (25.2%) | 5 | 126,800 (24.7%) | 6 | 80,800 (26.2%) | 5 |
| Congestive heart failure | 196,900 (23.9%) | 6 | 130,000 (25.3%) | 5 | 66,900 (21.7%) | 6 |
| Fluid and electrolyte disorders | 178,700 (21.7%) | 7 | 113,500 (22.1%) | 7 | 65,300 (21.2%) | 8 |
| Cardiac dysrhythmias | 170,600 (20.7%) | 8 | 111,100 (21.6%) | 8 | 59,500 (19.3%) | 9 |
| Esophageal disorders | 166,500 (20.2%) | 9 | 100,000 (19.5%) | 11 | 66,500 (21.6%) | 7 |
| Respiratory failure | 153,300 (18.6%) | 10 | 105,800 (20.6%) | 10 | 47,500 (15.4%) | 11 |
| Pneumonia | 147,000 (17.9%) | 11 | 106,000 (20.6%) | 9 | 41,000 (13.3%) | 13 |
| Mood disorders (depressive and bipolar disorders) | 141,500 (17.2%) | 12 | 87,100 (16.9%) | 12 | 54,400 (17.6%) | 10 |
| Note: More than one secondary diagnosis may be recorded during a hospital stay. Note: The distribution of other COPD discharges is statistically different from the distribution of acute exacerbation discharges at p<0.05. Source: AHRQ, Center for Delivery, Organization, and Markets, Healthcare Cost and Utilization Project, Nationwide Inpatient Sample (NIS), 2008 | ||||||
Most common reasons for hospitalization of patients with a secondary diagnosis of COPD COPD is listed commonly as a secondary diagnosis during hospitalization, that is, a complicating condition that effects the management of a patient who is admitted for some other reason. COPD was a secondary diagnosis for 3.8 million hospital stays in 2008. Table 3 shows that pneumonia was the most common principal reason for hospitalization among patients with a secondary diagnosis of acute exacerbation COPD (22.3 percent). Respiratory failure was the principal diagnosis for 21.4 percent of patients with acute exacerbation COPD. Circulatory disorders represented 5 of the top 10 reasons for hospital admissions with a secondary diagnosis of COPD: CHF, coronary atherosclerosis, cardiac dysrhythmias, acute myocardial infarction (heart attack), and nonspecific chest pain. Nearly two-thirds (63 percent) of stays with a secondary diagnosis of acute exacerbation of COPD had a principal diagnosis of pneumonia, CHF, respiratory failure, or septicemia. These same principal diagnoses accounted for a much smaller share of stays without an acute exacerbation of COPD (21.3 percent). |
| Table 3. Most common principal diagnoses for patients with COPD as a secondary diagnosis, 2008 | ||||||
| All COPD* | Acute exacerbation* | Without acute exacerbation* | ||||
|---|---|---|---|---|---|---|
| Total stays with COPD as secondary diagnosis | 3,827,100 | 619,200 | 3,207,900 | |||
| Principal Diagnosis | Number (%) | Rank | Number (%) | Rank | Number (%) | Rank |
| Pneumonia | 370,800 (9.7%) | 1 | 138,000 (22.3%) | 1 | 232,800 (7.3%) | 1 |
| Congestive heart failure | 310,200 (8.1%) | 2 | 80,300 (13.0%) | 3 | 229,900 (7.2%) | 2 |
| Respiratory failure | 245,100 (6.4%) | 3 | 132,600 (21.4%) | 2 | 112,500 (3.5%) | 4 |
| Septicemia | 145,300 (3.8%) | 4 | 39,200 (6.3%) | 4 | 106,100 (3.3%) | 5 |
| Coronary atherosclerosis | 128,100 (3.3%) | 5 | 7,300 (1.2%) | 10 | 120,800 (3.8%) | 3 |
| Cardiac dysrhythmias | 115,100 (3.0%) | 6 | 11,600 (1.9%) | 7 | 103,500 (3.2%) | 6 |
| Acute myocardial infarction | 107,000 (2.8%) | 7 | 18,600 (3.0%) | 5 | 88,400 (2.8%) | 7 |
| Nonspecific chest pain | 85,400 (2.2%) | 8 | 4,300 (0.7%) | 15 | 81,100 (2.5%) | 8 |
| Cancer of bronchus; lung | 72,700 (1.9%) | 9 | 11,400 (1.8%) | 8 | 61,300 (1.9%)‡ | 10 |
| Complication of device; implant or graft | 70,500 (1.8%) | 10 | 3,400 (0.5%) | 23 | 67,100 (2.1%) | 9 |
| Aspiration pneumonia; food/emesis | 68,600 (1.8%) | 18 | 16,900 (2.7%) | 6 | 39,700 (1.2%) | 23 |
| Acute renal failure | 61,900 (1.6%) | 11 | 10,100 (1.6%) | 9 | 58,500 (1.8%) | 12 |
| *Based on secondary diagnoses. ‡The distribution of other COPD discharges is not statistically different from the distribution of acute exacerbation discharges at p<0.05. Source: AHRQ, Center for Delivery, Organization, and Markets, Healthcare Cost and Utilization Project, Nationwide Inpatient Sample (NIS), 2008 | ||||||
Procedures associated with hospitalizations related to COPD Table 4 shows that invasive intubation/ventilation and noninvasive ventilation were the most frequently performed procedures during stays for acute exacerbation and other COPD. Both types of intubation were used slightly more frequently among patients with acute exacerbation—4.3 percent acute exacerbation patients received invasive ventilation and 3.7 percent received noninvasive ventilation, compared with 3.0 percent for both types of ventilation for patients without acute exacerbation. Blood transfusion was more commonly performed during stays for acute exacerbation (2.8 percent of stays) than during other COPD stays (2.2 percent of stays). Five of the top ten procedures were diagnostic—bronchoscopy and biopsy of bronchus, echocardiogram, upper gastrointestinal endoscopy, computer tomography (CT) scan of chest, and cardiac catheterization. |
| Table 4. All-listed procedures for patients admitted to U.S. hospitals with a principal diagnosis of COPD, 2008 | ||||||
| All-listed procedures | All COPD | Acute exacerbation | Without acute exacerbation | |||
|---|---|---|---|---|---|---|
| Number (%) | Rank | Number (%) | Rank | Number (%) | Rank | |
| Invasive intubation and ventilation | 31,200 (3.8%) | 1 | 22,000 (4.3%) | 1 | 9,200 (3.0%) | 2 |
| Noninvasive ventilation | 28,600 (3.5%) | 2 | 19,200 (3.7%) | 2 | 9,400 (3.0%) | 1 |
| Blood transfusion | 21,200 (2.6%) | 3 | 14,200 (2.8%) | 3 | 6,900 (2.2%) | 4 |
| Diagnostic bronchoscopy and biopsy of bronchus | 15,800 (1.9%) | 4 | 8,300 (1.6%) | 6 | 7,400 (2.4%) | 3 |
| Diagnostic ultrasound of heart (echocardiogram) | 15,700 (1.9%) | 5 | 9,700 (1.9%) | 4 | 6,000 (1.9%)‡ | 5 |
| Upper gastrointestinal endoscopy; biopsy | 13,500 (1.6%) | 6 | 8,500 (1.7%) | 5 | 5,000 (1.6%)‡ | 6 |
| CT scan chest | 8,100 (1.0%) | 7 | 5,100 (1.0%) | 7 | 3,000 (1.0%)‡ | 8 |
| Diagnostic cardiac catheterization; coronary arteriography | 8,100 (1.0%) | 8 | 4,800 (0.9%) | 8 | 3,300 (1.1%) | 7 |
| Hemodialysis | 6,900 (0.8%) | 9 | 4,300 (0.8%) | 9 | 2,600 (0.8%)‡ | 9 |
| Prophylactic vaccinations and inoculations | 6,100 (0.7%) | 10 | 3,600 (0.7%) | 10 | 2,600 (0.8%) | 10 |
| ‡ The distribution of other COPD discharges is not statistically different from the distribution of acute exacerbation discharges at p<0.05. Source: AHRQ, Center for Delivery, Organization, and Markets, Healthcare Cost and Utilization Project, Nationwide Inpatient Sample (NIS), 2008 | ||||||
Data Source The estimates in this Statistical Brief are based upon data from the 2008 HCUP Nationwide Inpatient Sample (NIS) Supplemental source included data on regional population estimates from "Table 1: Annual Estimates of the Resident Population for the United States, Regions, States, and Puerto Rico: April 1, 2000 to July 1, 2009 (NST-EST2009-01)", Population Division, U.S. Census Bureau, Release date: December 2009 (https://www.census.gov/programs-surveys/popest/data/tables.html). Definitions Diagnoses and Procedures, ICD-9-CM, and Clinical Classifications Software (CCS) The principal diagnosis is that condition established after study to be chiefly responsible for the patient’s admission to the hospital. Secondary diagnoses are concomitant conditions that coexist at the time of admission or that develop during the stay. The principal procedure is the procedure that was performed for definitive treatment rather than performed for diagnostic or exploratory purposes (i.e., the procedure that was necessary to take care of a complication). If two procedures appear to meet this definition, the procedure most related to the principal diagnosis was selected as the principal procedure. ICD-9-CM is the International Classification of Diseases, Ninth Revision, Clinical Modification, which assigns numeric codes to diagnoses and procedures. There are about 14,000 ICD-9-CM diagnosis codes and 3,900 ICD-9-CM procedure codes. CCS categorizes ICD-9-CM diagnosis and procedure codes into a manageable number of clinically meaningful categories.8 This "clinical grouper" makes it easier to quickly understand patterns of diagnoses and procedures. CCS categories were used for most analyses that examined other diagnoses and procedures on the discharge record. ICD-9-CM diagnosis codes 305.1-305.13 and V158.2 were employed to assess tobacco use as a secondary diagnosis among patients with COPD. Case definition For this report, stays for acute exacerbation of COPD were identified as having principal ICD-9-CM diagnosis code 491.21. The ICD-9-CM codes defining non-acute exacerbation of COPD were: 491.xx, 492.xx, 493.2, or 496.xx. Types of hospitals included in HCUP HCUP is based on data from community hospitals, defined as short-term, non-Federal, general and other hospitals, excluding hospital units of other institutions (e.g., prisons). HCUP data include OB-GYN, ENT, orthopedic, cancer, pediatric, public, and academic medical hospitals. Excluded are long-term care, rehabilitation, psychiatric, and alcoholism and chemical dependency hospitals. Please note, a discharge of this nature will be included in the NIS if it occurred in a community hospital. Unit of analysis The unit of analysis is the hospital discharge (i.e., the hospital stay), not a person or patient. This means that a person who is admitted to the hospital multiple times in one year will be counted each time as a separate "discharge" from the hospital. Costs and charges Total hospital charges were converted to costs using HCUP Cost-to-Charge Ratios based on hospital accounting reports from the Centers for Medicare and Medicaid Services (CMS).9 Costs will tend to reflect the actual costs of production, while charges represent what the hospital billed for the case. For each hospital, a hospital-wide cost-to-charge ratio is used because detailed charges are not available across all HCUP States. Hospital charges reflect the amount the hospital charged for the entire hospital stay and does not include professional (physician) fees. For the purposes of this Statistical Brief, costs are reported to the nearest hundred. Urban-rural location Urban-rural location is one of six categories as defined by the National Center for Health Statistics:
Median community-level income is the median household income of the patient’s ZIP Code of residence. The cut-offs for the quartile designation are determined using ZIP Code demographic data obtained from Claritas. The income quartile is missing for homeless and foreign patients. Payer Payer is the expected primary payer for the hospital stay. To make coding uniform across all HCUP data sources, payer combines detailed categories into more general groups:
Region Region is one of the four regions defined by the U.S. Census Bureau:
Discharge status indicates the disposition of the patient at discharge from the hospital, and includes the following six categories: routine (to home), transfer to another short-term hospital, other transfers (including skilled nursing facility, intermediate care, and another type of facility such as a nursing home), home healthcare, against medical advice (AMA), or died in the hospital. About HCUP HCUP is a family of powerful healthcare databases, software tools, and products for advancing research. Sponsored by the Agency for Healthcare Research and Quality (AHRQ), HCUP includes the largest all-payer encounter-level collection of longitudinal healthcare data (inpatient, ambulatory surgery, and emergency department) in the United States, beginning in 1988. HCUP is a Federal-State-Industry Partnership that brings together the data collection efforts of many organizations—such as State data organizations, hospital associations, private data organizations, and the Federal government—to create a national information resource. HCUP would not be possible without the contributions of the following data collection Partners from across the United States: Arizona Department of Health Services Arkansas Department of Health California Office of Statewide Health Planning and Development Colorado Hospital Association Connecticut Hospital Association Florida Agency for Health Care Administration Georgia Hospital Association Hawaii Health Information Corporation Illinois Department of Public Health Indiana Hospital Association Iowa Hospital Association Kansas Hospital Association Kentucky Cabinet for Health and Family Services Louisiana Department of Health and Hospitals Maine Health Data Organization Maryland Health Services Cost Review Commission Massachusetts Division of Health Care Finance and Policy Michigan Health & Hospital Association Minnesota Hospital Association Missouri Hospital Industry Data Institute Montana MHA — An Association of Montana Health Care Providers Nebraska Hospital Association Nevada Department of Health and Human Services New Hampshire Department of Health & Human Services New Jersey Department of Health and Senior Services New Mexico Health Policy Commission New York State Department of Health North Carolina Department of Health and Human Services Ohio Hospital Association Oklahoma State Department of Health Oregon Association of Hospitals and Health Systems Pennsylvania Health Care Cost Containment Council Rhode Island Department of Health South Carolina State Budget & Control Board South Dakota Association of Healthcare Organizations Tennessee Hospital Association Texas Department of State Health Services Utah Department of Health Vermont Association of Hospitals and Health Systems Virginia Health Information Washington State Department of Health West Virginia Health Care Authority Wisconsin Department of Health Services Wyoming Hospital Association About the NIS The HCUP Nationwide Inpatient Sample (NIS) is a nationwide database of hospital inpatient stays. The NIS is nationally representative of all community hospitals (i.e., short-term, non-Federal, non-rehabilitation hospitals). The NIS is a sample of hospitals and includes all patients from each hospital, regardless of payer. It is drawn from a sampling frame that contains hospitals comprising about 95 percent of all discharges in the United States. The vast size of the NIS allows the study of topics at both the national and regional levels for specific subgroups of patients. In addition, NIS data are standardized across years to facilitate ease of use. For More Information For more information about HCUP, visit http://www.hcup-us.ahrq.gov. For additional HCUP statistics, visit HCUPnet, our interactive query system, at www.hcup.ahrq.gov. For information on other hospitalizations in the U.S., download HCUP Facts and Figures: Statistics on Hospital-based Care in the United States in 2008, located at http://www.hcup-us.ahrq.gov/reports.jsp. For a detailed description of HCUP, more information on the design of the NIS, and methods to calculate estimates, please refer to the following publications: Steiner, C., Elixhauser, A., Schnaier, J. The Healthcare Cost and Utilization Project: An Overview. Effective Clinical Practice 5(3):143–51, 2002. Introduction to the HCUP Nationwide Inpatient Sample, 2008. Online. May 2010. U.S. Agency for Healthcare Research and Quality. http://hcup-us.ahrq.gov/db/nation/nis/NIS_2008_INTRODUCTION.pdf. Houchens, R., Elixhauser, A. Final Report on Calculating Nationwide Inpatient Sample (NIS) Variances, 2001. HCUP Methods Series Report #2003-2. Online. June 2005 (revised June 6, 2005). U.S. Agency for Healthcare Research and Quality. http://www.hcup-us.ahrq.gov/reports/methods/2003_02.pdf. Suggested Citation Wier, L.M. (Thomson Reuters), Elixhauser, A. (AHRQ), Pfuntner, A. (Thomson Reuters), Au, D.H. (Department of Veterans Affairs). Overview of Hospitalizations among Patients with COPD, 2008. HCUP Statistical Brief #106. February 2011. Agency for Healthcare Research and Quality, Rockville, MD. http://www.hcup-us.ahrq.gov/reports/statbriefs/sb106.pdf. Acknowledgments The authors would like to acknowledge Mika Nagamine (Thomson Reuters) and Minya Sheng (Thomson Reuters) for programming assistance. Funding Dr. Au was supported through the Department of Veterans Affairs, VA Puget Sound Health Care System and Health Services Research and Development Disclaimer The views expressed represent those of the authors and do not necessarily represent the views of the Department of Veterans Affairs. *** AHRQ welcomes questions and comments from readers of this publication who are interested in obtaining more information about access, cost, use, financing, and quality of healthcare in the United States. We also invite you to tell us how you are using this Statistical Brief and other HCUP data and tools, and to share suggestions on how HCUP products might be enhanced to further meet your needs. Please e-mail us at hcup@ahrq.gov or send a letter to the address below:Irene Fraser, Ph.D., Director Center for Delivery, Organization, and Markets Agency for Healthcare Research and Quality 540 Gaither Road Rockville, MD 20850 1 Chabner D-E. The Language of Medicine. 5th Edition. Philadelphia: W.B. Saunders Company, 1996. 409. 2 "What is COPD?" National Heart Lung and Blood Institute: Diseases and Conditions Index. June 2010. http://www.nhlbi.nih.gov/health/dci/Diseases/Copd/Copd_WhatIs.html (accessed February 14, 2011) 3 Porter R.S. (Ed.). "Chronic Obstructive Pulmonary Disease." In The Merck Manual Online. January 2010. http://www.merckmanuals.com/professional/sec05/ch049/ch049a.html# (accessed February 14, 2011). Original source is no longer available on the Web. For related information refer to: Wise RA. Chronic Obstructive Pulmonary Disease (COPD). In Merck Manual Professional Version. Updated June 2020. www.merckmanuals.com/professional/pulmonary-disorders/chronic-obstructive-pulmonary-disease-and-related-disorders/chronic-obstructive-pulmonary-disease-copd. 4 See Definitions for the case definition of COPD and acute exacerbation. 5 Regional smoking prevalence rates calculated from the following sources: Centers for Disease Control and Prevention (CDC). State-specific prevalence of cigarette smoking and smokeless tobacco use among adults—United States, 2009. MMWR Morb Mortal Wkly Rep. 2010 Nov 5;59(43):1400-6. http://www.cdc.gov/mmwr/preview/mmwrhtml/mm5943a2.htm?s_cid=mm5943a2_w. See Table 1. State-specific prevalence of cigarette smoking and smokeless tobacco use among adults—United States, 2009. U.S. Census Bureau, "Cumulative Estimates of Resident Population Change for the United States, Regions, States and Puerto Rico and Region and State Rankings: April 1, 2000 to July 1, 2009 (NST-EST2009-02)"; published 22 December 2009; http://www.census.gov/popest/. See Table 12, Statistical Abstract of the United States, 2010. 6 Data on smoking prevalence by income from: Vander Weg M.W., Cunningham C.L., Howren M.B., Cai X. (2011). Tobacco use and exposure in rural areas: Findings from the Behavioral Risk Factor Surveillance System. Addictive Behaviors; 36(3):231-236. 7 Data on smoking prevalence by residence from: Centers for Disease Control and Prevention (CDC). State-specific prevalence of cigarette smoking and smokeless tobacco use among adults—United States, 2009. MMWR Morb Mortal Wkly Rep. 2010 Nov 5;59(43):1400-6. 8 HCUP CCS. Healthcare Cost and Utilization Project (HCUP). December 2009. U.S. Agency for Healthcare Research and Quality, Rockville, MD. www.hcup-us.ahrq.gov/toolssoftware/ccs/ccs.jsp 9 HCUP Cost-to-Charge Ratio Files (CCR). Healthcare Cost and Utilization Project (HCUP). 2001–2008. U.S. Agency for Healthcare Research and Quality, Rockville, MD. www.hcup-us.ahrq.gov/db/state/costtocharge.jsp. |