STATISTICAL BRIEF #109
|
|
April 2011
Jennifer Lucado, M.P.H., Kathryn Paez, Ph.D., M.B.A., R.N., and Anne Elixhauser, Ph.D.
Introduction The use of pharmaceuticals is an essential element of the American healthcare system, helping to treat acute illnesses and maintain control of chronic conditions in many people. However, medication use can result in morbidity and mortality from many types of adverse outcomes. Adverse outcomes can include side effects of prescribed drugs that are taken as directed, unintentional overdosing by the patient, and medication errors such as incorrect prescribing and dosing. The rates of medication-related adverse outcomes are increasing over time-a trend likely to continue with the aging of the population, the growth in the number of comorbidities, and polypharmacy.1,2,3,4 This Statistical Brief presents data from the Healthcare Cost and Utilization Project (HCUP) on medication- or drug-related adverse outcomes that were seen in hospitals in 2008, updating previously published information on inpatient stays in 2004.5 In addition, we provide information on these occurrences in treat-and-release emergency department (ED) visits. The following types of medication-related adverse outcomes are coded in these hospital and ED data:
Findings In 2008, drug-related adverse outcomes were recorded in nearly 1.9 million inpatient hospital stays Characteristics of hospital stays and ED visits with drug-related adverse outcomes Among inpatient stays with drug-related adverse outcomes, the mean patient age was 62.8 years. However, as shown in table 1, when examined by type of drug-related adverse outcome, the mean age of patients in the hospital with poisoning was significantly lower (50.2 years) than that of patients with adverse effects (63.7 years). |
|
| Table 1. Characteristics of inpatient hospital stays and treat and release ED visits during which drug-related adverse outcomes were noted, 2008 | ||||
| All cases with any drug-related adverse outcomes* | Adverse effects | Poisoning | All stays/visits | |
|---|---|---|---|---|
| Inpatient Stays | ||||
| Number of discharges (% of stays with drug-related adverse outcomes) |
1,874,800 (100.0%) |
1,735,500 (92.6%) |
131,000 (7.0%) |
39,885,100 (4.7%) |
| Age, mean | 62.8 | 63.7 | 50.2 | 48.5 |
| Female, percentage | 57.4% | 57.6% | 54.5% | 58.5% |
| Length of stay, mean days | 6.7 | 6.9 | 3.9 | 4.6 |
| Total hospital costs, mean | $13,600 | $14,000 | $8,000 | $9,200 |
| Died in the hospital, percent | 3.0% | 3.1% | 1.8% | 2.0% |
| Treat-and-release ED visits | ||||
| Number of discharges (% of visits with drug-related adverse outcomes) |
838,000 (100.0%) |
623,600 (74.4%) |
199,800 (23.8%) |
99,610,300 (0.8%) |
| Age, mean | 39.4 | 42.4 | 30.0 | 34.1 |
| Female, percentage | 60.8% | 62.8% | 54.3% | 55.4% |
| * Based on all-listed diagnoses. For 8,400 inpatient cases and 14,600 ED cases with neuropathy or dermatitis drug-related adverse outcome codes, the ICD-9-CM codes do not identify whether the origin of the adverse outcome was poisoning or adverse effects due to drugs administered properly. Source: AHRQ, Center for Delivery, Organization, and Markets, Healthcare Cost and Utilization Project, Nationwide Inpatient Sample and Nationwide Emergency Department Sample, 2008 | ||||
A similar pattern was observed in treat-and-release ED cases, although the mean age of 39.4 years was significantly lower than the mean age for inpatient cases. For both inpatient stays and treat-and-release ED visits, the mean age of patients with drug-related adverse outcomes was significantly older than for all stays or all visits.
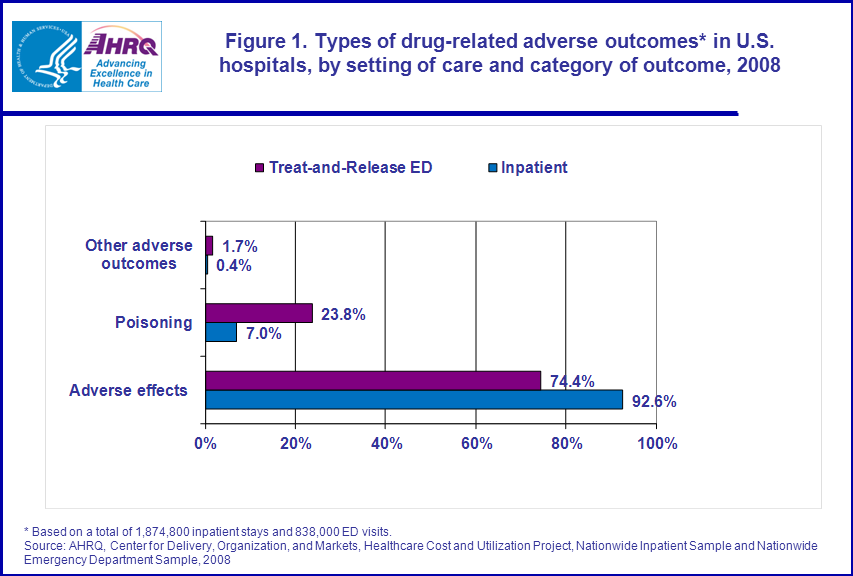
For inpatient stays with a drug-related adverse outcome, 3.0 percent of cases died in the hospital, which is significantly higher than the rate for all stays (2.0 percent), and is an 11 percent increase from 20045 (comparison data not shown). General types of drug-related adverse events In both the inpatient and treat-and-release ED settings, a majority of drug-related adverse outcome cases (92.6 percent and 74.4 percent, respectively) were classified as adverse effects of drugs (figure 1). These are drugs administered properly in therapeutic and prophylactic dosages but cause adverse reactions, including allergic or hypersensitivity reactions. Drug poisoning, which often involves accidental drug overdose, wrong drugs taken or given in error, or drugs taken inadvertently, was more commonly seen in treat-and-release ED drug-related adverse outcome cases (23.8 percent) than in inpatient drug-related adverse outcome cases (7.0 percent). |
|
Figure 1. Types of drug-related adverse outcomes* in U.S. hospitals, by setting of care and category of outcome, 2008. Bar chart; Other adverse outcomes; treat and release ED, 1.7%; Inpatient, 0.4%, Poisoning; treat and release ED, 23.8%; Inpatient, 7.0%, adverse effects; treat and release ED, 74.4%; Inpatient, 92.6%. *Based on a total of 1,874,800 inpatient stays and 838,000 ED visits. Source: AHRQ, Center for Delivery, Organization, and Markets, Healthcare Costs and Utilization Project, Nationwide Inpatient Sample and Nationwide Emergency Department Sample, 2008.
|
General and specific causes of drug-related adverse outcomes
For each hospital stay or ED visit, multiple drug-related adverse outcomes can be reported. There were an average of 1.15 drug-related adverse outcomes per hospital stay with at least one event reported and a comparable average of 1.19 drug-related adverse outcomes per ED visit with any event (footnote of table 2). As shown in table 2, in the inpatient setting, hormones and synthetic substitutes were the most common cause of general drug-related adverse outcomes, responsible for 16.1 percent of all drug-related adverse outcomes (345,300 events). Leading this category were corticosteroids, such as prednisone, the cause of 13.2 percent of all inpatient drug-related adverse outcomes (283,700 events). |
| Table 2. Causes of drug-related adverse outcomes in the U.S., by hospital stay or visit, 2008 | ||||||
| Inpatient stays | Treat-and-release ED visits | |||||
|---|---|---|---|---|---|---|
| Inpatient ranking | ED ranking | General causes of drug-related adverse outcomes and rank overall Specific cause of drug-related adverse outcomes |
Number of events† | Percentage of all events | Number of events† | Percentage of all events |
| 1 | 5 | Hormones and synthetic substitutes | 345,300 | 16.1% | 71,400 | 7.2% |
| Corticosteroids | 283,700 | 13.2% | 13,300 | 1.3% | ||
| Insulin and antidiabetic agents | 44,100 | 2.1% | 40,700 | 4.1% | ||
| Other and unspecified hormones‡ | 8,100 | 0.4% | 13,200 | 1.3% | ||
| 2 | 2 | Analgesics, antipyretics, and antirheumatics | 269,400 | 12.5% | 118,100 | 11.8% |
| Opiates (e.g., codeine, morphine for pain control) | 121,200 | 5.6% | 44,300 | 4.4% | ||
| Aromatic analgesics | 21,000 | 1.0% | 26,700 | 2.7% | ||
| Salicylates | 20,200 | 0.9% | 5,700 | 0.6% | ||
| Antirheumatics | 17,300 | 0.8% | 16,600 | 1.7% | ||
| Other and unspecified analgesics and antipyretics‡ | 76,800 | 3.6% | 12,500 | 1.3% | ||
| 3 | 8 | Agents that effect blood constituents | 250,000 | 11.6% | 36,700 | 3.7% |
| Anticoagulants | 218,800 | 10.2% | 29,200 | 2.9% | ||
| Blood agents not elsewhere classified‡ | 19,700 | 0.9% | 4,700 | 0.5% | ||
| 4 | 7 | Systemic agents | 234,300 | 10.9% | 41,600 | 4.2% |
| Antineoplastic and immunosuppressive drugs | 217,700 | 10.1% | 11,400 | 1.1% | ||
| Antiallergy and antiemetic drugs | 12,100 | 0.6% | 16,800 | 1.7% | ||
| Systemic agents not elsewhere classified‡ | 2,900 | 0.1% | 10,800 | 1.1% | ||
| 5 | 6 | Cardiovascular drugs | 191,300 | 8.9% | 54,000 | 5.4% |
| Other antihypertensive agents (e.g., clonidine, guanethidine, reserpine) | 48,800 | 2.3% | 14,300 | 1.4% | ||
| Cardiotonic glycosides and drugs of similar action (e.g., digitalis, digoxin) | 39,800 | 1.9% | 3,200 | 0.3% | ||
| Cardiac rhythm regulators (e.g., propranolol, quinidine) | 22,400 | 1.0% | 2,000 | 0.2% | ||
| Coronary vasodilators (e.g., nitroglycerin) | 16,400 | 0.8% | 3,800 | 0.4% | ||
| Antilipemics | 12,600 | 0.6% | 8,100 | 0.8% | ||
| Other and unspecified agents primarily effecting the cardiovascular system‡ | 49,300 | 2.3% | 21,700 | 2.2% | ||
| 6 | 1 | Other and unspecified drugs and medicinal substances | 148,100 | 6.9% | 261,600 | 26.2% |
| Other and unspecified drugs or medicinal substances‡ | 144,200 | 6.7% | 251,500 | 25.2% | ||
| 7 | 3 | Antibiotics | 131,300 | 6.1% | 95,100 | 9.5% |
| Penicillins | 19,100 | 0.9% | 32,200 | 3.2% | ||
| Cephalosporin antibiotics | 14,600 | 0.7% | 10,900 | 1.1% | ||
| Other specified antibiotics (excluding antifungal, chloramphenicol, tetracycline, antimycobacterial, and antineoplastic antibiotics)‡ | 88,000 | 4.1% | 45,800 | 4.6% | ||
| 8 | 4 | Psychotropic agents (other than hallucinogens, amphetamines, and caffeine) | 117,000 | 5.4% | 79,300 | 8.0% |
| Benzodiazepine-based tranquilizers | 45,400 | 2.1% | 25,500 | 2.6% | ||
| Antidepressants | 23,700 | 1.1% | 22,400 | 2.2% | ||
| Antipsychotic agents other than phenothiazine- and butryophenone-based tranquilizers | 23,300 | 1.1% | 15,200 | 1.5% | ||
| Other psychotropics agents (specified or unspecified)‡ | 12,700 | 0.6% | 2,100 | 0.2% | ||
| 9 | 17 | Water, mineral, and uric acid metabolism drugs | 111,500 | 5.2% | 10,300 | 1.0% |
| Diuretics other than saluretics (e.g. ethacrynic acid, furosemide) | 69,300 | 3.2% | 3,700 | 0.4% | ||
| Saluretics (e.g., chlorothiazides) | 29,300 | 1.4% | 2,900 | 0.3% | ||
| 10 | 11 | Sedatives and hypnotics | 67,500 | 3.1% | 20,600 | 2.1% |
| Other unspecified sedatives and hypnotics (excluding barbituates, chloral hydrate, paraldehyde, bromide compounds, methaqualone, glutethemide, and mixed sedatives)‡ | 64,900 | 3.0% | 19,300 | 1.9% | ||
| 11 | 10 | Anticonvulsants and anti-Parkinson drugs | 60,800 | 2.8% | 25,600 | 2.6% |
| Hydantoin derivatives | 26,800 | 1.2% | 9,200 | 0.9% | ||
| Other anticonvulsants (specified or unspecified)‡ | 29,200 | 1.4% | 15,100 | 1.5% | ||
| 12 | 9 | Other anti-infectives | 36,900 | 1.7% | 32,400 | 3.3% |
| Sulfonamides | 14,700 | 0.7% | 19,700 | 2.0% | ||
| 13 | 14 | Drugs effecting autonomic nervous system | 32,800 | 1.5% | 13,800 | 1.4% |
| Sympatholytics (antiandrenergics) | 17,100 | 0.8% | 3,000 | 0.3% | ||
| 14 | 15 | Central nervous system depressants and anesthetics | 26,200 | 1.2% | 12,100 | 1.2% |
| 15 | 13 | Agents acting on smooth and skeletal muscles and respiratory system (e.g., muscle relaxants) | 16,900 | 0.8% | 14,500 | 1.4% |
| 16 | 19 | Central nervous system stimulants (e.g., opiate antagonists) | 16,200 | 0.8% | 4,600 | 0.5% |
| CNS stimulants not elsewhere classified‡ | 13,100 | 0.6% | 3,700 | 0.4% | ||
| 17 | 18 | Agents effecting the gastrointestinal system (e.g., cathartics) | 10,100 | 0.5% | 8,200 | 0.8% |
| 18 | 12 | Agents effecting skin, mucous membranes, eye, ENT, and dental | 7,400 | 0.3% | 17,200 | 1.7% |
| 19 | 16 | Vaccines and biological substances | 2,400 | 0.1% | 10,900 | 1.1% |
| Total number of adverse drug events | 2,147,700 | 997,100 | ||||
| *Specific causes of drug-related adverse outcomes are reported separately if an estimate of at least 10,000 drug-related adverse outcome visits/stays is estimated. † More than one drug-related adverse outcome can be recorded during a hospital stay or ED visit. This is based on a total of 2,147,700 drug-related adverse outcome events in 1,874,800 inpatient stays, and 997,100 events in 838,000 ED visits with at least one drug-related adverse outcome recorded. For 72,300 inpatient cases and 69,200 ED cases with neuropathy or dermatitis drug-related adverse outcome codes, the ICD-9-CM codes do not identify a specific cause. ‡ Diagnoses in these categories reflect adverse events of unidentified or unclassified drugs; more specific information is not available in the codes. Source: AHRQ, Center for Delivery, Organization, and Markets, Healthcare Cost and Utilization Project, Nationwide Inpatient Sample and Nationwide Emergency Department Sample, 2008 | ||||||
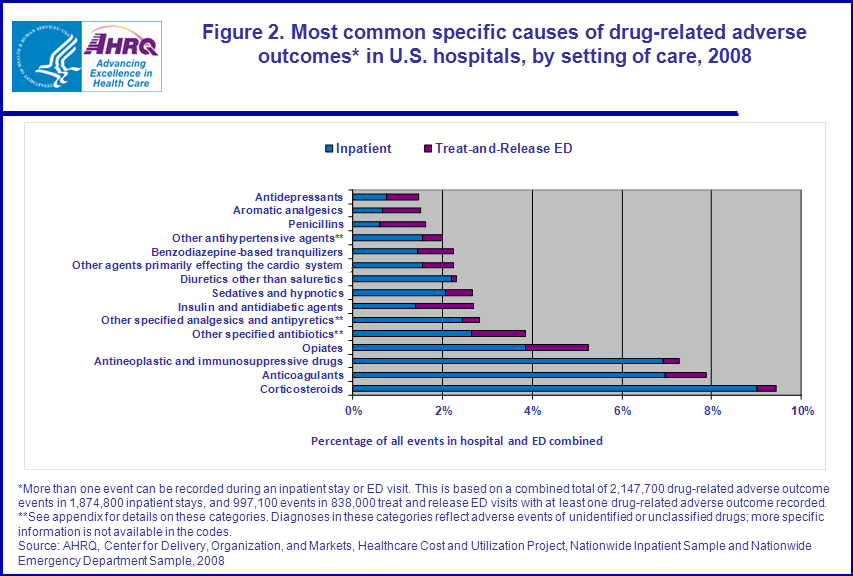
Among treat-and-release ED cases, the general category of "other uncategorized and unspecified drugs" was the leading cause of drug-related adverse outcomes, named in slightly more than a quarter of all events (261,600 or 26.2 percent). No additional details are available on the specific drugs in question. Analgesics, antipyretics, and antirheumatics were the second most common general cause of drug-related adverse outcomes for both inpatient and treat-and-release ED events, accounting for 12.5 percent and 11.8 percent of events, respectively. This category includes drugs for relieving pain and reducing fever, such as acetaminophen (an aromatic analgesic, such as Tylenol), non-steroidal anti-inflammatory drugs (including salicylates, such as aspirin), opiates including methadone, and antirheumatics such as indomethacin. Within this category, opiates were the most common specific cause of drug-related adverse outcomes, responsible for 5.6 percent of all inpatient events and 4.4 percent of treat-and-release ED events. Other top general causes of drug-related adverse outcomes for inpatients included agents affecting blood constituents, such as anticoagulants; systemic agents, such as antineoplastic and immunosuppressive drugs; and cardiovascular drugs, such as antihypertensive agents. This differed from treat-and-release ED cases, where antibiotics; psychotropic agents, including antidepressants and benzodiazepine-based tranquilizers; and hormones and synthetic substitutes were other top general causes of events. Figure 2 combines drug-related adverse outcomes in the inpatient and ED setting for the most common specific drug categories. Corticosteroids were the number one cause of drug-related adverse outcomes (9.4 percent of all events) when events from the inpatient and treat-and-release ED settings were combined. The second, third, and fourth most common causes of drug-related adverse outcomes were anticoagulants (7.9 percent of all events), antineoplastic and immunosuppressive drugs (7.3 percent), and opiates (5.3 percent). |
|
Figure 2. Most common specific causes of drug-related adverse outcomes* in U.S. hospitals, by setting of care, 2008. Bar chart, Inpatient; Treat and Release/ED; percentage of all events in hospital and ED combined; Antidepressants; Inpatient; 0.75%; Treat and Release/ED; 1.46%. Aromatic analgesics; Inpatient; 0.67%; Treat and Release/ED;1.52%. Penicillins; Inpatient; 0.61%; Treat and Release/ED;1.63%. Other antihypertensive agents**; Inpatient; 1.55%; Treat and Release/ED; 2.01%. Benzodiazepine-based tranquilizers; Inpatient; 1.44%; Treat and Release/ED;2.26%. Other agents primarily effecting the cardio system**; Inpatient; 1.57%; Treat and Release/ED;2.26%. Diuretics other than saluretics; Inpatient; 2.20%; Treat and Release/ED;2.32%. Sedatives and hypnotics; Inpatient; 2.06%; Treat and Release/ED;2.68%. Insulin and antidiabetic agents; Inpatient; 1.40%; Treat and Release/ED; 2.70%. Other specified analgesics and antipyretics**; Inpatient; 2.44%; Treat and Release/ED;2.84%. Other specified antibiotics**; , Inpatient; 2.65%; Treat and Release/ED;3.86%. Opiates; Inpatient; 3.85%; Treat and Release/ED; 5.26%.
Antineoplastic and immunosuppressive drugs; , Inpatient; 6.92%; Treat and Release/ED; 7.29%.
Anticoagulants; Inpatient; 6.96%; Treat and Release/ED;7.88%. Corticosteroids; , Inpatient; 9.02%; Treat and Release/ED; 9.44%. *More than one event can be recorded during an inpatient stay or ED visit. This is based on a combined total of 2,147,700 drug-related adverse outcome events in 1,874,800 inpatient stays, and 997,100 events in 838,000 treat and release ED visits with at least one drug-related adverse outcome recorded. **See appendix for details on these categories. Diagnoses in these categories reflect adverse events of unidentified or unclassified drugs; more specific information is not available in the codes. Source: AHRQ, Center for Delivery, Organization, and Markets, Healthcare Costs and Utilization Project, Nationwide Inpatient Sample and Nationwide Emergency Department Sample, 2008. |
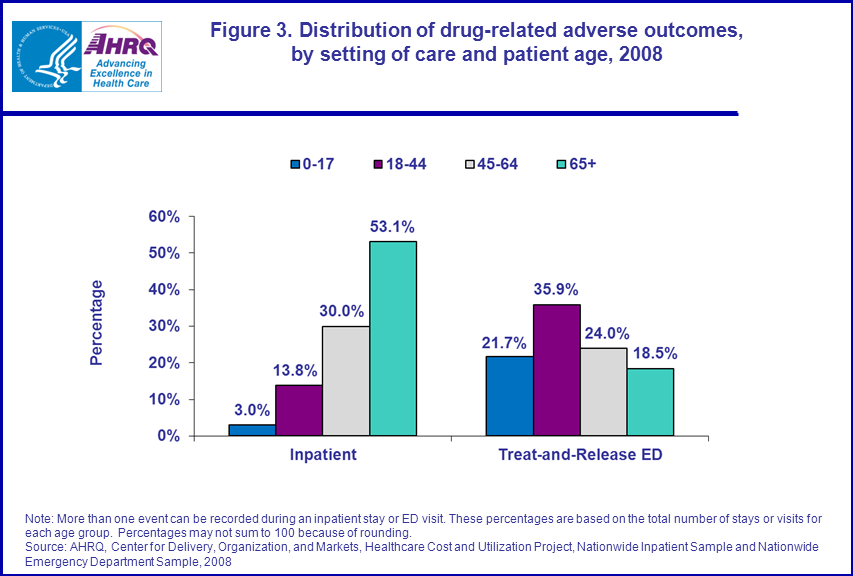
Changes from 2004 to 2008 in inpatient drug-related adverse outcomes For hospital stays, there was a 52 percent increase in inpatient drug-related adverse outcomes compared with five years earlier in 20045 (from 1.2 million stays to 1.9 million stays) and there were a number of changes in the most common types of drug-related adverse outcomes from 2004 to 2008. Hormones and synthetic substitutes went from the second most common cause in 2004 to the most common cause in 2008, mostly due to a significant increase in corticosteroid drug-related adverse outcomes. Corticosteroids were the cause of 11.8 percent of drug-related adverse outcomes during 2004, but rose to 13.2 percent in 2008, a 12 percent increase. From 2004 to 2008, the proportion of drug-related adverse outcomes caused by agents that affect blood constituents also increased. Within this category, anticoagulant drug-related adverse outcomes rose from 8.6 percent in 2004 to 10.2 percent in 2008, an 18 percent increase. Drug-related adverse outcomes due to sedatives and hypnotics also increased from 2.9 percent to 3.1 percent of drug-related adverse outcomes, an 8 percent increase. As shown in figure 3, a majority of inpatient drug-related adverse outcome cases (53.1 percent) were 65 and older, while a very small proportion (3.0 percent) were less than 18 years old. By comparison, among all inpatient cases, adults 65 and older accounted for 35 percent of stays while 15.9 percent of stays occurred in children less than 18 years old. Almost 36 percent of treat-and-release ED visits with drug-related adverse outcomes were made by patients aged 18 to 44 years. Although this age group had the greatest proportion of visits with drug-related adverse outcomes of any age group, they also had the highest percentage of visits overall at 43.9. |
|
Figure 3. Distribution of drug-related adverse outcomes, by setting of care and patient age, 2008. Bar chart; percentages; inpatient, Ages 0 through 17, 3.0%, Ages 18 through 44, 13.8%, Ages 45 through 64, 30.0%, Age 65 plus, 53.1%, Bar chart; percentages; treat and release, ED, Ages 0 through 17, 21.7%, Ages 18 through 44, 35.9%, Ages 45 through 64, 24.0%, Age 65 plus, 18.5%. Note: More than one event can be recorded during an inpatient stay or ED visit. These percentages are based on the total number of stays or visits for each age group. Percentages may not sum to 100 because of rounding. Source: AHRQ, Center for Delivery, Organization, and Markets, Healthcare Cost and Utilization Project, Nationwide Inpatient Sample and Nationwide Emergency Department Sample, 2008.
|
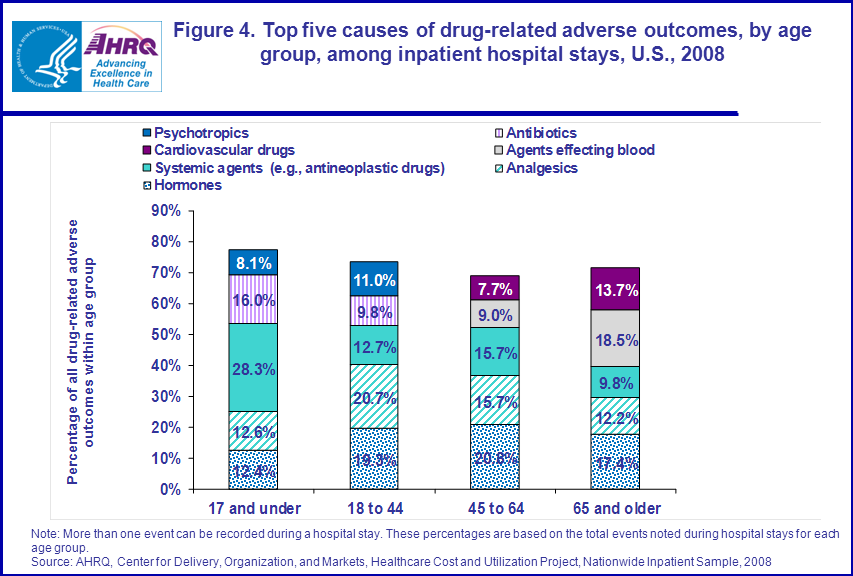
In the inpatient setting, hormones, analgesics, and systemic agents were among the top five most common causes of drug-related adverse outcomes for all age groups (figure 4). These three groups of drugs were responsible for over half of all drug-related adverse outcomes in patients under 65 years and were responsible for nearly 40 percent of drug-related adverse outcomes in patients 65 and older. However, for cases under age 45, antibiotics and psychotropic drugs were also common causes. These five categories of drugs (hormones, analgesics, systemic agents, antibiotics, and psychotropic drugs) were responsible for about three-quarters of all drug-related adverse outcomes among those under age 45. Other drug-related adverse outcomes in patients 45 years and older were more likely to be caused by agents effecting the blood and cardiovascular agents.
|
|
Figure 4. Top 5 causes of drug-related adverse outcomes, by age group, among inpatient hospital stays, U.S., 2008. Stacked column bar chart in percentages; percentage of all drug related adverse outcomes within age group. 17 and under; psychotropics, 8.1%; antibiotics, 16.0%; cardiovascular drugs, 0%; agents effecting blood, 0%; systemic agents 28.3%; analgesics, 12.6%; hormones, 12.4%; 18 to 44; psychotropics, 11.0%; antibiotics, 9.8%; cardiovascular drugs, 0%; agents effecting blood, 0%; systemic agents 12.7%; analgesics, 20.7%; hormones, 19.3%; 45 to 64; psychotropics, 0%; antibiotics, 0%; cardiovascular drugs, 7.7%; agents effecting blood, 9. 0%; systemic agents 15.7%; analgesics, 15.7%; hormones, 20.8%;
65 and older; psychotropics, 0%; antibiotics, 0%; cardiovascular drugs, 13.7%; agents effecting blood, 18.5%; systemic agents 9.8%; analgesics, 12.2%; hormones, 17.4%; Note: More than one event can be recorded during a hospital stay. These percentages are based on the total events noted during hospital stays for each age group. Source: AHRQ, Center for Delivery, Organization, and Markets, Healthcare Cost and Utilization Project, Nationwide Inpatient Sample, 2008.
|
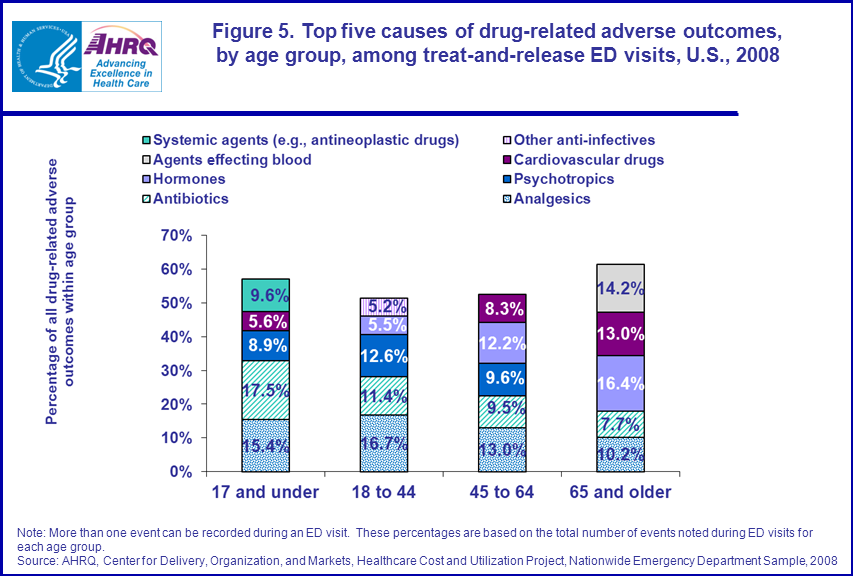
Among treat-and-release ED visits, analgesics and antibiotics were among the most common causes of drug-related adverse outcomes for all age groups (figure 5). Psychotropics were a top five cause of drug-related adverse outcome for all ages younger than 65. Hormones were a top five cause of drug-related adverse outcome for all age groups 18 and older. Cardiovascular drugs were a common cause of drug-related adverse outcomes in children and in those patients 45 and older. The category of "agents effecting the blood" was a top five cause of drug-related adverse outcome in the 65 and older age group, systemic agents (such as antineoplastic and immunosuppressive drugs) were unique to the 17 and under age group, and other anti-infectives were a common source of drug-related adverse outcomes in those 18 to 44 years old.
|
|
Figure 5. Top 5 causes of drug-related adverse outcomes, by age group, among treat-and-release ED visits, U.S., 2008. Stacked bar chart; percentage of all drug related adverse outcomes within age group; 17 and under; systemic agents; 9.6%; other antiinfectives, 0%; agents effecting blood, 0%; cardiovascular drugs, 5.6%; hormones, 0%; psychotropics, 8.9%; antibiotics, 17.5%; analgesics, 15.4%; 18 to 44; systemic agents; 0%; other antiinfectives, 5.2%; agents effecting blood, 0%; cardiovascular drugs, 0%; hormones, 5.5%; psychotropics, 12.6%; antibiotics, 11.4%; analgesics, 16.7%; 45 to 64; systemic agents; 0%; other antiinfectives, 0%; agents effecting blood, 0%; cardiovascular drugs, 8.3%; hormones, 12.2%; psychotropics, 9.6%; antibiotics, 9.5%; analgesics, 13.0%; 65 and older; systemic agents; 0%; other antiinfectives, 0%; agents effecting blood, 14.2%; cardiovascular drugs, 13.0%; hormones, 16.4%; psychotropics, 0%; antibiotics, 7.7%; analgesics, 10.2%; Note: More than one event can be recorded during an ED visit. These percentages are based on the total number of events noted during ED visits for each age group. Source: AHRQ, Center for Delivery, Organization, and Markets, Healthcare Cost and Utilization Project, Nationwide Emergency Department Sample, 2008.
|
Data Source
The estimates in this Statistical Brief are based upon data from the HCUP 2008 Nationwide Inpatient Sample (NIS) and 2008 Nationwide Emergency Department Sample (NEDS). Supplemental sources included data from the HCUP 2008 NIS Cost-to-Charge Ratio file. Definitions Diagnoses and ICD-9-CM The principal diagnosis is that condition established after study to be chiefly responsible for the patient's admission to the hospital or visit to the ED. Secondary diagnoses are concomitant conditions that coexist when the patient arrives at the hospital or that develop during the stay. All-listed diagnoses were used for this analysis. ICD-9-CM is the International Classification of Diseases, Ninth Revision, Clinical Modification, which assigns numeric codes to diagnoses. There are about 13,600 ICD-9-CM diagnosis codes. To define drug-related adverse outcomes for this analysis, we identified cases based on the following ICD-9-CM codes or external cause of injury codes (E codes) in any diagnosis or E code field: 357.6, Neuropathy due to drugs 692.3, Contact dermatitis due to drugs and medicines in contact with skin 693.0, Dermatitis due to drugs or medicines taken internally 960.0–964.9, 965.02–969.5, 969.8–979.9, Poisoning by drugs, medicinal and biological substances (includes overdose of these substances and wrong substances given or taken in error) E850.1–E858.9, Accidental poisoning by drugs, medicinal substances, and biologicals (includes accidental overdose, wrong dose given or taken in error, and drug taken inadvertently) E 930.0–E934.9, E935.1–E949.9, Drugs, medicinal substances, and biologicals causing adverse effects in therapeutic use (includes correct drug properly administered in therapeutic or prophylactic dosage as the cause of any adverse reaction including allergic or hypersensitivity reactions) Detailed coding for each category of drug examined here is provided below. |
| General causes of drug-related adverse outcomes Specific cause of drug-related adverse outcomes |
ICD-9 Diagnosis Codes | |||||
|---|---|---|---|---|---|---|
| Hormones and synthetic substitutes | 962.0, 962.1, 962.2, 962.3, 962.4, 962.5, 962.6, 962.7, 962.8, 962.9, E858.0, E932.0, E932.1, E932.2, E932.3, E932.4, E932.5, E932.6, E932.7, E932.8, E932.9 | |||||
| Corticosteroids | 962.0, E932.0 | |||||
| Insulin and antidiabetic agents | 962.3, E932.3 | |||||
| Other and unspecified hormones‡ | 962.9, E858.0, E932.9 | |||||
| Analgesics, antipyretics, and antirheumatics | 965.02, 965.09, 965.1, 965.4, 965.5, 965.61, 965.69, 965.7, 965.8, 965.9, E850.1, E850.2, E850.3, E850.4, E850.5, E850.6, E850.7, E850.8, E850.9, E935.1, E935.1, E935.2, E935.3, E935.4, E935.5, E935.6, E935.7, E935.8, E935.9 | |||||
| Opiates (e.g., codeine, morphine for pain control) | 965.09, E850.2, E935.2 | |||||
| Aromatic analgesics | 965.4, E850.4, E935.4 | |||||
| Salicylates | 965.1, E850.3, E935.3 | |||||
| Antirheumatics | 965.69, E850.6, E935.6 | |||||
| Other and unspecified analgesics and antipyretics‡ | 965.8, 965.9, E850.8, E850.9, E935.8, E935.9 | |||||
| Agents that affect blood constituents | 964.0, 964.1, 964.2, 964.3, 964.4, 964.5, 964.6, 964.7, 964.8, 964.9, E858.2, E934.0, E934.1, E934.2, E934.3, E934.4, E934.5, E934.6 E934.7 E934.8, E934.9 | |||||
| Anticoagulants | 964.2, E934.2 | |||||
| Blood agents not elsewhere classified‡ | 964.8, 964.9, E858.2, E934.8, E934.9 | |||||
| Systemic agents | 963.0, 963.1, 963.2, 963.3, 963.4, 963.5, 963.8, 963.9, E858.1, E933.0, E933.1, E933.2, E933.3, E933.4, E933.5, E933.8, E933.9 | |||||
| Antineoplastic and immunosuppressive drugs | 963.1, E933.1 | |||||
| Antiallergy and antiemetic drugs | 963.0, E933.0 | |||||
| Systemic agents not elsewhere classified‡ | 963.8, 963.9, E858.1, E933.8, E933.9 | |||||
| Cardiovascular drugs | 972.0, 972.1, 972.2, 972.3, 972.4, 972.5, 972.6, 972.7, 972.8, 972.9, E858.3, E942.0, E942.1, E942.2, E942.3, E942.4, E942.5, E942.6, E942.7, E942.8, E942.9 | |||||
| Other antihypertensive agents (e.g., clonidine, guanethidine, reserpine) | 972.6, E942.6 | |||||
| Cardiotonic glycosides and drugs of similar action (e.g., digitalis, digoxin) | 972.1, E942.1 | |||||
| Cardiac rhythm regulators (e.g., propranolol, quinidine) | 972.0, E942.0 | |||||
| Coronary vasodilators (e.g., nitroglycerin) | 972.4, E942.4 | |||||
| Antilipemics | 972.2, E942.2 | |||||
| Other and unspecified agents primarily affecting the cardiovascular system‡ | 972.9, E858.3, E942.9 | |||||
| Other and unspecified drugs and medicinal substances | 977.0, 977.1, 977.2, 977.3, 977.4, 977.8, 977.9, E858.8, E858.9, E947.0, E947.1, E947.2, E947.3, E947.4, E947.8, E947.9 | |||||
| Other and unspecified drugs or medicinal substances‡ | 977.8, 977.9, E858.8, E858.9, E947.8, E947.9 | |||||
| Antibiotics | 960.0, 960.1, 960.2, 960.3, 960.4, 960.5, 960.6, 960.7, 960.8, 960.9, E856, E930.0, E930.1, E930.2, E930.3, E930.4, E930.5, E930.6, E930.7, E930.8, E930.9 | |||||
| Penicillins | 960.0, E930.0 | |||||
| Cephalosporin antibiotics | 960.5, E930.5 | |||||
| Other specified antibiotics (excluding antifungal, chloramphenicol, tetracycline, antimycobacterial, and antineoplastic antibiotics)‡ | 960.3, 960.8, 960.9, E856, E930.3, E930.8, E930.9 | |||||
| Psychotropic agents (other than hallucinogens, amphetamines, and caffeine) | 969.0, 969.1, 969.2, 969.3, 969.4, 969.5, 969.8, 969.9, E853.0, E853.1, E853.2, E853.8, E853.9, E854.0, E854.8, E939.0, E939.1, E939.2, E939.3, E939.4, E939.5, E939.8, E939.9 | |||||
| Benzodiazepine-based tranquilizers | 969.4, E853.2, E939.4 | |||||
| Antidepressants | 969.0, E854.0, E939.0 | |||||
| Antipsychotic agents other than phenothiazine- and butryophenone-based tranquilizers | 969.3, E939.3 | |||||
| Other psychotropics agents (specified or unspecified)‡ | 969.8, 969.9, E854.8, E939.8, E939.9 | |||||
| Water, mineral, and uric acid metabolism drugs | 974.0, 974.1, 974.2, 974.3, 974.4, 974.5, 974.6, 974.7, E858.5, E944.0, E944.1, E944.2, E944.3, E944.4, E944.5, E944.6, E944.7 | |||||
| Diuretics other than saluretics (e.g. ethacrynic acid, furosemide) | 974.4, E944.4 | |||||
| Saluretics (e.g., chlorothiazides) | 974.3, E944.3 | |||||
| Sedatives and hypnotics | 967.0, 967.1, 967.2, 967.3, 967.4, 967.5, 967.6, 967.8, 967.9, E851, E852.0, E852.2, E852.8, E852.9, E937.0, E937.1, E937.3, E937.4, E937.5, E937.6, E937.8, E937.9 | |||||
| Other unspecified sedatives and hypnotics (excluding barbituates, chloral hydrate, paraldehyde, bromide compounds, methaqualone, glutethemide, and mixed sedatives)‡ | 967.8, 967.9, E852.8, E852.9, E937.8, E937.9 | |||||
| Anticonvulsants and anti-Parkinson drugs | 966.0, 966.1, 966.2, 966.3, 966.4, E855.0, E936.0, E936.1, E936.2, E936.3, E936.4 | |||||
| Hydantoin derivatives | 966.1, E936.1 | |||||
| Other anticonvulsants (specified or unspecified)‡ | 966.3, E855.0, E936.3 | |||||
| Other anti-infectives | 961.0, 961.1, 961.2, 961.3, 961.4, 961.5, 961.6, 961.7, 961.8, 961.9, E857, E931.0, E931.1, E931.2, E931.3, E931.4, E931.5, E931.6, E931.7, E931.8, E931.9 | |||||
| Sulfonamides | 961.0, E931.0 | |||||
| Drugs effecting autonomic nervous system | 971.0, 971.1, 971.2, 971.3, 971.9, E855.3, E855.4, E855.5, E855.6, E855.8, E855.9, E941.0, E941.1, E941.2, E941.3, E941.9 | |||||
| Sympatholytics (antiandrenergics) | 971.1, E855.4, E941.1 | |||||
| Central nervous system depressants and anesthetics | 968.0, 968.1, 968.2, 968.3, 968.4, 968.5, 968.6, 968.7, 968.8, 968.9, E855.1, E855.2, E938.0, E938.1, E938.2, E938.3, E938.4, E938.5, E938.6, E938.7, E938.9 | |||||
| Agents acting on smooth and skeletal muscles and respiratory system (e.g., muscle relaxants) | 975.0, 975.1, 975.2, 975.3, 975.4, 975.5, 975.6, 975.7, E945.0, E945.1, E945.2, E945.3, E945.4, E945.5, E945.6, E945.7 | |||||
| Central nervous system stimulants (e.g., opiate antagonists) | 970.0, 970.1, 970.8, 970.9, E854.3, E940.0, E940.1, E940.8, E940.9 | |||||
| CNS stimulants not elsewhere classified‡ | 970.8, 970.9, E854.3, E940.8, E940.9 | |||||
| Agents effecting the gastrointestinal system (e.g., cathartics) | 973.0, 973.1, 973.2, 973.3, 973.4, 973.5, 973.6, 973.8, E858.4, E943.0, E943.1, E943.2, E943.3, E943.4, E943.5, E943.6, E943.8, E943.9 | |||||
| Agents effecting skin, mucous membranes, eye, ENT, and dental | 976.0, 976.1, 976.2, 976.3, 976.4, 976.5, 976.6, 976.7, 976.8, 976.9, E858.7, E946.0, E946.1, E946.2, E946.3, E946.4, E946.5, E946.6, E946.7, E946.8, E946.9 | |||||
| Vaccines and biological substances | 978.0, 978.1, 978.2, 978.3, 978.4, 978.5, 978.6, 978.8, 978.9, 979.0, 979.1, 979.2, 979.3, 979.4, 979.5, 979.6, 979.7, 979.9, E948.0, E948.1, E948.2, E948.3, E948.4, E948.5, E948.6, E948.8 E948.9, E949.0, E949.1, E949.2, E949.3, E949.4, E949.5 E949.6, E949.7, E949.9 | |||||
The following codes were excluded (38,000 inpatient cases; 38,200 treat-and-release ED cases): |
| 965.00 | Opium poisoning |
| 965.01 | Heroin poisoning |
| 969.6 | Psychodysleptic poisoning |
| 969.7 | Poisoning by psychostimulants (caffeine, cocaine) |
| E850.0 | Poisoning by psychostimulants (caffeine, cocaine) |
| E854.1 | Accidental poisoning by hallucinogens |
| E854.2 | Accidental poisoning by psychostimulants |
| E935.0 | Adverse effects of heroin |
| E939.6 | Adverse effects of hallucinogens |
| E939.7 | Adverse effects of psychostimulants |
We also excluded any case with evidence of self-inflicted poisoning or assault, or poisoning that was undetermined whether accidentally or purposely inflicted (a total of 199,300 inpatient and 145,600 treat-and-release cases): |
| E950.0- E950.9 |
Suicide and self-inflicted poisoning (174,400 inpatient; 83,300 treat-and-release) |
| E962.0- E962.9 |
Assault by poisoning (300 inpatient; 1,300 treat-and-release) |
| E980.0- E980.9 |
Poisoning undetermined whether accidentally or purposely inflicted (41,600 inpatient; 61,000 treat-and-release) |
|
Types of hospitals included in HCUP
HCUP is based on data from community hospitals, defined as short-term, non-Federal, general and other hospitals, excluding hospital units of other institutions (e.g., prisons). HCUP data include OB-GYN, ENT, orthopedic, cancer, pediatric, public, and academic medical hospitals. Excluded are long-term care, rehabilitation, psychiatric, and alcoholism and chemical dependency hospitals. Please note, a discharge of this nature will be included in the NIS if it occurred in a community hospital. Unit of analysis The unit of analysis is the hospital discharge (i.e., the hospital stay), not a person or patient. This means that a person who is admitted to the hospital multiple times in one year will be counted each time as a separate "discharge" from the hospital. Another unit of analysis employed in this report is the "event" -a single discharge can experience multiple drug-related adverse outcomes and for some analyses, events are reported. Costs and charges Total hospital charges were converted to costs using HCUP Cost-to-Charge Ratios based on hospital accounting reports from the Centers for Medicare and Medicaid Services (CMS).8 Costs will tend to reflect the actual costs of production, while charges represent what the hospital billed for the case. For each hospital, a hospital-wide cost-to-charge ratio is used because detailed charges are not available across all HCUP States. Hospital charges reflect the amount the hospital charged for the entire hospital stay and does not include professional (physician) fees. For the purposes of this Statistical Brief, costs are reported to the nearest hundreds. About HCUP HCUP is a family of powerful healthcare databases, software tools, and products for advancing research. Sponsored by the Agency for Healthcare Research and Quality (AHRQ), HCUP includes the largest all-payer encounter-level collection of longitudinal healthcare data (inpatient, ambulatory surgery, and emergency department) in the United States, beginning in 1988. HCUP is a Federal-State-Industry Partnership that brings together the data collection efforts of many organizations—such as State data organizations, hospital associations, private data organizations, and the Federal government—to create a national information resource. HCUP would not be possible without the contributions of the following data collection Partners from across the United States: Arizona Department of Health Services Arkansas Department of Health California Office of Statewide Health Planning and Development Colorado Hospital Association Connecticut Hospital Association Florida Agency for Health Care Administration Georgia Hospital Association Hawaii Health Information Corporation Illinois Department of Public Health Indiana Hospital Association Iowa Hospital Association Kansas Hospital Association Kentucky Cabinet for Health and Family Services Louisiana Department of Health and Hospitals Maine Health Data Organization Maryland Health Services Cost Review Commission Massachusetts Division of Health Care Finance and Policy Michigan Health & Hospital Association Minnesota Hospital Association Missouri Hospital Industry Data Institute Montana MHA — An Association of Montana Health Care Providers Nebraska Hospital Association Nevada Department of Health and Human Services New Hampshire Department of Health & Human Services New Jersey Department of Health and Senior Services New Mexico Health Policy Commission New York State Department of Health North Carolina Department of Health and Human Services Ohio Hospital Association Oklahoma State Department of Health Oregon Association of Hospitals and Health Systems Pennsylvania Health Care Cost Containment Council Rhode Island Department of Health South Carolina State Budget & Control Board South Dakota Association of Healthcare Organizations Tennessee Hospital Association Texas Department of State Health Services Utah Department of Health Vermont Association of Hospitals and Health Systems Virginia Health Information Washington State Department of Health West Virginia Health Care Authority Wisconsin Department of Health Services Wyoming Hospital Association About the NIS The HCUP Nationwide Inpatient Sample (NIS) is a nationwide database of hospital inpatient stays. The NIS is nationally representative of all community hospitals (i.e., short-term, non-Federal, non-rehabilitation hospitals). The NIS is a sample of hospitals and includes all patients from each hospital, regardless of payer. It is drawn from a sampling frame that contains hospitals comprising about 95 percent of all discharges in the United States. The vast size of the NIS allows the study of topics at both the national and regional levels for specific subgroups of patients. In addition, NIS data are standardized across years to facilitate ease of use. About the NEDS The HCUP Nationwide Emergency Department Database (NEDS) is a unique and powerful database that yields national estimates of emergency department (ED) visits. The NEDS was constructed using records from both the HCUP State Emergency Department Databases (SEDD) and the State Inpatient Databases (SID). The SEDD capture information on ED visits that do not result in an admission (i.e., treat-and-release visits and transfers to another hospital); the SID contain information on patients initially seen in the emergency room and then admitted to the same hospital. The NEDS was created to enable analyses of ED utilization patterns and support public health professionals, administrators, policymakers, and clinicians in their decision-making regarding this critical source of care. The NEDS is produced annually beginning in 2006. For More Information For more information about HCUP, visit http://www.hcup-us.ahrq.gov. For additional HCUP statistics, visit HCUPnet, our interactive query system, at www.hcup.ahrq.gov. For information on other hospitalizations in the U.S., download HCUP Facts and Figures: Statistics on Hospital-based Care in the United States in 2008, located at http://www.hcup-us.ahrq.gov/reports.jsp. For a detailed description of HCUP, more information on the design of the NIS, and methods to calculate estimates, please refer to the following publications: Steiner, C., Elixhauser, A., Schnaier, J. The Healthcare Cost and Utilization Project: An Overview. Effective Clinical Practice 5(3):143–51, 2002. Introduction to the HCUP Nationwide Inpatient Sample, 2008. Online. May 2010. U.S. Agency for Healthcare Research and Quality. http://hcup-us.ahrq.gov/db/nation/nis/NIS_2008_INTRODUCTION.pdf. Introduction to the HCUP Nationwide Emergency Department Sample, 2008. Online. October 2010. U.S. Agency for Healthcare Research and Quality. http://hcup-us.ahrq.gov/db/nation/neds/NEDS2008Introductionv3.pdf. Houchens, R., Elixhauser, A. Final Report on Calculating Nationwide Inpatient Sample (NIS) Variances, 2001. HCUP Methods Series Report #2003-2. Online. June 2005 (revised June 6, 2005). U.S. Agency for Healthcare Research and Quality. http://www.hcup-us.ahrq.gov/reports/methods/2003_02.pdf. Houchens R.L., Elixhauser A. Using the HCUP Nationwide Inpatient Sample to Estimate Trends. (Updated for 1988-2004). HCUP Methods Series Report #2006-05 Online. August 18, 2006. U.S. Agency for Healthcare Research and Quality. http://www.hcup-us.ahrq.gov/reports/methods/2006_05_NISTrendsReport_1988-2004.pdf. Suggested Citation Lucado, J. (Social & Scientific Systems, Inc.), Paez, K. (Social & Scientific Systems, Inc.), and Elixhauser A. (AHRQ). Medication-Related Adverse Outcomes in U.S. Hospitals and Emergency Departments, 2008. HCUP Statistical Brief #109. April 2011. Agency for Healthcare Research and Quality, Rockville, MD. http://www.hcup-us.ahrq.gov/reports/statbriefs/sb109.pdf. Acknowledgments The authors would like to acknowledge Andrew Mosso (Social & Scientific Systems, Inc.) for his assistance with the SAS programming for this Brief. *** AHRQ welcomes questions and comments from readers of this publication who are interested in obtaining more information about access, cost, use, financing, and quality of healthcare in the United States. We also invite you to tell us how you are using this Statistical Brief and other HCUP data and tools, and to share suggestions on how HCUP products might be enhanced to further meet your needs. Please e-mail us at hcup@ahrq.gov or send a letter to the address below:Irene Fraser, Ph.D., Director Center for Delivery, Organization, and Markets Agency for Healthcare Research and Quality 540 Gaither Road Rockville, MD 20850 1 Budnitz DS, Pollock DA, Weidenbach KN, Mendelsohn AB, Schroeder TJ, Annest JL. "National Surveillance of Emergency Department Visits for Outpatient Adverse Drug Events." JAMA. 2006; 296(15):1858-1866. 2 Hug BL, Witkowski DJ, Sox CM, Keohane CA, Seger DL, Yoon C, Matheny ME, Bates DW. "Adverse Drug Event Rates in Six Community Hospitals and the Potential Impact of Computerized Physician Order Entry for Prevention." Journal of General Internal Medicine. 2010; 25(1): 31-38. 3 Bourgeois FT, Shannon MW, Valim C, Mandl KD. "Adverse Drug Events in the Outpatient Setting: An 11-year Analysis." Pharmacoepidemiology and Drug Safety. 2010; 19(9): 901-910. 4 Sikdar KC, Alaghehbandan R, MacDonald D, Barrett B, Collins KD, Donnan J, Gadag V. "Adverse Drug Events in Adult Patients Leading to Emergency Department Visits." The Annals of Pharmacotherapy. 2010; 44(4): 641-649. 5 Elixhauser A, and Owens P (AHRQ). Adverse Drug Events in U.S. Hospitals, 2004. HCUP Statistical Brief #29. April 2007. Agency for Healthcare Research and Quality, Rockville, MD. http://www.hcup-us.ahrq.gov/reports/statbriefs/sb29.pdf. 6 Specific ICD-9-CM codes used in this study are listed in the Definitions section of this report. The full listing of ICD-9-CM codes with inclusions and descriptions can be found at http://www.cdc.gov/nchs/icd/icd9cm.htm. 7 Nebeker JR, Barach P, Samore MH. Clarifying adverse drug events: A clinician's guide to terminology, documentation, and reporting. The Annals of Internal Medicine. 2004;140:795-801. 8 HCUP Cost-to-Charge Ratio Files (CCR). Healthcare Cost and Utilization Project (HCUP). 2001–2008. U.S. Agency for Healthcare Research and Quality, Rockville, MD. www.hcup-us.ahrq.gov/db/state/costtocharge.jsp. |