STATISTICAL BRIEF #112
|
|
May 2011
Pamela L. Owens, Ph.D., Ryan Mutter, Ph.D.
Introduction Each year more than 2.5 million eye injuries occur and 50,000 people permanently lose part or all of their vision.1 Nearly half (44.1 percent) of the injuries occur at home,1 although nearly 800,000 work-related eye injuries occur each year2,3 and 14.7 percent of eye injuries among children ages 5 to 14 are due to sports injuries.1 Yet, more than 90 percent of all eye injuries are preventable with the use of protective eyewear.1,2,3 This Statistical Brief compiles information from the Healthcare Cost and Utilization Project (HCUP) on emergency department (ED) visits related to eye injuries in 2008. Characteristics of ED visits for eye injuries are compared to all other types of injury-related visits. Age, patient location, most common specific injuries and causes of injury are examined by types of ED visits. All differences between estimates noted in the text are statistically significant at the 0.05 level or better. Findings Overall population In 2008, there were 636,619 ED visits related to eye injuries (table 1). This represents a rate of 209 ED visits per 100,000 population. On average, every day there were 1,744 ED visits related to eye injuries. About 3.1 percent of patients seen in the ED for eye injuries were admitted to the hospital—compared to 8.1 percent of ED visits for all other types of injuries. The majority of treat and release ED visits related to eye injuries had a primary eye injury diagnosis (82.5 percent). In contrast, the majority of eye injury-related ED visits resulting in admission had a secondary eye injury diagnosis (72.4 percent)—meaning that the principal reason for admission was something other than an eye injury (table 1). |
|
| Table 1: Characteristics of emergency department visits related to eye injuries (all-listed), 2008 | ||||
| ED visits related to eye injuries* | Treat and release ED visits related to eye injuries* | ED visits resulting in admission related to eye injuries* | ED visits for all other injuries | |
|---|---|---|---|---|
| Number of visits | 636,619 | 616,766 | 19,853 | 29,482,454 |
| ED visits per day | 1,744 | 1,690 | 54 | 80,774 |
| Rate per 100,000 population | 209 | 203 | 7 | 9,696 |
| Males, rate per 100,000 population | 262 | 254 | 8 | 10,400 |
| Females, rate per 100,000 population | 158 | 153 | 5 | 9,007 |
| Utilization characteristics | ||||
| Percentage treated and released | 96.9% | |||
| Percentage admitted to the hospital | 3.1% | 8.1% | ||
| Percentage of visits primarily/principally for eye injuries | 80.8% | 82.5% | 27.6% | n/a |
| Percentage of visits with a secondary diagnosis of eye injuries only | 19.2% | 17.5% | 72.4% | n/a |
| Patient characteristics | ||||
| Mean age, years | 31.5 | 30.8 | 51.2 | 35.4 |
| Percentage by age group: | ||||
| 0 to 17 years | 28.3% | 28.8% | 12.7% | 25.8% |
| 18 to 44 years | 45.3% | 45.9% | 29.1% | 41.5% |
| 45 to 64 years | 18.7% | 18.7% | 20.7% | 19.2% |
| 65 years and older | 7.6% | 6.7% | 37.6% | 13.5% |
| Percentage of male patients | 61.7% | 61.8% | 59.1% | 52.9% |
| Patient residence, rate per 100,000 population1 | ||||
| Urban areas (large central, large fringe, and small and medium metropolitan), rate per 100,000 population | 120 | 116 | 5 | 5,317 |
| Rural areas (micropolitan and noncore), rate per 100,000 population | 646 | 630 | 16 | 31,229 |
| 1Missing patient's residence on 250,418 (<1%) injury records and income information on 751,631 (2.5%) injury records. *Based on all-listed diagnoses. Source: Agency for Healthcare Research and Quality, Healthcare Cost and Utilization Project, Nationwide Emergency Department Sample, 2008. Denominator data for rates were based on Annual Estimates of Resident Population for the United States, Regions, States and Puerto Rico: April 1, 2000 to July 1, 2009 (NST_EST2009-01, NC-EST2009-02). U.S. Census Bureau, Population Division. | ||||
Patient and utilization characteristics for ED visits related to eye injuries
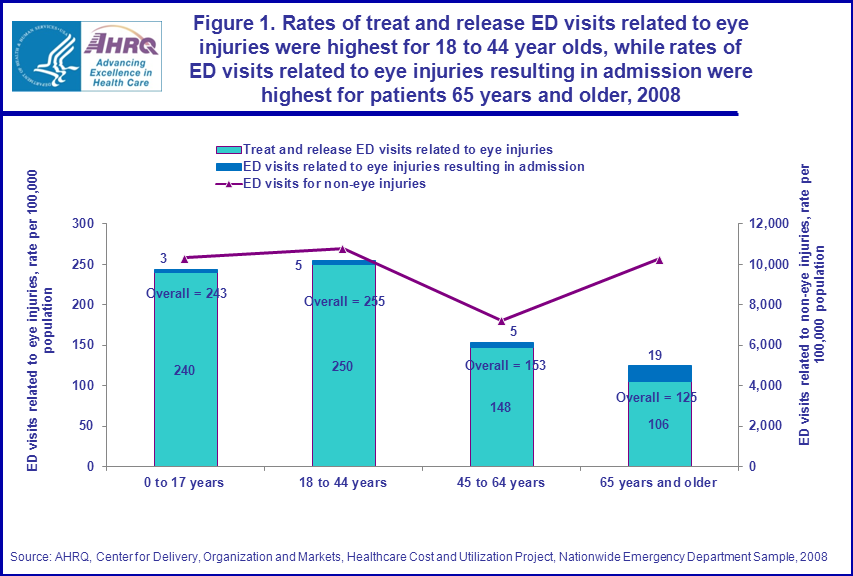
As shown in table 1, males were 1.7 times more likely than females to be seen in the ED for eye injuries (262 versus 158 visits per 100,000 population, respectively), but males were only 1.2 times more likely than females to be seen in the ED for all other types of injuries (10,400 versus 9,007 per 100,000 population, respectively). ED visits related to eye injuries by age The average age of patients seen in the ED for eye injuries was 31.5 years, compared with 35.4 years for ED visits for all other types of injuries. The average age of patients with eye injuries treated and released from the ED was 20 years younger than the average age of patients with eye injuries seen in the ED and admitted to the hospital (30.8 versus 51.2 years, respectively). Table 1 shows that 73.6 percent of ED visits related to eye injuries were for patients younger than 45 years (28.3 percent were for patients younger than 18 years and 45.3 percent were for patients 18 to 44 years old). Only 7.6 percent of patients with ED visits for eye injuries were 65 years and older—disproportionally fewer visits than ED visits for other types of injuries for this age group (13.5 percent). Figure 1 shows that the highest rates of ED visits related to eye injuries were for 18 to 44 year olds (255 visits per 100,000 population), followed by children 0 to 17 years old (243 per 100,000 population). Those 65 years and older had the lowest rate of ED visits related to eye injuries (125 visits per 100,000 population)—over 2 times lower than the rate of 18 to 44 year olds. The highest rates of eye injury-related ED visits resulting in hospital admission were for adults 65 years and older (19 per 100,000 population), while the lowest rates of such visits were for children 0 to 17 years (3 per 100,000 population). Age-specific rates of eye injury ED visits mirrored the age-specific rates of ED visits for other types of injuries, except among adults 65 years and older—eye injuries were less common in the older age group. |
|
Figure 1. Rates of treat and release ED visits related to eye injuries were highest for 18 to 44 year olds, while rates of ED visits related to eye injuries resulting in admission were highest for patients 65 years and older, 2008. Stacked column bar chart and trend line;
ED visits related to eye injuries, rate per 100,000 population, 0 to 17 years, treat and release E D visits related to eye injuries, 240; ED visits related to eye injuries resulting in admission, 3; trend line, E D visits for non-eye injuries, 10,305; ED visits related to eye injuries, rate per 100,000 population, 18 to 44 years, treat and release E D visits related to eye injuries, 250; ED visits related to eye injuries resulting in admission, 5; trend line, E D visits for non-eye injuries, 10,798; ED visits related to eye injuries, rate per 100,000 population, 45 to 64 years, treat and release E D visits related to eye injuries, 148; ED visits related to eye injuries resulting in admission, 5; trend line, E D visits for non-eye injuries, 7,329; ED visits related to eye injuries, rate per 100,000 population, 65 years and older, treat and release E D visits related to eye injuries, 106; ED visits related to eye injuries resulting in admission, 19; trend line, E D visits for non-eye injuries, 10,257;
Source: AHRQ, Center for Delivery, Organization and Markets, Healthcare Cost and Utilization Project, Nationwide Emergency Department Sample, 2008.
|
ED visits related to eye injuries by region and patient location
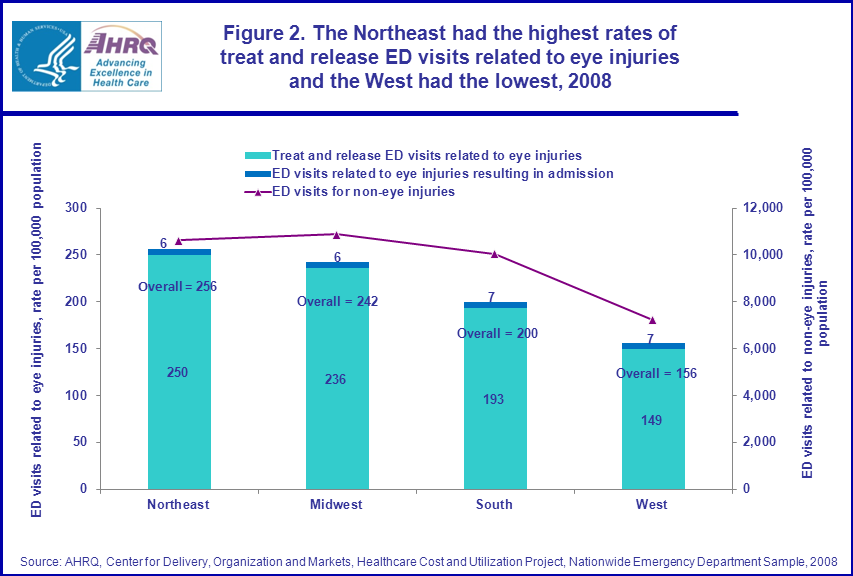
Figure 2 shows that the rate of ED visits related to eye injuries was highest in the Northeast (256 per 100,000 population) followed by the Midwest (242 per 100,000 population) and lowest in the West (156 per 100,000 population). Eye-injury related ED visits resulting in admission were comparable across all regions of the country (6.2 to 6.8 per 100,000 population). Regional variation for eye injury ED visits mirrored the regional rates of ED visits for other types of injury for all regions. |
|
Figure 2. The Northeast had the highest rates of treat and release ED visits related to eye injuries and the West had the lowest, 2008. Stacked column bar chart and trend line; ED visits related to eye injuries, rate per 100,000 population, Northeast, treat and release E D visits related to eye injuries, 250; ED visits related to eye injuries resulting in admission, 6; trend line, E D visits for non-eye injuries, 10,624; ED visits related to eye injuries, rate per 100,000 population, Midwest, treat and release E D visits related to eye injuries, 236; ED visits related to eye injuries resulting in admission, 6; trend line, E D visits for non-eye injuries, 10,891; ED visits related to eye injuries, rate per 100,000 population, South, treat and release E D visits related to eye injuries, 193; ED visits related to eye injuries resulting in admission, 7; trend line, E D visits for non-eye injuries, 10,062; ED visits related to eye injuries, rate per 100,000 population, West, treat and release E D visits related to eye injuries, 149; ED visits related to eye injuries resulting in admission, 7; trend line, E D visits for non-eye injuries, 7,225; Source: AHRQ, Center for Delivery, Organization and Markets, Healthcare Cost and Utilization Project, Nationwide Emergency Department Sample, 2008.
|
Table 1 shows ED visits related to eye injuries by patient residence. For patients who lived in rural areas, the rate of ED visits related to eye injuries was 646 per 100,000 population, 5.4 times higher than in urban areas (large central, large fringe, and medium and small metropolitan designations) where the rate was 120 per 100,000 population. This is consistent with other types of injury where ED visit rates for rural patients were nearly 6 times higher than for urban patients (31,229 versus 5,317 per 100,000 population).
Specific eye injury diagnosis, by visit The most common specific eye injury seen in the ED was a superficial injury to the cornea, accounting for nearly half of all eye injuries (48.7 percent), followed by laceration of the eyelid (9.3 percent) and bruise of the eye (7.3 percent). This pattern was also reflected in treat and release ED visits related to eye injuries. In contrast, the most common specific eye injuries resulting in admission from the ED included wounds to the ocular glands (16.9 percent), bruises to the orbital tissues (15.2 percent) and bruises of the eyelids (11.2 percent). |
| Table 2: Top 10 eye injuries that result in an ED visit, by visit, 2008 | |||||||||
| All-listed diagnoses (ICD-9-CM code) | All ED visits | Treat and release ED visits | ED visits resulting in admission | ||||||
|---|---|---|---|---|---|---|---|---|---|
| Rank | Number | Percentage | Rank | Number | Percentage | Rank | Number | Percentage | |
| Superficial injury of cornea (918.1) | 1 | 310,011 | 48.7% | 1 | 309,178 | 50.1% | 10 | 833 | 4.2% |
| Laceration of skin of eyelid and around eye area (870.0) | 2 | 58,959 | 9.3% | 2 | 56,999 | 9.2% | 4 | 1,961 | 9.9% |
| Unspecified bruise of eye (921.9) | 3 | 46,539 | 7.3% | 3 | 45,303 | 7.3% | 8 | 1,235 | 6.2% |
| Bruise of orbital tissues (921.2) | 4 | 42,576 | 6.7% | 4 | 39,560 | 6.4% | 2 | 3,016 | 15.2% |
| Other specified open wound of ocular adnexa (tear glands) (870.8) | 5 | 41,926 | 6.6% | 5 | 38,563 | 6.3% | 1 | 3,363 | 16.9% |
| Bruise of eyelids and around eye areas (921.1) | 6 | 25,061 | 3.9% | 7 | 22,832 | 3.7% | 3 | 2,229 | 11.2% |
| Superficial injury of eyelids and around eye area (918.0) | 7 | 23,748 | 3.7% | 6 | 23,286 | 3.8% | |||
| Superficial injury of conjunctiva (918.2) | 8 | 17,876 | 2.8% | 8 | 17,833 | 2.9% | |||
| Other superficial injuries to eye (918.9) | 9 | 17,834 | 2.8% | 9 | 17,702 | 2.9% | |||
| Bruise of eyeball (921.3) | 10 | 17,766 | 2.8% | 10 | 16,488 | 2.7% | 7 | 1,279 | 6.4% |
| Black eye, not other specified (921.0) | 5 | 1,682 | 8.5% | ||||||
| Ocular laceration with exposure of tissue within the eyeball (871.1) | 6 | 1,478 | 7.4% | ||||||
| Ocular laceration without exposure of tissue within the eyeball (871.0) | 9 | 947 | 4.8% | ||||||
| Source: Agency for Healthcare Research and Quality, Center for Delivery, Organization, and Markets, Healthcare Cost and Utilization Project, Nationwide Emergency Department Sample, 2008 | |||||||||
Causes of ED visits for eye injuries, by visit
Across all ED visits related to eye injuries, the top five causes of eye injuries were being struck by an object such as being hit during a fight or being involved in sports injury (31.1 percent), falls into an object (10.0 percent), fire or burns such as from caustic or corrosive substances (4.3 percent), motor vehicle traffic accident (3.3 percent), and environmental injuries such as a bite from an insect or animal (3.2 percent). Some variation was seen in the distribution of the causes of injury for eye-injury related ED visits resulting in admission. Falls were the most common cause of injury for such visits (36.1 percent), followed by motor vehicle traffic accident (19.1 percent), and being struck by an object (12.0 percent). |
| Table 3: Top 5 common causes of eye injuries that result in an ED visit, by visit, 2008 | |||||||||
| General cause of injury/Specific cause of injury (E-code)1* | All ED visits | Treat and release ED visits | ED visits resulting in admission | ||||||
|---|---|---|---|---|---|---|---|---|---|
| Rank | Number | Percentage | Rank | Number | Percentage | Rank | Number | Percentage | |
| Struck by/against | 1 | 198,013 | 31.1% | 1 | 195,630 | 31.7% | 3 | 2,383 | 12.0% |
| Other striking against by object accidentally with or without subsequent fall (E917.9) | 120,413 | 18.9% | 119,824 | 19.4% | 589 | 3.0% | |||
| Unarmed fight or brawl (E960.0) | 28,057 | 4.4% | 27,274 | 4.4% | 783 | 3.9% | |||
| Struck by/against an object accidentally in sports without subsequent fall (E917.0) | 22,266 | 3.5% | 22,099 | 3.6% | 168 | 0.8% | |||
| Struck by/against other object accidentally without subsequent fall (E917.4) | 7,179 | 1.1% | 7,081 | 1.1% | 98 | 0.5% | |||
| Striking by thrown object (E968.2) | 5,356 | 0.8% | 4,844 | 0.8% | 512 | 2.6% | |||
| Struck accidentally by falling object (E916) | 5,380 | 0.8% | 5,267 | 0.9% | 113 | 0.6% | |||
| Falls | 2 | 63,873 | 10.0% | 2 | 56,709 | 9.2% | 1 | 7,164 | 36.1% |
| Fall from other slipping, tripping, or stumbling (E885.9) | 18,554 | 2.9% | 16,546 | 2.7% | 2,008 | 10.1% | |||
| Unspecified fall (E888.9) | 12,634 | 2.0% | 10,135 | 1.6% | 2,499 | 12.6% | |||
| Fall resulting in striking against an object (E888.1) | 12,589 | 2.0% | 12,042 | 2.0% | 547 | 2.8% | |||
| Fire/burn | 3 | 27,490 | 4.3% | 3 | 27,216 | 4.4% | 5 | 274 | 1.4% |
| Caustic and corrosive substances (E924.1) | 16,229 | 2.5% | 16,161 | 2.6% | 68 | 0.3% | |||
| Motor vehicle traffic | 4 | 20,863 | 3.3% | 5 | 17,071 | 2.8% | 2 | 3,793 | 19.1% |
| Other motor vehicle accident involving collision with parked vehicle (E812.0) | 4,969 | 0.8% | 4,293 | 0.7% | 675 | 3.4% | |||
| Environment | 5 | 20,681 | 3.2% | 4 | 20,142 | 3.3% | 4 | 539 | 2.7% |
| Bite of nonvenomous arthropod (E906.4) | 7,593 | 1.2% | 7,481 | 1.2% | 115 | 0.6% | |||
| Other specified injury caused by animal (E906.8) | 6.224 | 1.0% | 6,158 | 1.0% | 66 | 0.3% | |||
| 1Missing cause of injury for 61,952 ED records. *Specific causes of eye injuries are reported separately if an estimate of at least 5,000 visits is obtained; E-code = external cause of injury code. Source: Agency for Healthcare Research and Quality, Center for Delivery, Organization, and Markets, Healthcare Cost and Utilization Project, Nationwide Emergency Department Sample, 2008 | |||||||||
Data Source
The estimates in this Statistical Brief are based upon data from the HCUP 2008 Nationwide Inpatient Sample (NIS) and the 2008 Nationwide Emergency Department Sample (NEDS). Supplemental source included data on regional population estimates from "Table 1: Annual Estimates of the Resident Population for the United States, Regions, States, and Puerto Rico: April 1, 2000 to July 1, 2009 (NST-EST2009-01)", Population Division, U.S. Census Bureau, Release date: December 2009 (https://www.census.gov/programs-surveys/popest/data/tables.html) and information in the methods report by Barrett, M., Hunter, K., Coffey, R., Levit, K. Population Denominator Data for Use with the HCUP Databases (Updated with 2009 Population Data). HCUP Methods Series Report # 2010-02. Online April 12, 2010. U.S. Agency for Healthcare Research and Quality. Available: http://www.hcup-us.ahrq.gov/reports/methods/methods.jsp. Definitions Diagnoses, ICD-9-CM, and Clinical Classifications Software (CCS) The principal diagnosis is that condition established after study to be chiefly responsible for the patient’s admission to the hospital. Secondary diagnoses are concomitant conditions that coexist at the time of admission or that develop during the stay. All-listed diagnoses include the principal diagnosis plus these additional secondary conditions. ICD-9-CM is the International Classification of Diseases, Ninth Revision, Clinical Modification, which assigns numeric codes to diagnoses. There are about 13,600 ICD-9-CM diagnosis codes. CCS categorizes ICD-9-CM diagnoses into a manageable number of clinically meaningful categories.4 This "clinical grouper" makes it easier to quickly understand patterns of diagnoses and procedures. Case definition Using the Barell Matrix for the classification of injuries, the following all-listed ICD-9-CM codes were used to identify injuries in general and eye injuries specifically: All injuries: 800-909.2, 909.4, 909.9, 910-994.9, 996.5-995.9, 995.80-995.85 Eye injuries: 870.0-871.9, 918.0-918.9, 921.0-921.9, 940.0-940.9, 941.02, 941.12, 941.22, 941.32, 941.42, 941.52, 950.0, 950.9 Types of hospitals included in HCUP HCUP is based on data from community hospitals, defined as short-term, non-Federal, general and other hospitals, excluding hospital units of other institutions (e.g., prisons). HCUP data include OB-GYN, ENT, orthopedic, cancer, pediatric, public, and academic medical hospitals. They exclude long-term care, rehabilitation, psychiatric, and alcoholism and chemical dependency hospitals, but these types of discharges are included if they are from community hospitals. Unit of analysis The unit of analysis is the ED visit or hospital discharge (i.e., the hospital stay), not a person or patient. This means that a person who is admitted to the ED or hospital multiple times in one year will be counted each time as a separate "visit" or "discharge" from the hospital. Urban-rural location Urban-rural location is one of six categories as defined by the National Center for Health Statistics:
Region Region is one of the four regions defined by the U.S. Census Bureau:
HCUP is a family of powerful healthcare databases, software tools, and products for advancing research. Sponsored by the Agency for Healthcare Research and Quality (AHRQ), HCUP includes the largest all-payer encounter-level collection of longitudinal healthcare data (inpatient, ambulatory surgery, and emergency department) in the United States, beginning in 1988. HCUP is a Federal-State-Industry Partnership that brings together the data collection efforts of many organizations—such as State data organizations, hospital associations, private data organizations, and the Federal government—to create a national information resource. HCUP would not be possible without the contributions of the following data collection Partners from across the United States: Arizona Department of Health Services Arkansas Department of Health California Office of Statewide Health Planning and Development Colorado Hospital Association Connecticut Hospital Association Florida Agency for Health Care Administration Georgia Hospital Association Hawaii Health Information Corporation Illinois Department of Public Health Indiana Hospital Association Iowa Hospital Association Kansas Hospital Association Kentucky Cabinet for Health and Family Services Louisiana Department of Health and Hospitals Maine Health Data Organization Maryland Health Services Cost Review Commission Massachusetts Division of Health Care Finance and Policy Michigan Health & Hospital Association Minnesota Hospital Association Missouri Hospital Industry Data Institute Montana MHA — An Association of Montana Health Care Providers Nebraska Hospital Association Nevada Department of Health and Human Services New Hampshire Department of Health & Human Services New Jersey Department of Health and Senior Services New Mexico Health Policy Commission New York State Department of Health North Carolina Department of Health and Human Services Ohio Hospital Association Oklahoma State Department of Health Oregon Association of Hospitals and Health Systems Pennsylvania Health Care Cost Containment Council Rhode Island Department of Health South Carolina State Budget & Control Board South Dakota Association of Healthcare Organizations Tennessee Hospital Association Texas Department of State Health Services Utah Department of Health Vermont Association of Hospitals and Health Systems Virginia Health Information Washington State Department of Health West Virginia Health Care Authority Wisconsin Department of Health Services Wyoming Hospital Association About the NEDS The HCUP Nationwide Emergency Department Database (NEDS) is a unique and powerful database that yields national estimates of emergency department (ED) visits. The NEDS was constructed using records from both the HCUP State Emergency Department Databases (SEDD) and the State Inpatient Databases (SID). The SEDD capture information on ED visits that do not result in an admission (i.e., treat-and-release visits and transfers to another hospital); the SID contain information on patients initially seen in the emergency room and then admitted to the same hospital. The NEDS was created to enable analyses of ED utilization patterns and support public health professionals, administrators, policymakers, and clinicians in their decision-making regarding this critical source of care. About HCUPnet HCUPnet is an online query system that offers instant access to the largest set of all-payer healthcare databases that are publicly available. HCUPnet has an easy step-by-step query system, allowing for tables and graphs to be generated on national and regional statistics, as well as trends for community hospitals in the U.S. HCUPnet generates statistics using data from HCUP's Nationwide Inpatient Sample (NIS), the Kids' Inpatient Database (KID), the Nationwide Emergency Department Sample (NEDS), the State Inpatient Databases (SID) and the State Emergency Department Databases (SEDD). For More Information For more information about HCUP, visit http://www.hcup-us.ahrq.gov. For additional HCUP statistics, visit HCUPnet, our interactive query system, at www.hcup.ahrq.gov. For information on other hospitalizations in the U.S., download HCUP Facts and Figures: Statistics on Hospital-based Care in the United States in 2008, located at http://www.hcup-us.ahrq.gov/reports.jsp. For a detailed description of HCUP, more information on the design of the NIS, and methods to calculate estimates, please refer to the following publications: Introduction to the HCUP Nationwide Emergency Department Sample, 2008. Online. October 2010. U.S. Agency for Healthcare Research and Quality. http://hcup-us.ahrq.gov/db/nation/neds/NEDS2008Introductionv3.pdf. Introduction to the HCUP State Inpatient Databases. Online. June 2010. U.S. Agency for Healthcare Research and Quality. http://hcup-us.ahrq.gov/db/state/siddist/Introduction_to_SID.pdf. Introduction to the HCUP State Emergency Department Databases. Online. June 2010. U.S. Agency for Healthcare Research and Quality. http://hcup-us.ahrq.gov/db/state/sedddist/Introduction_to_SEDD.pdf. Houchens, R., Elixhauser, A. Final Report on Calculating Nationwide Inpatient Sample (NIS) Variances, 2001. HCUP Methods Series Report #2003-2. Online. June 2005 (revised June 6, 2005). U.S. Agency for Healthcare Research and Quality. http://www.hcup-us.ahrq.gov/reports/methods/2003_02.pdf. Suggested Citation Owens P.L. (AHRQ), Mutter R. (AHRQ). Emergency Department Visits Related to Eye Injuries, 2008. HCUP Statistical Brief #112. May 2011. Agency for Healthcare Research and Quality, Rockville, MD. http://www.hcup-us.ahrq.gov/reports/statbriefs/sb112.pdf. *** AHRQ welcomes questions and comments from readers of this publication who are interested in obtaining more information about access, cost, use, financing, and quality of healthcare in the United States. We also invite you to tell us how you are using this Statistical Brief and other HCUP data and tools, and to share suggestions on how HCUP products might be enhanced to further meet your needs. Please e-mail us at hcup@ahrq.gov or send a letter to the address below:Irene Fraser, Ph.D., Director Center for Delivery, Organization, and Markets Agency for Healthcare Research and Quality 540 Gaither Road Rockville, MD 20850 1 American Academy of Ophthalmology and American Society of Ocular Trauma, United States Eye Injury Registry summary report, 1998-2002. Original source is no longer available on the Web; for related information, refer to: http://www.geteyesmart.org/eyesmart/eye-health-news/upload/eye-health-statistics-july-2012-update.pdf 2 National Institute for Occupational Safety and Health (NIOSH). Healthy People 2010. Vision. Fact Sheet: Eye Safety at Work is Everyone's Business. www.nei.nih.gov/sites/default/files/2019-05/HVMPreventingInjuries_Tagged.pdf Accessed October 27, 2021. 3 Harrison, A., Telander, D.G. Eye injuries in the youth athlete: a case-based approach. Sports Medicine. 2002:31(1):33-40. 4 HCUP CCS. Healthcare Cost and Utilization Project (HCUP). December 2009. U.S. Agency for Healthcare Research and Quality, Rockville, MD. www.hcup-us.ahrq.gov/toolssoftware/ccs/ccs.jsp. |