STATISTICAL BRIEF #113
|
|
May 2011
Anne Elixhauser, Ph.D. and Lauren M. Wier, M.P.H.
Introduction Complications during pregnancy can pose a serious risk to both maternal and infant health, and are associated with various adverse outcomes, including miscarriage, hemorrhage, preterm labor, and low birth weight.1 An objective of the U.S. Department of Health & Human Services' Healthy People 2020 is to reduce maternal illness and complications related to pregnancy during hospitalization for labor and delivery.2 This Statistical Brief presents data from the Healthcare Cost and Utilization Project (HCUP) Nationwide Inpatient Sample (NIS) on pregnancy and childbirth hospitalizations with complicating conditions in 2008. All data are reported from the maternal perspective (i.e., reflecting the experience of the mother, not the newborn). For the purpose of this Brief, "complicating conditions" include all ICD-9-CM diagnosis codes that are in the section entitled "Complications of Pregnancy, Childbirth, and the Puerperium."3 This Brief presents information on hospital utilization and patient characteristics for the following types of hospital stays for:
Findings There were 4,673,700 pregnancy and delivery hospital stays recorded in these hospital discharge data among females ages 15 to 44 years in 2008. As shown in table 1, there were 473,700 non-delivery maternal hospital stays with complicating conditions as a principal or secondary diagnosis. Among the 4.2 million deliveries in 2008, the vast majority (94.1 percent) listed some type of complicating condition. Stays with pregnancy-related complicating conditions tended to be longer (2.9 days for non-delivery stays and 2.7 days for delivery stays) than delivery stays without complicating conditions (1.9 days). Maternal stays with complicating conditions were also about 50 percent more costly ($4,100 for non-delivery stays and $3,900 for delivery stays) than delivery stays without complications ($2,600). Maternal stays with pregnancy and delivery-related complicating conditions accounted for $17.4 billion, or nearly 5 percent of total hospital costs in the United States. |
|
| Table 1. Pregnancy and childbirth stays with and without complicating conditions*, 2008 | |||
| Non-delivery stays with complicating conditions | Delivery stays | ||
|---|---|---|---|
| With complicating complications | Without complicating complications | ||
| Total number of discharges (% of all pregnancy and childbirth stays) (% of all childbirth stays) |
473,700 (10.1%) (-) |
3,950,300 (84.5%) (94.1%) |
249,700 (5.3%) (5.9%) |
| Mean length of stay, days | 2.9 | 2.7 | 1.9 |
| Mean hospital costs | $4,100 | $3,900 | $2,600 |
| Aggregate costs | $1.9 billion | $15.5 billion | $0.6 billion |
| Discharge against medical advice | 1.88% | 0.06% | 0.04% |
| Mean age, years | 27.2 | 27.7 | 25.5 |
| Health insurance (percentage distribution) | |||
| Medicare | 1.6% | 0.7% | 0.5% |
| Medicaid | 45.5% | 39.7% | 50.5% |
| Uninsured | 6.5% | 3.5% | 4.4% |
| Private insurance | 42.9%‡ | 53.2% | 41.8% |
| Other | 3.3% | 2.7%‡ | 2.8% |
| Source: AHRQ, Center for Delivery, Organization, and Markets, Healthcare Cost and Utilization Project, Nationwide Inpatient Sample, 2008 * Complicating conditions include all conditions that are categorized as complications of pregnancy, delivery, or the puerperium based on ICD-9-CM diagnosis codes. Note: Counts of hospital stays are based on all-listed diagnoses, but each stay is counted only once. ‡ Values are not statistically different from values for delivery stays without complicating conditions at p<0.05. | |||
Discharge against medical advice was more common among non-delivery stays with complicating conditions (1.9 percent) compared to delivery stays with or without pregnancy-related complicating conditions (less than 0.1 percent). Among all women 18-44, less than 1 percent (0.9 percent) are discharged against medical advice (data not shown).
Rates and characteristics of complicating conditions, 2008 Table 2 shows the rates of complicating conditions among maternal stays. During an individual stay, multiple complicating conditions may be recorded; some may be more recorded as the principal diagnosis and some may be recorded as the secondary diagnosis. This table provides a complete accounting of all complicating conditions regardless of their severity. Non-delivery stays As shown in table 2, among non-delivery maternal stays, the following complicating conditions occurred at a rate of 100 or more for every 1,000 hospital stays:
The following complicating conditions occurred at a rate of 50-99 for every 1,000 hospital stays:
Delivery stays Among maternal stays with delivery, the following common complicating conditions occurred at a rate of 100 or more for every 1,000 deliveries:
The following complicating conditions occurred at a rate of 50-99 for every 1,000 deliveries:
|
| Table 2. Counts, rates, and mean maternal age for all-listed complicating conditions for maternal stays with and without delivery, 2008 | ||||||
| Complicating conditions for maternal stays | ||||||
|---|---|---|---|---|---|---|
| Without delivery | With delivery | |||||
| Number | Rate per 1,000 stays | Mean age | Number | Rate per 1,000 stays | Mean age | Number |
| Abortion-related disorders | 29,200 | 61.6 | 28.1 | - | - | - |
| Spontaneous abortion | 16,400 | 34.6 | 28.1 | - | - | - |
| Induced abortion | 5,300 | 11.2 | 27.8 | - | - | - |
| Post-abortion complications | 7,500 | 15.8 | 28.4 | - | - | - |
| Complications mainly related to pregnancy | 404,400 | 853.7 | 27.1 | 2,429,000 | 614.9 | 27.6 |
| Ectopic pregnancy | 26,700 | 56.3 | 29.0 | - | - | - |
| Hemorrhage during pregnancy; abruptio placenta; placenta previa | 24,600 | 51.9 | 28.6 | 76,600 | 19.4 | 28.7 |
| Placenta previa | - | - | - | 22,100 | 5.6 | 31.0 |
| Abruptio placenta | - | - | - | 44,500 | 11.3 | 27.8 |
| Other hemorrhage during pregnancy; childbirth and the puerperium | 19,400 | 40.9 | 28.7 | 12,100 | 3.1 | 28.0 |
| Hypertension complicating pregnancy; childbirth and the puerperium | 53,400 | 112.8 | 29.1 | 372,600 | 94.3 | 28.0 |
| Preeclampsia and eclampsia | 21,000 | 44.3 | 28.6 | 166,000 | 42.0 | 27.4 |
| Other hypertension in pregnancy | 33,000 | 69.6 | 29.4 | 210,600 | 53.3 | 28.5 |
| Early or threatened labor | 98,300 | 207.5 | 26.4 | 321,200 | 81.3 | 27.5 |
| Threatened premature labor | 90,100 | 190.2 | 26.4 | - | - | - |
| Early onset of delivery | - | - | - | 319,000 | 80.8 | 27.6 |
| Other early or threatened labor | 8,200 | 17.3 | 25.8 | - | - | - |
| Prolonged pregnancy | - | - | - | 478,700 | 121.2 | 27.0 |
| Diabetes or abnormal glucose tolerance complicating pregnancy; childbirth; or the puerperium | 38,700 | 81.6 | 29.5 | 266,800 | 67.5 | 30.6 |
| Other complications of pregnancy | 280,900 | 593.1 | 26.7 | 1,708,600 | 432.5 | 27.5 |
| Infections of genitourinary tract during pregnancy | 62,500 | 131.9 | 24.8 | 44,500 | 11.3 | 25.8 |
| Anemia during pregnancy | 46,900 | 99.0 | 26.7 | 441,600 | 111.8 | 26.7 |
| Missed abortion | 16,200 | 34.2 | 28.8 | - | - | - |
| Hyperemesis gravidarum | 29,600 | 62.5 | 26.0 | - | - | - |
| Infectious and parasitic complications in mother effecting pregnancy | 22,500 | 47.5 | 26.6 | 108,500 | 27.5 | 27.2 |
| Other and unspecified complications of pregnancy | 194,700 | 411.1 | 26.9 | 1,379,100 | 349.1 | 27.8 |
| Thyroid dysfunction in pregnancy* | 11,100 | 23.5 | 30.2 | 91,000 | 23.0 | 31.2 |
| Tobacco use in pregnancy* | 28,500 | 60.1 | 25.9 | 214,400 | 54.3 | 25.5 |
| Obesity in pregnancy* | 12,400 | 26.2 | 28.4 | 125,900 | 31.9 | 27.8 |
| Indications for care in pregnancy; labor; and delivery | 49,300 | 104.2 | 28.3 | 1,738,200 | 440.0 | 28.3 |
| Malposition; malpresentation | 8,900 | 18.8 | 28.3 | 317,400 | 80.4 | 28.6 |
| Breech presentation | 5,900 | 12.5 | 28.0 | 123,800 | 31.3 | 29.1 |
| Other malposition; malpresentation | - | - | - | 206,900 | 52.4 | 28.3 |
| Fetopelvic disproportion; obstruction | - | - | - | 213,900 | 54.1 | 27.1 |
| Fetopelvic disproportion | - | - | - | 80,900 | 20.5 | 26.4 |
| Other disproportion or obstruction | - | - | - | 164,400 | 41.6 | 27.2 |
| Previous cesarean section | 22,700 | 47,9 | 29.3 | 658,000 | 166.6 | 29.8 |
| Fetal distress and abnormal forces of labor | - | - | - | 439,200 | 111.2 | 27.1 |
| Fetal distress | - | - | - | 8,200 | 2.1 | 27.0 |
| Uterine inertia | - | - | - | 312,700 | 79.2 | 26.8 |
| Precipitate labor | - | - | - | 85,400 | 21.6 | 28.1 |
| Other abnormal forces of labor | - | - | - | 39,100 | 9.9 | 27.1 |
| Polyhydramnios and other problems of amniotic cavity | 19,400 | 41.0 | 27.5 | 462,800 | 117.2 | 27.6 |
| Premature rupture of membranes | 6,800 | 14.4 | 27.5 | 152,100 | 38.5 | 27.7 |
| Infection of amniotic cavity | - | - | - | 75,700 | 19.2 | 26.4 |
| Other problems of amniotic cavity | 12,000 | 25.3 | 27.5 | 259,900 | 65.8 | 27.7 |
| Complications during labor | - | - | - | 2,028,500 | 513.5 | 27.4 |
| Umbilical cord complication | - | - | - | 919,900 | 232.9 | 27.7 |
| Cord around neck with compression | - | - | - | 168,400 | 42.6 | 27.7 |
| Other and unspecified cord entanglement with or without compression | - | - | - | 704,400 | 178.3 | 27.7 |
| Other umbilical cord complications | - | - | - | 58,400 | 14.8 | 27.9 |
| Trauma to perineum and vulva | - | - | - | 1,452,800 | 367.8 | 27.3 |
| First degree perineal laceration | - | - | - | 622,400 | 157.6 | 26.8 |
| Second degree perineal laceration | - | - | - | 663,000 | 167.8 | 27.9 |
| Third degree perineal laceration | - | - | - | 75,300 | 19.1 | 27.3 |
| Fourth degree perineal laceration | - | - | - | 20,300 | 5.1 | 26.1 |
| Other perineal laceration and trauma | - | - | - | 119,200 | 30.2 | 25.8 |
| Forceps delivery | - | - | - | 40,600 | 10.3 | 25.7 |
| Other complications of birth; puerperium affecting management of mother | 157,400 | 332.3 | 28.8 | 1,828,300 | 462.8 | 29.0 |
| Postpartum hemorrhage | 6,100 | 12.8 | 28.7 | 117,200 | 29.7 | 27.5 |
| Complications of the puerperium | 41,500 | 87.7 | 27.6 | 111,400 | 28.2 | 28.4 |
| Cervical incompetence | 14,600 | 30.8 | 29.3 | 19,900 | 5.0 | 29.4 |
| Rhesus isoimmunization | - | - | - | 92,200 | 23.3 | 27.8 |
| Intrauterine death | - | - | - | 17,400 | 4.4 | 27.7 |
| Failed induction | 6,100 | 13.0 | 27.0 | 49,500 | 12.5 | 27.1 |
| Other obstetrical trauma | - | - | - | 87,900 | 22.3 | 26.5 |
| Other and unspecified complications of birth; puerperium affecting management of mother | 95,500 | 201.5 | 29.7 | 1,554,600 | 393.5 | 29.5 |
| Uterine fibroids* | - | - | - | 43,500 | 11.0 | 33.6 |
| Poor fetal growth* | - | - | - | 83,000 | 21.0 | 26.8 |
| Excessive fetal growth* | - | - | - | 112,300 | 28.4 | 28.9 |
| Advanced maternal age (35 years and older)* | 26,500 | 56.0 | 37.8 | 460,800 | 116.6 | 37.5 |
| Abnormality in fetal heart rate or rhythm* | 8,200 | 17.2 | 27.3 | 584,500 | 148.0 | 27.1 |
| Insufficient prenatal care* | 8,600 | 18.2 | 25.2 | 107,000 | 27.1 | 24.8 |
| Source: AHRQ, Center for Delivery, Organization, and Markets, Healthcare Cost and Utilization Project, Nationwide Inpatient Sample, 2008 Note: Condition counts are based on all-listed diagnoses and are not mutually exclusive; multiple conditions can be listed during a single hospital stay. Information is suppressed for conditions with frequencies less than 5,000. All categories are based on the multi-level CCS, except for categories indicated with *, which is based on ICD-9-CM diagnosis codes. | ||||||
Patient characteristics of maternal hospitalizations
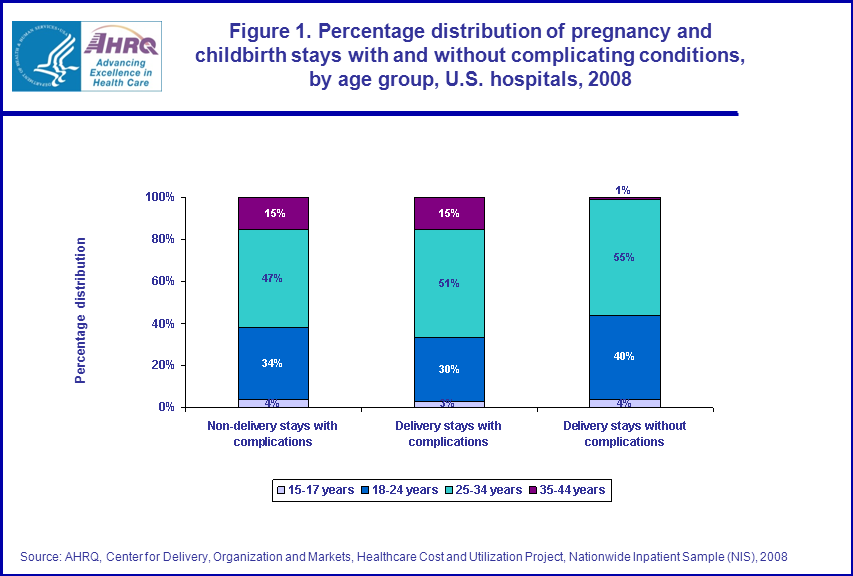
The average age for patients with complicating conditions was about 2 years older (27.2 years for non-delivery stays and 27.7 years for complicated delivery stays) than for patients delivering without complicating conditions (25.5 years). Figure 1 shows that patients 35 to 44 years accounted for 15 percent of maternal stays with complicating conditions (with or without delivery), but comprised only 1 percent of delivery stays without complicating conditions. |
|
Figure 1. Percentage distribution of pregnancy and childbirth stays with and without complicating conditions, by age group, U.S. hospitals, 2008. Bar chart; percentage distribution; Non-delivery stays with complications; ages 15 to 17 years, 4%; 18 to 24 years, 34%; 25 to 34 years, 47%; 35 to 44 years, 15%. Delivery stays with complications; ages 15 to 17 years, 3%; 18 to 24 years, 30%; 25 to 34 years, 51%; 35 to 44 years, 15%. Delivery stays without complications; ages 15 to 17 years, 4%; 18 to 24 years, 40%; 25 to 34 years, 55%; 35 to 44 years, 1%. Source: AHRQ, Center for Delivery, Organization and Markets, Healthcare Cost and Utilization Project, Nationwide Inpatient Sample (NIS), 2008.
|
As shown in table 1, Medicaid and private insurance were the most common expected payers for all maternity stays. For non-delivery stays with complicating conditions, Medicaid was the most common expected payer (45.5 percent), closely followed by private insurance (42.9 percent). Private insurance was the most common expected payer for delivery stays with complicating conditions (53.2 percent), followed by Medicaid (39.7 percent). About half of all delivery stays without complicating conditions of pregnancy were billed to Medicaid (50.5 percent), while 41.8 percent were billed to private insurance.
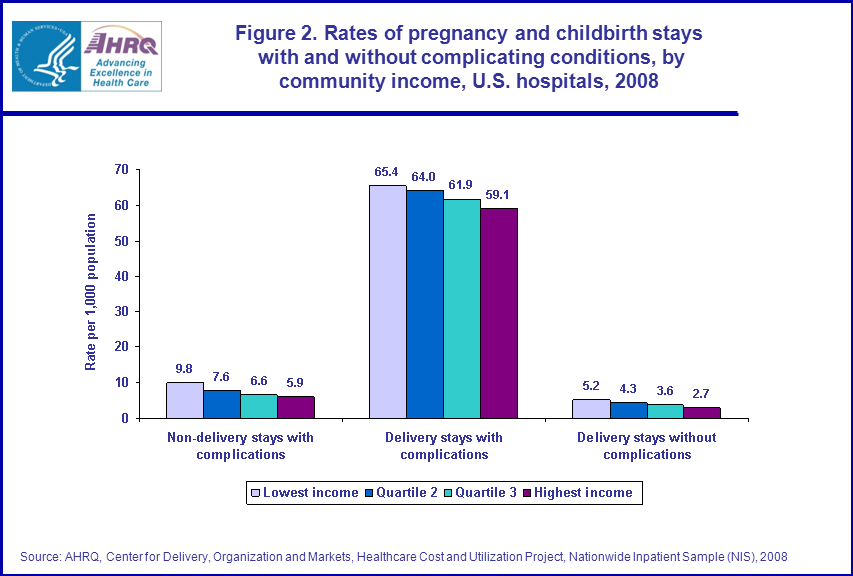
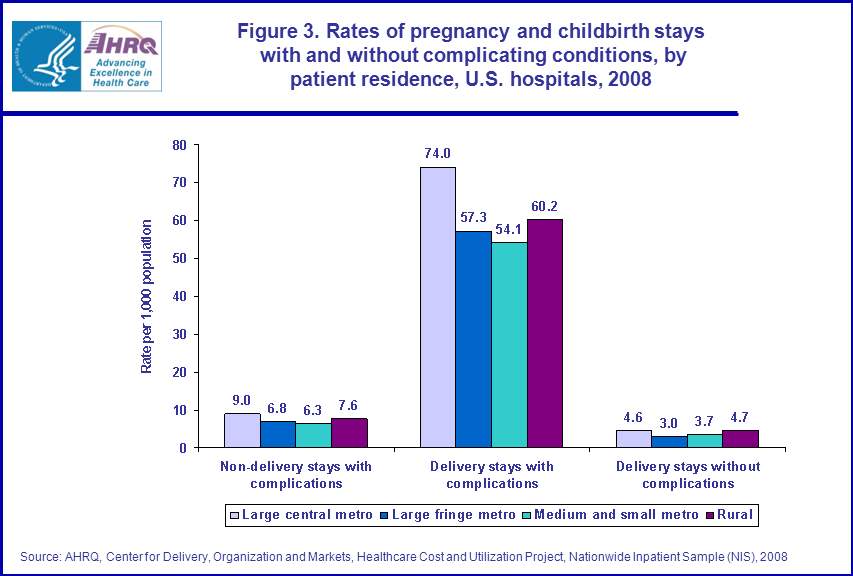
Hospitalization rates for non-delivery stays with complicating conditions and delivery stays (with and without complicating conditions) were highest in the poorest communities and declined with increasing income (figure 2). Across all three types of maternal stays, the rate of stays was higher for women living in large urban areas and rural areas (micropolitan and noncore) and lower for women living in medium and small metropolitan areas (figure 3). |
|
Figure 2. Rates of pregnancy and childbirth stays with and without complicating conditions, by community income, U.S. hospitals, 2008. Bar chart; Rate per 1,000 population; Non-delivery stays with complications; lowest income, 9.8; quartile 2; 7.6; quartile 3; 6.6; highest income, 5.9. Delivery stays with complications; lowest income, 65.4; quartile 2; 64.0; quartile 3; 61.9; highest income, 59.1. Delivery stays without complications; lowest income, 5.2; quartile 2; 4.3; quartile 3; 3.6; highest income, 2.7. Source: AHRQ, Center for Delivery, Organization and Markets, Healthcare Cost and Utilization Project, Nationwide Inpatient Sample (NIS), 2008.
|
|
Figure 3. Rates of pregnancy and childbirth stays with and without complicating conditions, by patient residence, U.S. hospitals, 2008. Bar chart; rate per 1,000 population; Non-delivery stays with complications; large central metro, 9.0; large fringe metro, 6.8; medium and small metro, 6.3; rural, 7.6; Delivery stays with complications; large central metro, 74.0; large fringe metro, 57.3; medium and small metro, 54.1; rural, 60.2; Delivery stays without complications; large central metro, 4.6; large fringe metro, 3.0; medium and small metro, 3.7; rural, 4.7; Source: AHRQ, Center for Delivery, Organization and Markets, Healthcare Cost and Utilization Project, Nationwide Inpatient Sample (NIS), 2008.
|
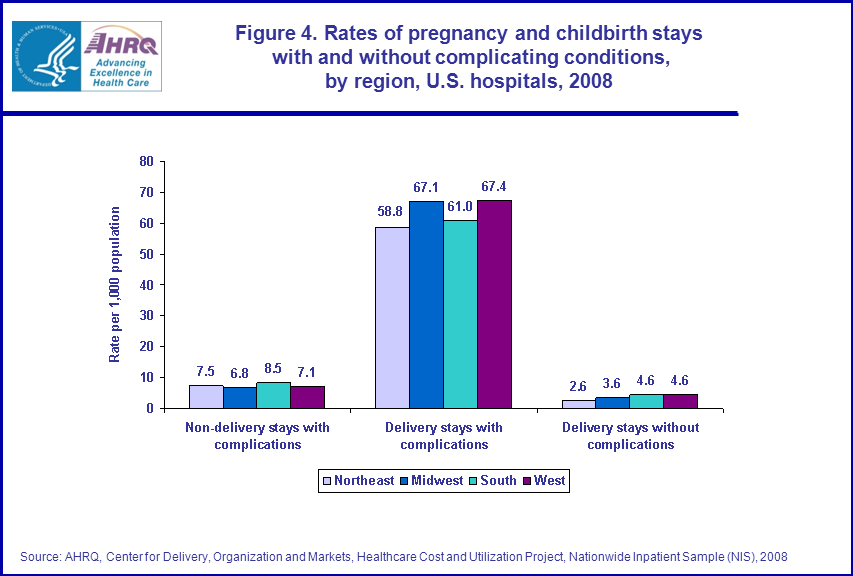
Figure 4 shows the rates of pregnancy and childbirth stays with and without complicating conditions by region. Regional differences were not statistically significant for stays with complications (with or without delivery). Delivery stays without complications were lowest in the Northeast and highest in the South and West.
|
|
Figure 4. Rates of pregnancy and childbirth stays with and without complicating conditions, by region, U.S. hospitals, 2008. Bar chart, rate per 1,000 population;
Non-delivery stays with complications; Northeast, 7.5; Midwest, 6.8; South, 8.5; West, 7.1; Delivery stays with complications; Northeast, 58.8; Midwest, 67.1; South, 61.0; West, 67.4; Delivery stays without complications; Northeast, 2.6; Midwest, 3.6; South, 4.6; West, 4.6; Source: AHRQ, Center for Delivery, Organization and Markets, Healthcare Cost and Utilization Project, Nationwide Inpatient Sample (NIS), 2008.
|
Data Source
The estimates in this Statistical Brief are based upon data from the 2008 HCUP Nationwide Inpatient Sample (NIS). Supplemental sources included data on regional population estimates from "Table 1: Annual Estimates of the Resident Population for the United States, Regions, States, and Puerto Rico: April 1, 2000 to July 1, 2009 (NST-EST2009-01)," Population Division, U.S. Census Bureau, Release date: December 2009 (https://www.census.gov/programs-surveys/popest/data/tables.html). Definitions Diagnoses, ICD-9-CM, and Clinical Classifications Software (CCS) The principal diagnosis is that condition established after study to be chiefly responsible for the patient’s admission to the hospital. Secondary diagnoses are concomitant conditions that coexist at the time of admission or that develop during the stay. ICD-9-CM is the International Classification of Diseases, Ninth Revision, Clinical Modification, which assigns numeric codes to diagnoses. There are about 13,600 ICD-9-CM diagnosis codes. CCS categorizes ICD-9-CM diagnoses into a manageable number of clinically meaningful categories.4 This "clinical grouper" makes it easier to quickly understand patterns of diagnoses and procedures. For table 2, the Multi-Level CCS was used to examine more specific categories of conditions. The Multi-Level CCS is a hierarchical system that is defined using both single-level CCS groupings and ICD-9-CM codes.5 For this report, CCS codes 177-195 were used to identify complicating conditions of pregnancy and childbirth. Delivery stays were identified by ICD-9-CM diagnosis codes 640.0-676.9, where the fifth digit is 1 or 2, or ICD-9-CM 650. Maternal stays were identified as having an all-listed ICD-9-CM diagnosis code in the delivery range or an all-listed CCS code 177-195. All stays were limited to patients’ ages 15 to 44 years. Types of hospitals included in HCUP HCUP is based on data from community hospitals, defined as short-term, non-Federal, general and other hospitals, excluding hospital units of other institutions (e.g., prisons). HCUP data include OB-GYN, ENT, orthopedic, cancer, pediatric, public, and academic medical hospitals. Excluded are long-term care, rehabilitation, psychiatric, and alcoholism and chemical dependency hospitals. Please note, a discharge of this nature will be included in the NIS if it occurred in a community hospital. Unit of analysis The unit of analysis is the hospital discharge (i.e., the hospital stay), not a person or patient. This means that a person who is admitted to the hospital multiple times in one year will be counted each time as a separate "discharge" from the hospital. Costs and charges Total hospital charges were converted to costs using HCUP Cost-to-Charge Ratios based on hospital accounting reports from the Centers for Medicare and Medicaid Services (CMS).6 Costs will tend to reflect the actual costs of production, while charges represent what the hospital billed for the case. For each hospital, a hospital-wide cost-to-charge ratio is used because detailed charges are not available across all HCUP States. Hospital charges reflect the amount the hospital charged for the entire hospital stay and does not include professional (physician) fees. For the purposes of this Statistical Brief, costs are reported to the nearest hundred. Urban-rural location Urban-rural location is one of six categories as defined by the National Center for Health Statistics:
In this report, medium and small metropolitan were combined into one category and micropolitan and non-core were combined and labeled "rural." Median community-level income Median community-level income is the median household income of the patient’s ZIP Code of residence. The cut-offs for the quartile designation are determined using ZIP Code demographic data obtained from Claritas. The income quartile is missing for homeless and foreign patients. Payer Payer is the expected primary payer for the hospital stay. To make coding uniform across all HCUP data sources, payer combines detailed categories into more general groups:
When more than one payer is listed for a hospital discharge, the first-listed payer is used. Region Region is one of the four regions defined by the U.S. Census Bureau:
Discharge status Discharge status indicates the disposition of the patient at discharge from the hospital, and includes the following six categories: routine (to home), transfer to another short-term hospital, other transfers (including skilled nursing facility, intermediate care, and another type of facility such as a nursing home), home healthcare, against medical advice (AMA), or died in the hospital. About HCUP HCUP is a family of powerful healthcare databases, software tools, and products for advancing research. Sponsored by the Agency for Healthcare Research and Quality (AHRQ), HCUP includes the largest all-payer encounter-level collection of longitudinal healthcare data (inpatient, ambulatory surgery, and emergency department) in the United States, beginning in 1988. HCUP is a Federal-State-Industry Partnership that brings together the data collection efforts of many organizations—such as State data organizations, hospital associations, private data organizations, and the Federal government—to create a national information resource. HCUP would not be possible without the contributions of the following data collection Partners from across the United States: Arizona Department of Health Services Arkansas Department of Health California Office of Statewide Health Planning and Development Colorado Hospital Association Connecticut Hospital Association Florida Agency for Health Care Administration Georgia Hospital Association Hawaii Health Information Corporation Illinois Department of Public Health Indiana Hospital Association Iowa Hospital Association Kansas Hospital Association Kentucky Cabinet for Health and Family Services Louisiana Department of Health and Hospitals Maine Health Data Organization Maryland Health Services Cost Review Commission Massachusetts Division of Health Care Finance and Policy Michigan Health & Hospital Association Minnesota Hospital Association Missouri Hospital Industry Data Institute Montana MHA — An Association of Montana Health Care Providers Nebraska Hospital Association Nevada Department of Health and Human Services New Hampshire Department of Health & Human Services New Jersey Department of Health and Senior Services New Mexico Health Policy Commission New York State Department of Health North Carolina Department of Health and Human Services Ohio Hospital Association Oklahoma State Department of Health Oregon Association of Hospitals and Health Systems Pennsylvania Health Care Cost Containment Council Rhode Island Department of Health South Carolina State Budget & Control Board South Dakota Association of Healthcare Organizations Tennessee Hospital Association Texas Department of State Health Services Utah Department of Health Vermont Association of Hospitals and Health Systems Virginia Health Information Washington State Department of Health West Virginia Health Care Authority Wisconsin Department of Health Services Wyoming Hospital Association About the NIS The HCUP Nationwide Inpatient Sample (NIS) is a nationwide database of hospital inpatient stays. The NIS is nationally representative of all community hospitals (i.e., short-term, non-Federal, non-rehabilitation hospitals). The NIS is a sample of hospitals and includes all patients from each hospital, regardless of payer. It is drawn from a sampling frame that contains hospitals comprising about 95 percent of all discharges in the United States. The vast size of the NIS allows the study of topics at both the national and regional levels for specific subgroups of patients. In addition, NIS data are standardized across years to facilitate ease of use. For More Information For more information about HCUP, visit http://www.hcup-us.ahrq.gov. For additional HCUP statistics, visit HCUPnet, our interactive query system, at www.hcup.ahrq.gov. For information on other hospitalizations in the U.S., download HCUP Facts and Figures: Statistics on Hospital-based Care in the United States in 2008, located at http://www.hcup-us.ahrq.gov/reports.jsp. For a detailed description of HCUP, more information on the design of the NIS, and methods to calculate estimates, please refer to the following publications: Steiner, C., Elixhauser, A., Schnaier, J. The Healthcare Cost and Utilization Project: An Overview. Effective Clinical Practice 5(3):143–51, 2002. Introduction to the HCUP Nationwide Inpatient Sample, 2008. Online. May 2010. Agency for Healthcare Research and Quality. http://hcup-us.ahrq.gov/db/nation/nis/NIS_2008_INTRODUCTION.pdf Houchens, R., Elixhauser, A. Final Report on Calculating Nationwide Inpatient Sample (NIS) Variances, 2001. HCUP Methods Series Report #2003-2. Online. June 2005 (revised June 6, 2005). U.S. Agency for Healthcare Research and Quality. http://www.hcup-us.ahrq.gov/reports/methods/2003_02.pdf. Suggested Citation Elixhauser, A. (AHRQ) and Wier, L.M. (Thomson Reuters). Complicating Conditions of Pregnancy and Childbirth, 2008. HCUP Statistical Brief #113. May 2011. Agency for Healthcare Research and Quality, Rockville, MD. http://www.hcup-us.ahrq.gov/reports/statbriefs/sb113.pdf. Acknowledgments The authors would like to acknowledge Minya Sheng (Thomson Reuters) for programming assistance. *** AHRQ welcomes questions and comments from readers of this publication who are interested in obtaining more information about access, cost, use, financing, and quality of healthcare in the United States. We also invite you to tell us how you are using this Statistical Brief and other HCUP data and tools, and to share suggestions on how HCUP products might be enhanced to further meet your needs. Please e-mail us at hcup@ahrq.gov or send a letter to the address below:Irene Fraser, Ph.D., Director Center for Delivery, Organization, and Markets Agency for Healthcare Research and Quality 540 Gaither Road Rockville, MD 20850 1 American Pregnancy Association, Pregnancy Complications. http://www.americanpregnancy.org/pregnancycomplications/ 2 U.S. Department of Health & Human Services, Maternal, Infant, and Child Health. http://www.healthypeople.gov/2020/topics-objectives/topic/maternal-infant-and-child-health/objectives 3 This classification of pregnancy complications is more inclusive than those diagnoses considered complications by Diagnostic Related Group (DRG) codes. Depending on the DRG assignment, an ICD-9-CM pregnancy or delivery complication code may not be considered a complication. For example, the following ICD-9-CM codes all fall into DRG 775 –"Vaginal delivery without complicating diagnoses" but are listed as complications based on ICD-9-CM codes: 64311-hyperemesis gravidarum with metabolic disturbance 64321-late vomiting of pregnancy 64622-renal disease not otherwise specified 64661-genitourinary infection 64831-drug dependence 64881-abnormal glucose tolerance 65221-breech presentation 4 HCUP CCS. Healthcare Cost and Utilization Project (HCUP). December 2009. U.S. Agency for Healthcare Research and Quality, Rockville, MD. www.hcup-us.ahrq.gov/toolssoftware/ccs/ccs.jsp. 5 Elixhauser A., Steiner C., Palmer L. Clinical Classifications Software (CCS), 2011. U.S. Agency for Healthcare Research and Quality. Available: http://www.hcup-us.ahrq.gov/toolssoftware/ccs/CCSUsersGuide.pdf . 6 HCUP Cost-to-Charge Ratio Files (CCR). Healthcare Cost and Utilization Project (HCUP). 2001–2008. U.S. Agency for Healthcare Research and Quality, Rockville, MD. www.hcup-us.ahrq.gov/db/state/costtocharge.jsp. |