STATISTICAL BRIEF #114
|
|
May 2011
Lan Zhao, Ph.D., Weiwei Han, M.S., and Claudia Steiner, M.D., M.P.H.
Introduction Sports related concussions have attracted increasing public attention in recent years. In January 2011, Congress reintroduced legislation to set minimum safety standards for concussion management in public schools.1 As of March 2011, a dozen states2 have laws in place that promote the use of established protocols that guide the management of student athletes who suffer concussions. More states3 are following suit with similar legislation pending. Without appropriate management, sports related concussions can have adverse effects on a student's school performance and social functioning, and can cause long-term symptoms and complications. This Statistical Brief presents data from the Healthcare Cost and Utilization Project (HCUP) on emergency department (ED) visits and inpatient admissions for sports related concussions in 2008. Patient demographic characteristics (age, sex, and region), hospital characteristics (teaching and trauma center status), and clinical characteristics (loss of consciousness) are compared between sports related and non-sports related concussions. Top concurrent conditions are also compared between these two types of concussions. All differences between estimates noted in the text are statistically significant at the 0.05 level or better. Findings In 2008, there were approximately 44,000 ED visits for sports related concussions; of all ED visits for concussion, 7.4 percent were related to sports. Table 1 compares the distribution of ED visits for sports related concussions to non-sports related concussions by patient demographic and clinical characteristics, and hospital characteristics. |
|
| Table 1: Characteristics of emergency department (ED) visits related to concussion, 2008 | ||
| ED visits for concussion* | ||
|---|---|---|
| Sports related | Non-sports related | |
| Total number of visits | 43,802 | 549,012 |
| Percentage of all ED visits | 0.04 | 0.44 |
| Patient characteristics | ||
| Sex (percentage) | ||
| Male | 77.8 | 58.3 |
| Female | 22.2 | 41.7 |
| Region, rate per 10,000 population | ||
| Northeast | 2.1 | 16.8 |
| Midwest | 1.7 | 21.4 |
| South | 1.0 | 17.4 |
| West | 1.2 | 15.8 |
| Clinical characteristics | ||
| Loss of consciousness (percentage) | ||
| No loss | 51.6 | 39.9 |
| Brief loss | 21.1 | 19.2 |
| Moderate or prolonged loss | 11.6 | 25.0 |
| Unspecified | 15.6 | 15.9 |
| Hospital characteristics | ||
| Teaching status (percentage) | ||
| Yes | 38.8 | 39.9 |
| No | 61.2 | 60.1 |
| Trauma center status (percentage) | ||
| Yes | 39.2 | 44.1 |
| No | 60.8 | 55.9 |
| * Based on all-listed diagnoses. Source: AHRQ, Center for Delivery, Organization, and Markets, Healthcare Cost and Utilization Project, Nationwide Emergency Department Sample, 2008 | ||
In 2008, males accounted for more than three-quarters of ED visits for concussion related to sports. This compares to 58.3 percent of males with non-sports related concussions.
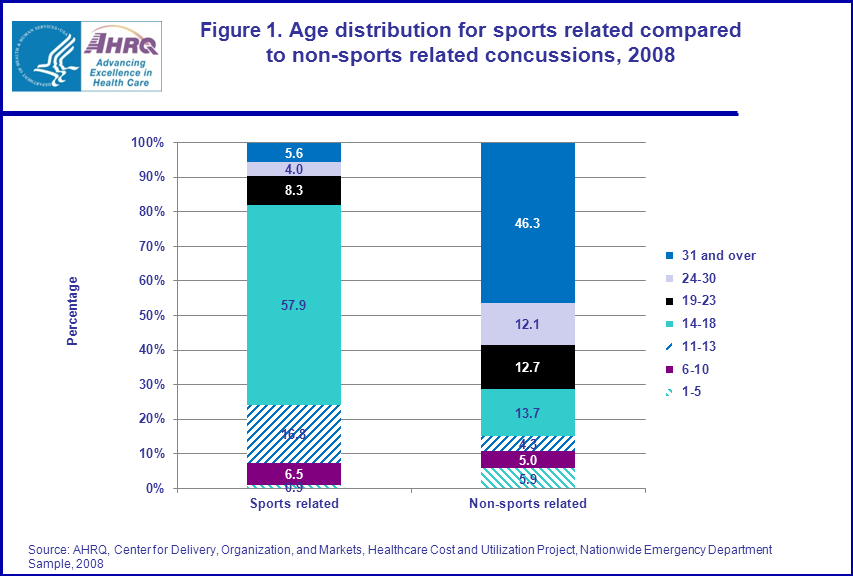
The rate of ED visits for sports related concussions was higher in the Northeast and Midwest regions at 2.1 and 1.7 per 10,000 population, compared to the South and West (1.0 and 1.2 per 10,000). The rate of ED visits for non-sports related concussions was between 7 and 16 times higher than sports related concussions and was the highest in the Midwest region of the U.S. More than half of ED patients diagnosed with a sports related concussion experienced no loss of consciousness (51.6 percent) and another one-fifth experienced a brief loss of consciousness (21.1 percent). In comparison, ED patients with a non-sports related concussion were more likely to report loss of consciousness—one-quarter of them experienced moderate or prolonged loss of consciousness, more than twice the proportion of ED patients diagnosed with a sports related concussion (11.6 percent). Emergency departments of teaching hospitals treated a little more than one-third of visits for concussion, regardless of whether the concussion was sports related or not. Thirty-nine percent of ED visits for sports related concussions occurred in an ED with a designated trauma center, compared to 44.1 percent of ED visits for non-sports related concussions. Sports related concussions by patient age The ED visits for sports related concussion are highly concentrated in school age children. Figure 1 shows the age distribution of sports related and non-sports related concussions in 2008. Of all ED visits for sports related concussion, more than half (57.9 percent) were for high school age children (14-18 years of age). Another 16.8 percent were for middle school age children (11-13 years of age). Less than one-tenth of ED patients diagnosed with sports related concussion were 24 and older. In contrast, the majority of non-sports related concussion ED visits (58.4 percent) occurred in patients 24 and older. |
|
Figure 1. Age distribution for sports related compared to non-sports related concussions, 2008. Stacked bar chart; percentage; Sports related, ages 1 through 5, 0.9; 6 through 10, 6.5; 11 through 13, 16.8; 14 through 18, 57.9; 19 through 23, 8.3; 24 through 30, 4.0; 31 and over, 5.6; Non-sports related, ages 1 through 5, 5.9; 6 through 10, 5.0; 11 through 13, 4.3; 14 through 18, 13.7; 19 through 23, 12.7; 24 through 30, 12.1; 31 and over, 46.3; Source: AHRQ, Center for Delivery, Organization, and Markets, Healthcare Cost and Utilization Project, Nationwide Emergency Department Sample, 2008.
|
Patient discharge status for sports related concussions
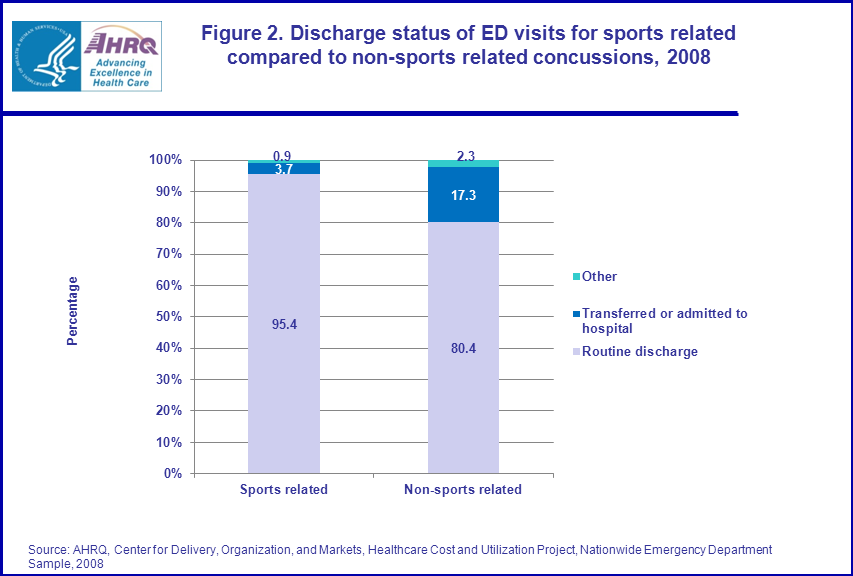
Figure 2 shows that the vast majority (95.4 percent) of ED visits in patients with a sports related concussion were discharged home. Only 3.7 percent of patients were admitted to the same hospital or transferred to another hospital for further treatment. For ED visits following non-sports related concussions, 17.3 percent were admitted or transferred to another hospital. |
|
Figure 2. Discharge status of ED visits for sports related compared to non-sports related concussions, 2008. Stacked bar chart; percentage; Sports related; routine discharge, 95.4; transferred or admitted to hospital, 3.7; other, 0.9; Non-sports related; routine discharge, 80.4; transferred or admitted to hospital, 17.3; other, 2.3; Source: AHRQ, Center for Delivery, Organization, and Markets, Healthcare Cost and Utilization Project, Nationwide Emergency Department Sample, 2008.
|
Level of consciousness by patient discharge status for sports related concussion
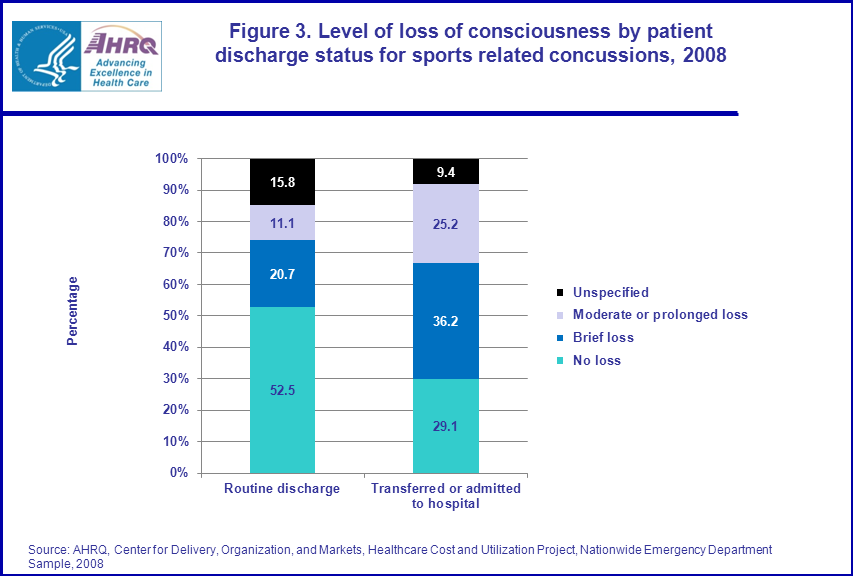
A higher proportion of patients who were hospitalized after an ED visit for sports related concussion experienced loss of consciousness than those who were discharged home (figure 3). Thirty-six percent of hospitalized patients experienced brief loss of consciousness, compared to 20.7 percent of those sent home. The proportion of hospitalized patients who had suffered moderate or prolonged loss of consciousness (25.2 percent) was more than double that of patients routinely discharged (11.1 percent). |
|
Figure 3. Level of loss of consciousness by patient discharge status for sports related concussions, 2008. Stacked bar chart; percentage; Routine discharge; no loss, 52.5; brief loss, 20.7; moderate or prolonged loss, 11.1; unspecified, 15.8; Transferred or admitted to hospital; no loss, 29.1; brief loss, 36.2; moderate or prolonged loss, 25.2; unspecified, 9.4; Source: AHRQ, Center for Delivery, Organization, and Markets, Healthcare Cost and Utilization Project, Nationwide Emergency Department Sample, 2008.
|
Top conditions associated with sports related concussion
Table 2 provides the top 10 conditions associated with concussion. For ED visits with concussion listed as the principal diagnosis, the associated conditions were less serious than when concussion was listed as a secondary diagnosis. For sports related concussion cases, open wounds of head, neck and trunk, skull and face fractures, and fracture of upper limb were all more frequent when concussion was listed as a secondary condition. Less serious conditions such as a superficial injury or contusion, sprains and strains, and headache were associated with sport related concussion listed as a principal diagnosis. |
| Table 2: Conditions associated with sports related concussions, 2008 | ||||
| Concussion listed as the principal diagnosis | Concussion listed as a secondary diagnosis | |||
|---|---|---|---|---|
| Associated secondary conditions | Associated principal conditions | |||
| Rank | CCS condition | Percentage of all associated conditions | CCS condition | Percentage of all associated conditions |
| 1 | Superficial injury; contusion | 18.9 | Superficial injury; contusion | 25.7 |
| 2 | Sprains and strains | 13.1 | Open wounds of head; neck; and trunk | 19.5 |
| 3 | Headache; including migraine | 9.4 | Other injuries and conditions due to external causes | 18.9 |
| 4 | Open wounds of head; neck; and trunk | 5.6 | Sprains and strains | 11.5 |
| 5 | Nausea and vomiting | 4.5 | Skull and face fractures | 7.5 |
| 6 | Other injuries and conditions due to external causes | 4.5 | Headache; including migraine | 3.9 |
| 7 | Asthma | 4.5 | Fracture of upper limb | 1.4 |
| 8 | Spondylosis; intervertebral disc disorders; other back problems | 4.4 | Spondylosis; intervertebral disc disorders; other back problems | 1.4 |
| 9 | Conditions associated with dizziness or vertigo | 2.4 | Syncope | 1.2 |
| 10 | Skull and face fractures | 1.8 | Delirium, dementia, and amnestic and other cognitive disorders | 1.1 |
| Source: AHRQ, Center for Delivery, Organization, and Markets, Healthcare Cost and Utilization Project, Nationwide Emergency Department Sample, 2008 | ||||
Data Source
The estimates in this Statistical Brief are based upon data from the HCUP 2008 Nationwide Emergency Department Sample (NEDS). Supplemental sources included data from the U.S. Census Bureau, Population Division, Annual Estimates of the Population for the United States, Regions, and Divisions. Definitions Diagnoses, ICD-9-CM, and Clinical Classifications Software (CCS) The principal diagnosis is that condition established after study to be chiefly responsible for the patient’s admission to the hospital. Secondary diagnoses are concomitant conditions that coexist at the time of admission or that develop during the stay. All-listed diagnoses include the principal diagnosis plus these additional secondary conditions. ICD-9-CM is the International Classification of Diseases, Ninth Revision, Clinical Modification, which assigns numeric codes to diagnoses. There are about 13,600 ICD-9-CM diagnosis codes. CCS categorizes ICD-9-CM diagnoses into a manageable number of clinically meaningful categories.4 This "clinical grouper" makes it easier to quickly understand patterns of diagnoses and procedures. Case definition The ICD-9-CM codes defining concussion include diagnosis codes with ‘850’ in the first three digits. Sports related concussion is defined as concussion that has E code ‘E9170’ or ‘E9175’, or ‘E886’. Types of hospitals included in HCUP HCUP is based on data from community hospitals, defined as short-term, non-Federal, general and other hospitals, excluding hospital units of other institutions (e.g., prisons). HCUP data include OB-GYN, ENT, orthopedic, cancer, pediatric, public, and academic medical hospitals. Excluded are long-term care, rehabilitation, psychiatric, and alcoholism and chemical dependency hospitals. Please note, a discharge of this nature will be included in the NIS if it occurred in a community hospital. Unit of analysis The unit of analysis is the ED visit or hospital discharge (i.e., the hospital stay), not a person or patient. This means that a person who is admitted to the ED or hospital multiple times in one year will be counted each time as a separate "visit" or "discharge" from the hospital. Region Region is one of the four regions defined by the U.S. Census Bureau:
Discharge status Discharge status indicates the disposition of the patient at discharge from the hospital, and includes the following six categories: routine (to home), transfer to another short-term hospital, other transfers (including skilled nursing facility, intermediate care, and another type of facility such as a nursing home), home healthcare, against medical advice (AMA), or died in the hospital. About HCUP HCUP is a family of powerful healthcare databases, software tools, and products for advancing research. Sponsored by the Agency for Healthcare Research and Quality (AHRQ), HCUP includes the largest all-payer encounter-level collection of longitudinal healthcare data (inpatient, ambulatory surgery, and emergency department) in the United States, beginning in 1988. HCUP is a Federal-State-Industry Partnership that brings together the data collection efforts of many organizations—such as State data organizations, hospital associations, private data organizations, and the Federal government—to create a national information resource. HCUP would not be possible without the contributions of the following data collection Partners from across the United States: Arizona Department of Health Services Arkansas Department of Health California Office of Statewide Health Planning and Development Colorado Hospital Association Connecticut Hospital Association Florida Agency for Health Care Administration Georgia Hospital Association Hawaii Health Information Corporation Illinois Department of Public Health Indiana Hospital Association Iowa Hospital Association Kansas Hospital Association Kentucky Cabinet for Health and Family Services Louisiana Department of Health and Hospitals Maine Health Data Organization Maryland Health Services Cost Review Commission Massachusetts Division of Health Care Finance and Policy Michigan Health & Hospital Association Minnesota Hospital Association Missouri Hospital Industry Data Institute Montana MHA — An Association of Montana Health Care Providers Nebraska Hospital Association Nevada Department of Health and Human Services New Hampshire Department of Health & Human Services New Jersey Department of Health and Senior Services New Mexico Health Policy Commission New York State Department of Health North Carolina Department of Health and Human Services Ohio Hospital Association Oklahoma State Department of Health Oregon Association of Hospitals and Health Systems Pennsylvania Health Care Cost Containment Council Rhode Island Department of Health South Carolina State Budget & Control Board South Dakota Association of Healthcare Organizations Tennessee Hospital Association Texas Department of State Health Services Utah Department of Health Vermont Association of Hospitals and Health Systems Virginia Health Information Washington State Department of Health West Virginia Health Care Authority Wisconsin Department of Health Services Wyoming Hospital Association About the NEDS The HCUP Nationwide Emergency Department Database (NEDS) is a unique and powerful database that yields national estimates of emergency department (ED) visits. The NEDS was constructed using records from both the HCUP State Emergency Department Databases (SEDD) and the State Inpatient Databases (SID). The SEDD capture information on ED visits that do not result in an admission (i.e., treat-and-release visits and transfers to another hospital); the SID contain information on patients initially seen in the emergency room and then admitted to the same hospital. The NEDS was created to enable analyses of ED utilization patterns and support public health professionals, administrators, policymakers, and clinicians in their decision-making regarding this critical source of care. The NEDS is produced annually beginning in 2006. For More Information For more information about HCUP, visit http://www.hcup-us.ahrq.gov. For additional HCUP statistics, visit HCUPnet, our interactive query system, at www.hcup.ahrq.gov. For information on other hospitalizations in the U.S., download HCUP Facts and Figures: Statistics on Hospital-based Care in the United States in 2008, located at http://www.hcup-us.ahrq.gov/reports.jsp. For a detailed description of HCUP, more information on the design of the NEDS, and methods to calculate estimates, please refer to the following publications: Introduction to the HCUP Nationwide Emergency Department Sample, 2008. Online. October 2010. Agency for Healthcare Research and Quality. http://hcup-us.ahrq.gov/db/nation/neds/NEDS2008Introductionv3.pdf Suggested Citation Zhao, L. (Social & Scientific Systems, Inc.), Han, W. (Social & Scientific Systems, Inc.), Steiner, C. (AHRQ). Sports Related Concussions, 2008. HCUP Statistical Brief #114. May 2011. Agency for Healthcare Research and Quality, Rockville, MD. http://www.hcup-us.ahrq.gov/reports/statbriefs/sb114.pdf. *** AHRQ welcomes questions and comments from readers of this publication who are interested in obtaining more information about access, cost, use, financing, and quality of healthcare in the United States. We also invite you to tell us how you are using this Statistical Brief and other HCUP data and tools, and to share suggestions on how HCUP products might be enhanced to further meet your needs. Please e-mail us at hcup@ahrq.gov or send a letter to the address below:Irene Fraser, Ph.D., Director Center for Delivery, Organization, and Markets Agency for Healthcare Research and Quality 540 Gaither Road Rockville, MD 20850 1 H.R.469—The Protecting Student Athletes from Concussions Act of 2011. 2 States with current legislation include Connecticut, Idaho, Massachusetts, New Jersey, New Mexico, Oklahoma, Oregon, Rhode Island, South Dakota, Texas, Virginia, and Washington. 3 States with pending legislation include Alaska, Arizona, California, Colorado, District of Columbia, Florida, Hawaii, Illinois, Indiana, Iowa, Kansas, Maine, Maryland, Missouri, Nebraska, New York, North Dakota, Ohio, Pennsylvania, Tennessee, Utah, Vermont, and Wyoming. 4 HCUP CCS. Healthcare Cost and Utilization Project (HCUP). December 2009. U.S. Agency for Healthcare Research and Quality, Rockville, MD. www.hcup-us.ahrq.gov/toolssoftware/ccs/ccs.jsp |