STATISTICAL BRIEF #132
|
|
May 2012
Rebecca Anhang Price, Ph.D., Elizabeth Stranges, M.S., and Anne Elixhauser, Ph.D. Introduction The American Cancer Society estimates that approximately 12,000 children under the age of 15 will be diagnosed with cancer in 2012, and that more than 1,300 will die of the disease.1 Childhood cancer incidence rates have increased significantly since 1975. However, due to new and improved pediatric cancer treatments, cancer death rates among children have decreased over the last three decades.2 This Statistical Brief presents data from the Healthcare Cost and Utilization Project (HCUP) on hospital stays for cancer care in individuals under 18 years of age in 2009. Characteristics of these stays are compared with all non-newborn pediatric stays. Trends in the most common pediatric cancer hospitalizations, as well as cost and length of cancer stays, are displayed. Variations in cost and length of stay are described by cancer site. Finally, principal diagnoses among children with secondary cancer stays are noted. All differences between estimates noted in the text are statistically significant at the 0.05 level or better. Findings General findings In 2009, there were 94,600 cancer-related hospitalizations among children under the age of 18 in the U.S. In 22.5 percent of them, cancer was identified as the principal diagnosis (21,300 stays). Pediatric hospital stays principally for cancer cost $859.8 million, accounting for 5.2 percent of non-newborn pediatric inpatient hospital costs. Between 2000 and 2009, the number of pediatric hospital stays principally for cancer decreased by 3.3 percent, while the number of non-newborn pediatric hospital stays for all other reasons increased by 11.0 percent (data not shown).3 General characteristics of hospital stays for cancer Table 1 presents the general characteristics of pediatric hospitalizations principally for cancer compared to non-newborn pediatric hospitalizations for all other conditions in 2009. On average, children hospitalized for cancer were 1.4 years older than those admitted for other conditions (8.1 years of age versus 6.7 years). Similar to stays for all other conditions, hospital stays primarily for cancer were slightly more likely to be among males than females. The in-hospital death rate during stays principally for cancer was 3.0 percent—approximately 10 times higher than for all other pediatric hospital stays. About 54.8 percent of pediatric hospitalizations primarily for cancer were covered by private payers and 37.0 percent were paid for by Medicaid. In contrast, nearly half (48.5 percent) of all other pediatric stays were paid for by Medicaid. On average, pediatric hospitalizations principally for cancer were 8 days longer and cost nearly 5 times as much as hospitalizations for other conditions (12.0 days versus 3.8 days; $40,400 versus $8,100 per stay). Costs per day were about 70 percent higher for pediatric cancer stays ($3,900 versus $2,300 per day). |
|
| Table 1. Characteristics of pediatric hospitalizations for cancer compared to non-newborn hospitalizations of children for all other conditions, 2000 and 20091 | ||||
| 2009 | 2000 | |||
|---|---|---|---|---|
| Hospital stays principally for cancer | All other hospital stays for children2 | Hospital stays principally for cancer | All other hospital stays for children2 | |
| Number of stays | 21,300 | 2,029,000 | 22,000 | 2,070,600 |
| Percentage of all non-newborn hospital stays | 1.0% | 99.0% | 1.0% | 99.0% |
| Mean age | 8.1 | 6.7 | 8.1 | 6.5 |
| Female | 45.5% | 44.6% | 44.4% | 44.9% |
| Died in hospital | 3.0% | 0.3% | 3.9% | 0.4% |
| Percentage distribution of stays | ||||
| Payer | ||||
| Medicare | 0.1 | 0.3 | 0.1 | 0.3 |
| Medicaid | 37.0 | 48.5 | 29.0 | 37.9 |
| Private | 54.8 | 43.5 | 63.3 | 53.4 |
| Uninsured | 2.4 | 3.6 | 2.7 | 4.8 |
| Other | 5.3 | 3.9 | 4.4 | 3.2 |
| Utilization characteristics | ||||
| Mean length of stay, days | 12.0 | 3.8 | 10.7 | 3.8 |
| Mean hospital cost per stay | 40,400 | 8,100 | 29,700 | 6,200 |
| Mean daily hospital cost | 3,900 | 2,300 | 3,100 | 1,800 |
| Total aggregate costs for U.S. (in billions) | 0.9 | 16.4 | 0.6 | 12.2 |
| 1 Stays for children ages 0 through 17 (includes stays for children with missing age) 2 Excludes newborn stays Source: AHRQ, Center for Delivery, Organization, and Markets, Healthcare Cost and Utilization Project, Kids' Inpatient Database, 2000 and 2009 | ||||
Table 2 shows pediatric cancer hospitalization rates among patients by patient age, community income level, rural and urban areas, and across different regions of the United States. Rates of pediatric hospital stays for cancer and for all other reasons were higher for children ages 0 through 4 than among children in older age groups. There was no significant difference in hospitalization rates for pediatric cancer patients by community income level. However, for all other pediatric stays, rates were about 40 percent higher among patients from low income communities than among patients from communities that are not low income. There were no significant differences in pediatric cancer hospitalization rates by patient residence or region.
|
| Table 2. Characteristics of pediatric hospitalizations for cancer compared to hospitalizations of children for all other conditions, rates per 10,000 population, 20091 | ||||
| Hospital stays principally for cancer | All other hospital stays for children2 | |||
|---|---|---|---|---|
| Age group | ||||
| 0-4 | 35.4 | 4,500 | ||
| 5-9 | 24.9 | 1,700 | ||
| 10-14 | 23.5 | 1,800 | ||
| 15-17 | 29.9 | 2,600 | ||
| Median household income for patient's ZIP Code of residence | ||||
| Low | 26.4 | 3,400 | ||
| Not low | 28.2 | 2,400 | ||
| Patient residence | ||||
| Large central metro | 31.1 | 2,800 | ||
| Large fringe metro (suburbs) | 25.6 | 2,300 | ||
| Medium and small metro | 26.0 | 2,500 | ||
| Micropolitan and noncore (rural) | 25.3 | 3,000 | ||
| Region | ||||
| Northeast | 32.0 | 3,000 | ||
| Midwest | 26.1 | 2,700 | ||
| South | 26.7 | 2,800 | ||
| West | 31.0 | 2,400 | ||
| 1 Stays for children ages 0 through 17 (includes stays for children with missing age) 2 Excludes newborn stays Source: AHRQ, Center for Delivery, Organization, and Markets, Healthcare Cost and Utilization Project, Kids' Inpatient Database, 2000 and Claritas, 2009 |
||||
Trends in pediatric cancer hospitalizations
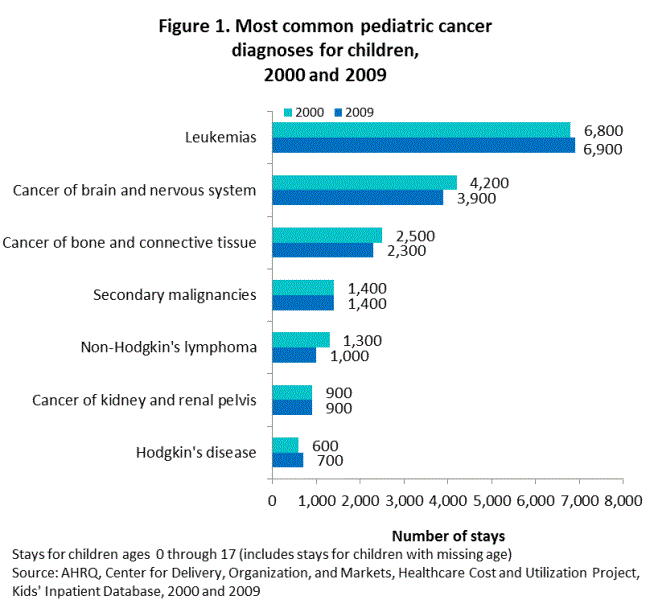
The most common pediatric cancer hospitalizations in 2009 were for the most common childhood cancers:4 leukemias, cancer of the brain and nervous system, and cancer of the bone and connective tissue (figure 1). From 2000 to 2009, pediatric hospitalizations for non-Hodgkin's lymphoma decreased by 23 percent, while stays for the other most common cancers remained stable. |
|
Figure 1. Most common pediatric cancer diagnoses for children, 2000 and 2009. Column bar chart; Stays for children, ages 0 through 17 (includes stays for children with missing age); Leukemias, 2000; number of stays, 6,800; 2009; number of stays, 6,900; Cancer of brain and nervous system, 2000; number of stays, 4,200; 2009; number of stays, 3,900; Cancer of bone and connective tissue, 2000; number of stays, 2,500; 2009; number of stays, 2,300; Secondary malignancies, 2000; number of stays, 1,400; 2009; number of stays, 1,400; Non-Hodgkin's lymphoma, 2000; number of stays, 1,300; 2009; number of stays, 1,000; Cancer of kidney and renal pelvis, 2000; number of stays, 900; 2009; number of stays, 900; Hodgkin's disease, 2000; number of stays, 600; 2009; number of stays, 700. Source: AHRQ, Center for Delivery, Organization, and Markets, Healthcare Costs and Utilization Project, Kids' Inpatient Database, 2000 and 2009. |
Cost and length of stay by cancer site
As shown in Table 3, aggregate costs for pediatric cancer hospitalizations were highest for leukemias ($385.8 million) and cancer of the brain and nervous system ($154.8 million). The most expensive cancer hospitalizations on a per-stay basis were for leukemias ($55,700 mean cost per stay) and non-Hodgkin's lymphoma ($46,900), largely because hospitalizations for these two cancers resulted in the longest average lengths of stay (17.4 days for leukemias and 12.8 days for non-Hodgkin's lymphoma). Cancer of the thyroid had the shortest average length of stay (2.5 days), but the highest average cost per hospital day ($4,100 per day), as this cancer is frequently treated by surgical removal of the thyroid (thyroidectomy).5 |
| Table 3. Characteristics of pediatric hospital stays with a principal diagnosis of cancer, 20091 | |||||
| Principal diagnosis | Number of discharges | Mean length of stay, days | Mean hospital cost | Total cost, in millions | |
|---|---|---|---|---|---|
| Per stay | Per day | ||||
| All pediatric stays with a principal diagnosis of cancer | 21,300 | 12.0 | $40,400 | $3,400 | $859.8 |
| Leukemias | 6,900 | 17.4 | $55,700 | $3,200 | $385.8 |
| Cancer of brain and nervous system | 3,900 | 10.9 | $39,600 | $3,600 | $154.8 |
| Cancer of bone and connective tissue | 2,300 | 7.8 | $28,700 | $3,700 | $65.2 |
| Cancer, other primary | 1,900 | 10.7 | $35,400 | $3,300 | $66.4 |
| Secondary malignancies | 1,400 | 7.0 | $23,000 | $3,300 | $31.9 |
| Non-Hodgkin's lymphoma | 1,000 | 12.8 | $46,900 | $3,700 | $48.1 |
| Cancer of kidney and renal pelvis | 900 | 9.1 | $28,900 | $3,200 | $26.8 |
| Hodgkin's disease | 700 | 8.8 | $28,400 | $3,200 | $18.5 |
| Cancer of thyroid | 500 | 2.5 | $10,100 | $4,100 | $5.1 |
| 1Stays for children ages 0 through 17 (includes stays for children with missing age) Source: AHRQ, Center for Delivery, Organization, and Markets, Healthcare Cost and Utilization Project, Kids' Inpatient Database, 2009 | |||||
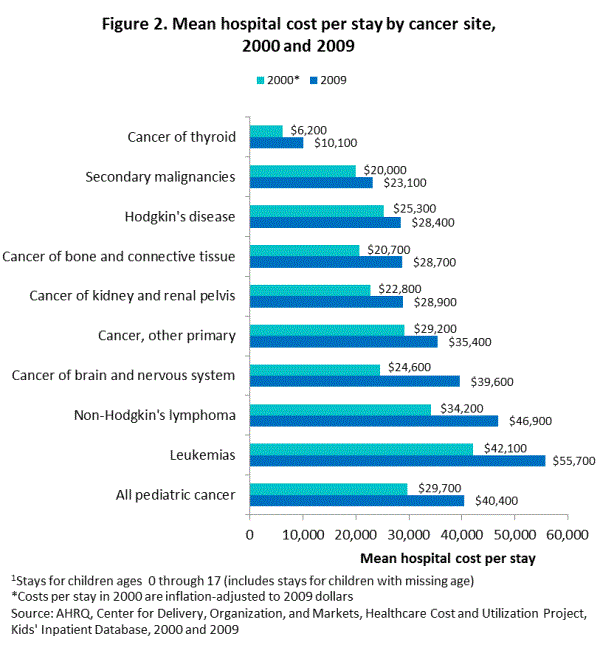
From 2000 to 2009, mean cost per stay for pediatric cancer hospitalizations rose 36 percent (figure 2). Mean cost per stay increased 63 percent for cancer of the thyroid and 61 percent for cancer of the brain and nervous system. Increases were more modest for cancer of the bone and connective tissue, non-Hodgkin's lymphoma, cancers of the kidney and renal pelvis, and leukemias. Increases in mean costs per stay were largely attributable to increases in mean cost per day, rather than increased length of hospital stay (data not shown).
|
|
Figure 2. Mean hospital cost per stay by cancer site, 2000* and 2009. Column bar chart; Stays for children, ages 0 through 17 (includes stays for children with missing age); Cancer of thyroid, 2000; number of stays, 6,200; 2009; number of stays,10,100; Secondary malignancies, 2000; number of stays, 20,000; 2009; number of stays, 23,100; Hodgkin's disease, 2000; number of stays, 25,300; 2009; number of stays, 28,400; Cancer of bone and connective tissue, 2000; number of stays, 20,700; 2009; number of stays, 28,700; Cancer of kidney and renal pelvis, 2000; number of stays, 22,800; 2009; number of stays, 28,900; Cancer, other primary; 2000; number of stays, 29,200; 2009; number of stays, 35,400; Cancer of brain and nervous system, 2000; number of stays, 24,600; 2009; number of stays, 39,600; Non-Hodgkin's lymphoma, 2000; number of stays, 34,200; 2009; number of stays, 46,900; Leukemias, 2000; number of stays, 42,100; 2009; number of stays, 55,700; All pediatric cancer; 2000 number of stays, 29,700; 2009; number of stays, 40,400. *Costs per stay in 2000 are inflation-adjusted to 2009 dollars; Source: AHRQ, Center for Delivery, Organization, and Markets, Healthcare Costs and Utilization Project, Kids' Inpatient Database, 2000 and 2009. |
Most common secondary cancer diagnoses
In addition to the 21,300 pediatric hospital stays with a principal diagnosis of cancer, 73,300 pediatric stays had a secondary diagnosis of cancer, in which patients were hospitalized with a principal diagnosis other than cancer. Pediatric stays with a secondary diagnosis of cancer cost $1 billion, bringing the total cost of cancer-related hospital stays among children to $1.9 billion. More than one-third (36.0 percent) of all stays with a secondary diagnosis of cancer were for leukemias, 21.0 percent were for cancer of the bone and connective tissue, 12.3 percent were for secondary malignancies, and 12.0 percent were for cancer of the brain and nervous system (Table 4). |
| Table 4. Most frequent secondary cancer diagnoses among pediatric stays, 20091 | ||
| All-listed diagnosis | Number of stays | Percentage distribution |
|---|---|---|
| All pediatrics stays with a secondary diagnosis of cancer | 73,300 | 100.0% |
| Leukemias | 26,400 | 36.0% |
| Cancer of bone and connective tissue | 15,400 | 21.0% |
| Secondary malignancies | 9,100 | 12.3% |
| Cancer of brain and nervous system | 8,800 | 12.0% |
| Cancer; other and unspecified primary | 8,300 | 11.3% |
| Non-Hodgkin's lymphoma | 4,400 | 6.1% |
| Cancer of kidney and renal pelvis | 2,700 | 3.7% |
| Hodgkin's disease | 2,200 | 3.0% |
| Cancer of liver and intrahepatic bile duct | 1,500 | 2.0% |
| Cancer of head and neck | 800 | 1.1% |
| Malignant neoplasm without specification of site | 700 | 1.0% |
| 1Stays for children ages 0 through 17 (includes stays for children with missing age) Source: AHRQ, Center for Delivery, Organization, and Markets, Healthcare Cost and Utilization Project, Kids' Inpatient Database, 2009 | ||
Most common principal reasons for pediatric hospitalizations with cancer as a secondary diagnosis
Almost half (48.2 percent) of pediatric hospital stays with a secondary diagnosis of cancer had a principal diagnosis of maintenance chemotherapy or radiotherapy (Table 5). Another 15.1 percent of secondary cancer stays had a principal diagnosis of diseases of white blood cells. Approximately 5.7 percent of all stays with a secondary diagnosis of cancer had a principal diagnosis of a treatment-related complication: complication of devices, implants or grafts (4.4 percent) or complication of surgical procedures or medical care (1.3 percent). Other common principal diagnoses included fever of unknown origin (3.4 percent of cancer-related stays) and septicemia (2.5 percent). |
| Table 5. Most frequent principal diagnoses among pediatric stays with secondary cancer diagnoses, 20091 | ||
| Principal diagnosis | Number of stays | Percentage distribution |
|---|---|---|
| All pediatrics stays with a secondary diagnosis of cancer | 73,300 | 100.0% |
| Maintenance chemotherapy, radiotherapy | 35,300 | 48.2% |
| Diseases of white blood cells | 11,100 | 15.1% |
| Complication of device; implant or graft | 3,200 | 4.4% |
| Fever of unknown origin | 2,500 | 3.4% |
| Septicemia | 1,900 | 2.5% |
| Pneumonia | 1,200 | 1.7% |
| Fluid and electrolyte disorders | 1,200 | 1.6% |
| Deficiency and other anemia | 1,100 | 1.5% |
| Complications of surgical procedures or medical care | 900 | 1.3% |
| Viral infection | 900 | 1.2% |
| Influenza | 800 | 1.1% |
| Epilepsy, convulsions | 800 | 1.1% |
| 1Stays for children ages 0 through 17 (includes stays for children with missing age) Source: AHRQ, Center for Delivery, Organization, and Markets, Healthcare Cost and Utilization Project, Kids' Inpatient Database, 2009 | ||
Data Source The estimates in this Statistical Brief are based on data from the HCUP KID 2009. Historical data were drawn from the 2000 KID. Supplemental sources included data from the 2009 Claritas Age by Income and Sex by Income, Region, and Residence. https://www.claritas.com.Definitions Diagnoses, ICD-9-CM, and Clinical Classifications Software (CCS)The principal diagnosis is that condition established after study to be chiefly responsible for the patient's admission to the hospital. Secondary diagnoses are concomitant conditions that coexist at the time of admission or that develop during the stay. ICD-9-CM is the International Classification of Diseases, Ninth Revision, Clinical Modification, which assigns numeric codes to diagnoses. There are about 14,000 ICD-9-CM diagnosis codes. CCS categorizes ICD-9-CM diagnoses into a manageable number of clinically meaningful categories.6 This "clinical grouper" makes it easier to quickly understand patterns of diagnoses and procedures. CCS categories identified as "Other" are typically not reported; these categories include miscellaneous, otherwise unclassifiable diagnoses that may be difficult to interpret as a group. Case definition For this report, hospitalizations for cancer were defined as those with a principal diagnosis of CCS 11-43. Types of hospitals included in HCUP HCUP is based on data from community hospitals, defined as short-term, non-Federal, general and other hospitals, excluding hospital units of other institutions (e.g., prisons). HCUP data include obstetrics and gynecology, otolaryngology, orthopedic, cancer, pediatric, public, and academic medical hospitals. Excluded are long-term care, rehabilitation, psychiatric, and alcoholism and chemical dependency hospitals. However, if a patient received long-term care, rehabilitation, or treatment for psychiatric or chemical dependency conditions in a community hospital, the discharge record for that stay will be included in the NIS. Unit of analysis The unit of analysis is the hospital discharge (i.e., the hospital stay), not a person or patient. This means that a person who is admitted to the hospital multiple times in one year will be counted each time as a separate "discharge" from the hospital. Costs and charges Total hospital charges were converted to costs using HCUP Cost-to-Charge Ratios based on hospital accounting reports from the Centers for Medicare & Medicaid Services (CMS).7 Costs reflect the actual expenses incurred in the production of hospital services, such as wages, supplies, and utility costs; while charges represent the amount a hospital billed for the case. For each hospital, a hospital-wide cost-to-charge ratio is used. Hospital charges reflect the amount the hospital billed for the entire hospital stay and do not include professional (physician) fees. For the purposes of this Statistical Brief, costs are reported to the nearest hundred. Location of patients' residence Place of residence is based on the urban-rural classification scheme for U.S. counties developed by the National Center for Health Statistics (NCHS). For this Statistical Brief, we collapsed the NCHS categories into either urban or rural according to the following: Urban:
Median community-level income is the median household income of the patient's ZIP Code of residence. The cut-offs for the quartile designation are determined using ZIP Code demographic data obtained from Claritas. The income quartile is missing for homeless and foreign patients. Payer Payer is the expected primary payer for the hospital stay. To make coding uniform across all HCUP data sources, payer combines detailed categories into more general groups:
Region Region is one of the four regions defined by the U.S. Census Bureau:
Discharge status indicates the disposition of the patient at discharge from the hospital and includes the following six categories: routine (to home); transfer to another short-term hospital; other transfers (including skilled nursing facility, intermediate care, and another type of facility such as a nursing home); home healthcare; against medical advice (AMA); or died in the hospital. About HCUP HCUP is a family of powerful healthcare databases, software tools, and products for advancing research. Sponsored by the Agency for Healthcare Research and Quality (AHRQ), HCUP includes the largest all-payer encounter-level collection of longitudinal healthcare data (inpatient, ambulatory surgery, and emergency department) in the United States, beginning in 1988. HCUP is a Federal-State-Industry Partnership that brings together the data collection efforts of many organizations—such as State data organizations, hospital associations, private data organizations, and the Federal government—to create a national information resource. HCUP would not be possible without the contributions of the following data collection Partners from across the United States: Alaska State Hospital and Nursing Home Association (ASHNA) Arizona Department of Health Services Arkansas Department of Health California Office of Statewide Health Planning and Development Colorado Hospital Association Connecticut Hospital Association Florida Agency for Health Care Administration Georgia Hospital Association Hawaii Health Information Corporation Illinois Department of Public Health Indiana Hospital Association Iowa Hospital Association Kansas Hospital Association Kentucky Cabinet for Health and Family Services Louisiana Department of Health and Hospitals Maine Health Data Organization Maryland Health Services Cost Review Commission Massachusetts Division of Health Care Finance and Policy Michigan Health & Hospital Association Minnesota Hospital Association Mississippi Department of Health Missouri Hospital Industry Data Institute Montana MHA — An Association of Montana Health Care Providers Nebraska Hospital Association Nevada Department of Health and Human Services New Hampshire Department of Health & Human Services New Jersey Department of Health New Mexico Department of Health New York State Department of Health North Carolina Department of Health and Human Services Ohio Hospital Association Oklahoma State Department of Health Oregon Association of Hospitals and Health Systems Oregon Health Policy and Research Pennsylvania Health Care Cost Containment Council Rhode Island Department of Health South Carolina State Budget & Control Board South Dakota Association of Healthcare Organizations Tennessee Hospital Association Texas Department of State Health Services Utah Department of Health Vermont Association of Hospitals and Health Systems Virginia Health Information Washington State Department of Health West Virginia Health Care Authority Wisconsin Department of Health Services Wyoming Hospital Association About the KID The HCUP Kids' Inpatient Database (KID) is a nationwide database of hospital inpatient stays. The KID is the only dataset on hospital use, outcomes, and charges designed to study children's use of hospital services in the United States. The KID is a sample of discharges from all community, nonrehabilitation hospitals in States participating in HCUP. The target universe includes pediatric discharges from community, nonrehabilitation hospitals in the United States. Pediatric discharges are defined as all discharges where the patient was age 20 or younger at admission. [For the 1997 KID, hospital discharges for patients aged 18 years or younger were included in the database.] The KID's large sample size enables analyses of rare conditions, such as congenital anomalies and uncommon treatments, such as organ transplantation. It can be used to study a wide range of topics including the economic burden of pediatric conditions, access to services, quality of care and patient safety, and the impact of health policy changes. The KID is produced every three years; prior databases are available for 1997, 2000, 2003, 2006, and 2009. For More Information For more information about HCUP, visit https://datatools.ahrq.gov/hcupnet. For additional HCUP statistics, visit HCUPnet, our interactive query system, at https://datatools.ahrq.gov/hcupnet. For information on other hospitalizations in the U.S., download HCUP Facts and Figures: Statistics on Hospital-Based Care in the United States in 2008, located at http://www.hcup-us.ahrq.gov/reports.jsp. For a detailed description of HCUP, more information on the design of the NIS, and methods to calculate estimates, please refer to the following publications: Introduction to the HCUP Nationwide Inpatient Sample, 2009. Online. May 2011. U.S. Agency for Healthcare Research and Quality. Available at http://www.hcup-us.ahrq.gov/db/nation/nis/NIS_2009_INTRODUCTION.pdf . (Accessed April 30, 2012). Houchens, R., Elixhauser, A. Using the HCUP Nationwide Inpatient Sample to Estimate Trends. (Updated for 1988-2004).. HCUP Methods Series Report #2006-05. Online. August 18, 2006. U.S. Agency for Healthcare Research and Quality. Available at http://www.hcup-us.ahrq.gov/reports/methods/2006_05_NISTrendsReport_1988-2004.pdf. (Accessed April 30, 2012). Suggested Citation Anhang Price, R. (RAND), Stranges, E. (Thomson Reuters) and Elixhauser, A. (Agency for Healthcare Research and Quality). Pediatric Cancer Hospitalizations, 2009. HCUP Statistical Brief #132. May 2012. Agency for Healthcare Research and Quality. Rockville, MD. http://www.hcup-us.ahrq.gov/reports/statbriefs/sb132.pdf. Acknowledgements The authors would like to acknowledge Mika Nagamine, Natalia Coenen, and Lindsey Terrel for their assistance with this Brief. *** AHRQ welcomes questions and comments from readers of this publication who are interested in obtaining more information about access, cost, use, financing, and quality of healthcare in the United States. We also invite you to tell us how you are using this Statistical Brief and other HCUP data and tools, and to share suggestions on how HCUP products might be enhanced to further meet your needs. Please e-mail us at hcup@ahrq.gov or send a letter to the address below:Irene Fraser, Ph.D., Director Center for Delivery, Organization, and Markets Agency for Healthcare Research and Quality 540 Gaither Road Rockville, MD 20850 1 American Cancer Society. Cancer Facts & Figures, 2012. Atlanta, GA: American Cancer Society. 2 Smith MA, Seibel NL, Altekruse SF, et al. Outcomes for children and adolescents with cancer: challenges for the twenty-first century. J Clin Oncol. May 20 2010;28(15):2625-2634. 3 The number and cost of newborn stays were excluded from the totals provided here. Newborn stays were also excluded from the data presented in Tables 1 and 2. 4 Siegel R, Ward E, Brawley O, Jemal A. Cancer statistics, 2011: The impact of eliminating socioeconomic and racial disparities on premature cancer deaths. CA Cancer J Clin. Jul-Aug 2011;61(4):212-236. 5 Dinauer, C. A., C. Breuer, et al. (2008). "Differentiated thyroid cancer in children: diagnosis and management." Current Opinion in Oncology 20(1): 59-65. 6 Healthcare Cost and Utilization Project (HCUP). 2001-2008. HCUP Cost-to-Charge Ratio Files (CCR). U.S. Agency for Healthcare Research and Quality, Rockville, MD. Updated March 2012 www.hcup-us.ahrq.gov/db/state/costtocharge.jsp. (Accessed April 30, 2012) 7 Healthcare Cost and Utilization Project (HCUP). 2001-2008. HCUP Cost-to-Charge Ratio Files (CCR). U.S. Agency for Healthcare Research and Quality, Rockville, MD. Updated March 2012 www.hcup-us.ahrq.gov/db/state/costtocharge.jsp. (Accessed April 30, 2012) |