STATISTICAL BRIEF #138 |
July 2012
Lauren M. Wier, M.P.H. and William Encinosa, Ph.D. Introduction Child obesity is an increasing concern in the United States. A high caloric diet and not enough physical activity are the underlying causes of childhood obesity.1 Overweight children have a higher risk of developing high cholesterol, hypertension, respiratory ailments, orthopedic problems, depression, and type II diabetes.2 Health care spending related to obesity is reaching $150 billion dollars annually, with nearly one-third of American children being classified as obese or overweight.3 Childhood obesity increased 178 percent between 1971 and 2000, and obesity levels have continued to rise. Between 2000 and 2008, childhood obesity increased 22 percent.1 In this Statistical Brief, we will examine what impact this childhood obesity epidemic has had on childhood hospitalizations in the United States between 2000 and 2009. This Statistical Brief presents data from the Healthcare Cost and Utilization Project (HCUP) on hospital stays for obesity among children ages 1 to 17 years in 2000 and 2009. Descriptive analyses were performed on the HCUP Kids' Inpatient Database (KID), which is created every three years. Characteristics of stays such as patient age, sex, expected payer, and geographic differences are examined. Additionally, the most common principal diagnoses and the most common procedures for hospital stays for child obesity are identified. All differences between estimates noted in the text are statistically significant at the .01 level or better. Findings General findings In 2009, there were about 38,000 hospital stays with a diagnosis of obesity for children ages 1 to 17 years in the United States, comprising 2.1 percent of all hospitalizations among this age group (table 1). From 2000 to 2009, the rate of hospitalizations with obesity more than doubled (from 2.4 to 5.4 stays per 10,000 children), whereas the rate of hospital stays without any mention of obesity on the record remained relatively stable (262.0 and 249.7 stays per 10,000 children in 2000 and 2009, respectively). In both 2000 and 2009, hospitalizations with a diagnosis of obesity had a longer average length of stay and higher mean costs per stay. Moreover, there was a sizable growth in the costs of obesity. In 2000, the average cost of an obesity-related hospital stay was 20 percent higher than a stay with no mention of obesity ($7,200 versus $6,000). But, in 2009, the average cost of an obesity-related hospital stay was 24 percent higher than a stay without obesity ($9,900 versus $8,000). From 2000 to 2009, the rate of stays with obesity on the record more than doubled among children age 5—9 years (up 124 percent), 10—14 years (up 114 percent), and 15—17 years (up 139 percent). During this same period, the rate of stays with obesity increased in all four regions, more than doubling in the Midwest, Northeast, and West. |
|
| Table 1. Characteristics of hospital stays for children ages 1 to 17 years, with and without an all-listed diagnosis of obesity, 2000 and 2009 | ||||||
| 2000 | 2009 | Percentage change 2000-2009 | ||||
|---|---|---|---|---|---|---|
| Obesity§ | No Obesity | Obesity§ | No Obesity | Obesity§ | No Obesity | |
| Number of discharges | 16,700 | 1,795,500 | 38,000 | 1,755,100 | 128% | -2% |
| Rate of discharges (per 10,000) | 2.4 | 262.0 | 5.4 | 249.7 | 122% | -5% |
| Female (percentage) | 54 | 52 | 55 | 50 | 2% | -3% |
| Length of stay, mean (in days) | 5.6 | 3.8 | 5.3 | 3.8 | -6% | 1% |
| Costs, mean | $7,200 | $6,000 | $9,900 | $8,000 | 38% | 34% |
| Age (per 10,000) | ||||||
| 1-4 years | 0.5 | 353.1 | 0.9 | 330.6 | 89% | -6% |
| 5-9 years | 1.0 | 169.2 | 2.3 | 171.5 | 124% | 1% |
| 10-14 years | 3.3 | 187.0 | 7.2 | 179.3 | 114% | -4% |
| 15-17 years | 5.7 | 431.8 | 13.7 | 379.2 | 139% | -12% |
| Region (per 10,000) | ||||||
| Northeast | 2.3 | 302.9 | 5.6 | 275.6 | 140% | -9% |
| Midwest | 2.5 | 220.1 | 5.7 | 253.5 | 128% | 15% |
| South | 2.6 | 275.7 | 5.1 | 255.0 | 92% | -8% |
| West | 2.1 | 251.1 | 5.5 | 220.5 | 156% | -12% |
| Income (percentage) | ||||||
| Quartile 1 (lowest) | 14.4 | 11.1 | 36.5 | 31.8 | 153% | 186% |
| Quartile 2 | 35.2 | 31.0 | 25.7 | 24.9 | -27% | -20% |
| Quartile 3 | 26.4 | 26.8 | 21.4 | 21.9 | -19% | -18% |
| Quartile 4 (highest) | 21.7 | 29.1 | 13.4 | 18.9 | -38% | -35% |
| Source: AHRQ, Center for Delivery, Organization, and Markets, Healthcare Cost and Utilization Project, Kids' Inpatient Database (KID), 2000 and 2009 Rates calculated using resident population for July 2000 and 2009 from the U.S. Bureau of the Census. https://www.census.gov/programs-surveys/popest/data/data-sets.2000.html. §Based on all-listed diagnoses. Costs were adjusted for inflation using the GDP deflator (https://www.bea.gov/iTable/iTable.cfm?reqid=19&step=2#reqid=19&step=3&isuri=1&1921=survey&1903=4, Table 1.1.4. Price Indexes for Gross Domestic Product). |
||||||
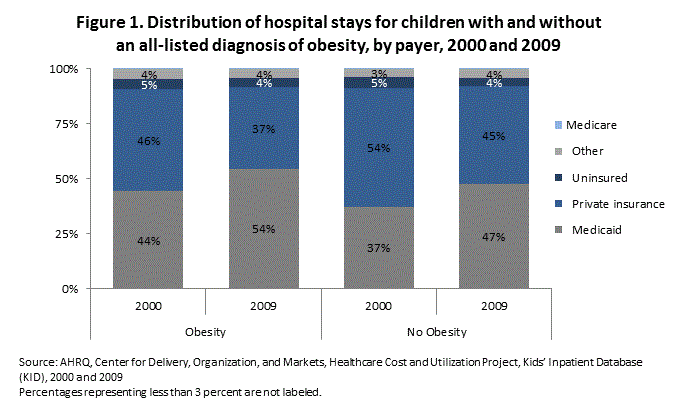
Distribution by payer Figure 1 shows the distribution of children's hospitalizations with and without a diagnosis of obesity by primary expected payer, comparing 2000 to 2009. Approximately 46 percent of obesity-related hospital stays for children ages 1 to 17 years were covered by private insurance in 2000, but by 2009 this decreased to 37 percent. Medicaid was the expected payer for 44 percent of all obesity-related hospital stays in 2000, but this increased to 54 percent in 2009. A similar shift in coverage was seen for nonobesity-related stays during this time period. In both 2000 and 2009, Medicaid covered a larger proportion of hospital stays for children with an all-listed diagnosis of obesity, relative to stays without an obesity diagnosis (54 versus 47 percent in 2009). There were no differences between 2000 and 2009 in the percentage of hospitalized children with or without a diagnosis of obesity who were uninsured or covered by "other" payers such as other State government programs. |
|
Figure 1. Distribution of hospital stays for children with and without an all-listed diagnosis of obesity, by payer, 2000 and 2009. Stacked column bar chart; Obesity, 2000, Medicare, N/A; Other, 4%; Uninsured, 5%; Private insurance, 46%; Medicaid, 44%; Obesity, 2009, Medicare, N/A; Other, 4%; Uninsured, 4%; Private insurance, 37%; Medicaid, 54%; No Obesity, 2000, Medicare, N/A; Other, 3%; Uninsured, 5%; Private insurance, 54%; Medicaid, 37%; No Obesity, 2009, Medicare, N/A; Other, 4%; Uninsured, 4%; Private insurance, 45%; Medicaid, 47%; Source: AHRQ, Center for Delivery, Organization, and Markets, Healthcare Cost and Utilization Project, Kids" Inpatient Database (KID), 2000 and 2009. Percentages representing less than 3 percent are not labeled. |
Conditions related to obesity Table 2 lists principal diagnoses for those hospital stays where obesity was a secondary diagnosis or a coexisting condition. These 10 conditions accounted for 46.4 percent of all hospital stays that included obesity as a secondary diagnosis in 2009. These same 10 conditions accounted for only one-third (33.7 percent) of nonobesity stays. The most common principal diagnosis was mood disorders, which accounted for 15.9 percent of all patients, ages 1 to 17 years, with obesity. This was more than three times as frequent as the nonobese hospitalized population. Another mental health condition—attention-deficit, conduct, and disruptive behavior disorders—was in the top 10 diagnoses and was more common among obese patients. Two infections appeared in the top 10 conditions: pneumonia and skin infections. Skin infections were seen in about 3 percent of stays with and without mention of obesity. Pneumonia was less frequent among stays with a secondary diagnosis of obesity (3.5 percent), relative to stays with no mention of obesity (7.5 percent). Asthma, diabetes (with and without complications), biliary tract disease, and epilepsy were also top 10 conditions for patients with obesity as a secondary diagnosis. |
| Table 2. Principal diagnosis for hospital stays with a secondary diagnosis of obesity, 2009 | |||
| Principal diagnosis | Number of stays with obesity as a secondary diagnosis | Percentage of stays with this principal diagnosis among stays with: | |
|---|---|---|---|
| Obesity as a secondary diagnosis | No mention of obesity | ||
| Mood disorders | 6,060 | 15.9 | 5.1 |
| Asthma | 3,130 | 8.2 | 7.1 |
| Appendicitis and other appendiceal conditions | 1,820 | 4.8 | 4.7 |
| Pneumonia | 1,350 | 3.5 | 7.5 |
| Skin and subcutaneous tissue infections | 1,210 | 3.2 | 3.4 |
| Biliary tract disease | 1,080 | 2.8 | 0.4 |
| Diabetes mellitus with complications | 1,080 | 2.8 | 1.3 |
| Diabetes mellitus without complication | 700 | 1.8 | 0.4 |
| Epilepsy; convulsions | 610 | 1.6 | 3.4 |
| Attention-deficit, conduct, and disruptive behavior disorders | 610 | 1.6 | 0.8 |
| Source: AHRQ, Center for Delivery, Organization, and Markets, Healthcare Cost and Utilization Project, Kids' Inpatient Database (KID), 2009 | |||
Procedures related to obesity Table 3 lists the most common all-listed procedures for which obesity was a secondary diagnosis. Among hospital stays, the types of procedures were varied. For example, the most commonly received procedures were appendectomy (5.1 percent of stays), respiratory intubation and mechanical ventilation (3.2 percent of stays), and cholecystectomy and common duct exploration (nearly 3 percent of stays). Three of the top 10 procedures were related to childbirth: cesarean section, repair of current obstetric laceration, and artificial rupture of membranes to assist in delivery. In 2009, there were about 250 bariatric procedures4 performed during stays with a diagnosis of obesity (data not shown). |
| Table 3. Most common all-listed procedures for hospital stays with obesity as a secondary diagnosis, 2009 | |||
| All-listed procedure | Number of stays with obesity as a secondary diagnosis | Percentage of stays with this procedure among stays with: | |
|---|---|---|---|
| Obesity as a secondary diagnosis | No mention of obesity | ||
| Appendectomy | 1,920 | 5.1 | 4.8 |
| Respiratory intubation and mechanical ventilation | 1,210 | 3.2 | 2.3 |
| Cholecystectomy and common duct exploration | 1,070 | 2.8 | 0.4 |
| Blood transfusion | 1,010 | 2.7 | 3.4 |
| Cesarean section | 890 | 2.3 | 1.6 |
| Diagnostic spinal tap | 800 | 2.1 | 1.9 |
| Repair of current obstetric laceration | 770 | 2.0 | 3.1 |
| Treatment; fracture or dislocation of hip and femur | 770 | 2.0 | 1.0 |
| Tonsillectomy and/or adenoidectomy | 730 | 1.9 | 0.9 |
| Artificial rupture of membranes to assist delivery | 600 | 1.6 | 2.0 |
| Source: AHRQ, Center for Delivery, Organization, and Markets, Healthcare Cost and Utilization Project, Kids' Inpatient Database (KID), 2009 | |||
Data Source
The estimates in this Statistical Brief are based upon data from the HCUP Kids' Inpatient Database for 2009 and 2000. Supplemental sources included data on regional population estimates from "Table 1: Annual Estimates of the Resident Population for the United States, Regions, States, and Puerto Rico: April 1, 2000 to July 1, 2009 (NST-EST2009-01)," Population Division, U.S. Census Bureau, Release date: December 2009 (https://www.census.gov/programs-surveys/popest/data/data-sets.2000.html). Definitions Diagnoses, ICD-9-CM, and Clinical Classifications Software (CCS) The principal diagnosis is that condition established after study to be chiefly responsible for the patient"s admission to the hospital. Secondary diagnoses are concomitant conditions that coexist at the time of admission or that develop during the stay. ICD-9-CM is the International Classification of Diseases, Ninth Revision, Clinical Modification, which assigns numeric codes to diagnoses. There are about 14,000 ICD-9-CM diagnosis codes. CCS categorizes ICD-9-CM diagnoses into a manageable number of clinically meaningful categories.5 This "clinical grouper" makes it easier to quickly understand patterns of diagnoses and procedures. CCS categories identified as "Other" are typically not reported; these categories include miscellaneous, otherwise unclassifiable diagnoses and procedures that may be difficult to interpret as a group. Case definition The ICD-9-CM codes defining obesity include diagnosis codes in the following range: 278.00 and 278.01. Types of hospitals included in HCUP HCUP is based on data from community hospitals, defined as short-term, non-Federal, general, and other hospitals, excluding hospital units of other institutions (e.g., prisons). HCUP data include obstetrics and gynecology, otolaryngology, orthopedic, cancer, pediatric, public, and academic medical hospitals. Excluded are long-term care, rehabilitation, psychiatric, and alcoholism and chemical dependency hospitals. However, if a patient received long-term care, rehabilitation, or treatment for psychiatric or chemical dependency conditions in a community hospital, the discharge record for that stay will be included in the NIS. Unit of analysis The unit of analysis is the hospital discharge (i.e., the hospital stay), not a person or patient. This means that a person who is admitted to the hospital multiple times in one year will be counted each time as a separate "discharge" from the hospital. Costs and charges Total hospital charges were converted to costs using HCUP Cost-to-Charge Ratios based on hospital accounting reports from the Centers for Medicare & Medicaid Services (CMS).6 Costs will reflect the actual expenses incurred in the production of hospital services, such as wages, supplies, and utility costs; charges represent the amount a hospital billed for the case. For each hospital, a hospital-wide cost-to-charge ratio is used. Hospital charges reflect the amount the hospital billed for the entire hospital stay and do not include professional (physician) fees. For the purposes of this Statistical Brief, costs are reported to the nearest hundred. Median community-level income Median community-level income is the median household income of the patient"s ZIP Code of residence. The cut-offs for the quartile designation are determined using ZIP Code demographic data obtained from Claritas. The income quartile is missing for homeless and foreign patients. Payer Payer is the expected primary payer for the hospital stay. To make coding uniform across all HCUP data sources, payer combines detailed categories into more general groups:
Region Region is one of the four regions defined by the U.S. Census Bureau:
HCUP is a family of powerful healthcare databases, software tools, and products for advancing research. Sponsored by the Agency for Healthcare Research and Quality (AHRQ), HCUP includes the largest all-payer encounter-level collection of longitudinal healthcare data (inpatient, ambulatory surgery, and emergency department) in the United States, beginning in 1988. HCUP is a Federal-State-Industry Partnership that brings together the data collection efforts of many organizations—such as State data organizations, hospital associations, private data organizations, and the Federal government—to create a national information resource. HCUP would not be possible without the contributions of the following data collection Partners from across the United States: Alaska State Hospital and Nursing Home Association Arizona Department of Health Services Arkansas Department of Health California Office of Statewide Health Planning and Development Colorado Hospital Association Connecticut Hospital Association Florida Agency for Health Care Administration Georgia Hospital Association Hawaii Health Information Corporation Illinois Department of Public Health Indiana Hospital Association Iowa Hospital Association Kansas Hospital Association Kentucky Cabinet for Health and Family Services Louisiana Department of Health and Hospitals Maine Health Data Organization Maryland Health Services Cost Review Commission Massachusetts Division of Health Care Finance and Policy Michigan Health & Hospital Association Minnesota Hospital Association Mississippi Department of Health Missouri Hospital Industry Data Institute Montana MHA - An Association of Montana Health Care Providers Nebraska Hospital Association Nevada Department of Health and Human Services New Hampshire Department of Health & Human Services New Jersey Department of Health New Mexico Department of Health New York State Department of Health North Carolina Department of Health and Human Services Ohio Hospital Association Oklahoma State Department of Health Oregon Association of Hospitals and Health Systems Oregon Health Policy and Research Pennsylvania Health Care Cost Containment Council Rhode Island Department of Health South Carolina State Budget & Control Board South Dakota Association of Healthcare Organizations Tennessee Hospital Association Texas Department of State Health Services Utah Department of Health Vermont Association of Hospitals and Health Systems Virginia Health Information Washington State Department of Health West Virginia Health Care Authority Wisconsin Department of Health Services Wyoming Hospital Association About the KID The HCUP Kids' Inpatient Database (KID) is a nationwide database of hospital inpatient stays. The KID is the only dataset on hospital use, outcomes, and charges designed to study children"s use of hospital services in the United States. The KID is a sample of discharges from all community, nonrehabilitation hospitals in States participating in HCUP. The target universe includes pediatric discharges from community, nonrehabilitation hospitals in the United States. Pediatric discharges are defined as all discharges where the patient was age 20 or younger at admission. The KID's large sample size enables analyses of rare conditions, such as congenital anomalies and uncommon treatments, such as organ transplantation. It can be used to study a wide range of topics including the economic burden of pediatric conditions, access to services, quality of care and patient safety, and the impact of health policy changes. The KID is produced every three years; prior databases are available for 1997, 2000, 2003, 2006, and 2009. For More Information For more information about HCUP, visit http://www.hcup-us.ahrq.gov. For additional HCUP statistics, visit HCUPnet, our interactive query system, at https://datatools.ahrq.gov/hcupnet. For information on other hospitalizations in the U.S., download HCUP Facts and Figures: Statistics on Hospital-Based Care in the United States in 2009, located at http://www.hcup-us.ahrq.gov/reports.jsp. For a detailed description of HCUP, more information on the design of the KID, and methods to calculate estimates, please refer to the following publications: Introduction to the HCUP Kids' Inpatient Database, 2009. Online. June 2011. U.S. Agency for Healthcare Research and Quality. Available at: http://www.hcup-us.ahrq.gov/db/nation/kid/KID_2009_Introduction.pdf (Accessed June 28, 2012). Calculating Kids" Inpatient Database Variances. HCUP Methods Series Report #2005-5. Online. December 16, 2005. U.S. Agency for Healthcare Research and Quality. Available at http://www.hcup-us.ahrq.gov/db/nation/kid/reports/CalculatingKIDVariances.pdf (Accessed June 28, 2012). Suggested Citation Wier LM (Truven Health Analytics), Encinosa W (AHRQ). Obesity in Children: Hospitalizations from 2000 to 2009. HCUP Statistical Brief #138. July 2012. Agency for Healthcare Research and Quality, Rockville, MD. Available at http://www.hcup-us.ahrq.gov/reports/statbriefs/sb138.pdf. Acknowledgements The authors would like to acknowledge Nils Nordstrand for programming assistance. *** AHRQ welcomes questions and comments from readers of this publication who are interested in obtaining more information about access, cost, use, financing, and quality of healthcare in the United States. We also invite you to tell us how you are using this Statistical Brief and other HCUP data and tools, and to share suggestions on how HCUP products might be enhanced to further meet your needs. Please e-mail us at hcup@ahrq.gov or send a letter to the address below:Irene Fraser, Ph.D., Director Center for Delivery, Organization, and Markets Agency for Healthcare Research and Quality 540 Gaither Road Rockville, MD 20850 1 Centers for Disease Control and Prevention. Overweight and Obesity. Available at www.cdc.gov/obesity/childhood/causes.html. (Accessed June 28, 2012). 2 Assistant Secretary for Planning and Evaluation Childhood Obesity. Available at http://aspe.hhs.gov/health/reports/child_obesity. (Accessed June 28, 2012). 3 National Conference of State Legislatures. Childhood Obesity - 2009 Update of Legislative Policy Options. Available at http://www.ncsl.org/default.aspx?tabid=19776. (Accessed June 28, 2012). 4 Defined by Diagnosis Related Group (DRG) 619, 620, or 621. 5 HCUP Clinical Classifications Software (CCS). Healthcare Cost and Utilization Project (HCUP). U.S. Agency for Healthcare Research and Quality, Rockville, MD. Available at http://www.hcup-us.ahrq.gov/toolssoftware/ccs/ccs.jsp. Updated March 2012. (Accessed June 28, 2012). 6 HCUP Cost-to-Charge Ratio Files (CCR). Healthcare Cost and Utilization Project (HCUP). 2001-2008. U.S. Agency for Healthcare Research and Quality, Rockville, MD. Available at http://www.hcup-us.ahrq.gov/db/state/costtocharge.jsp. Updated August 2011. (Accessed June 28, 2012). |