STATISTICAL BRIEF #14
|
|
October 2006
Mika Nagamine, Ph.D., H. Joanna Jiang, Ph.D., Chaya T. Merrill, M.P.H.
Introduction The elderly population in the U.S. is projected to more than double from approximately 35 million in 2000 (12 percent of the U.S. pop-ulation) to an estimated 71 million in 2030 (20 percent of the U.S. population).1 As the American population continues to age, the demand for hospital care will increase rapidly since elderly indivi-duals are at high risk for costly, age-associated chronic diseases and other health conditions. This Statistical Brief presents data from the Healthcare Cost and Utilization Project (HCUP) summarizing information about hospital stays for elderly individuals, age 65 and older, from 1997 to 2004. Specifically, this brief notes the most frequent reasons for hospi-talizations among older patients, with a focused look at the char-acteristics of six select health conditions: congestive heart failure, pneumonia, acute myocardial infarction (heart attack), chronic obstructive pulmonary disease, acute cerebrovascular disease (stroke), and osteoarthritis. These conditions were selected based on volume as well as relevance to the priority conditions identified by the Department of Health and Human Services for research under the Medicare Modernization Act.2 All differences between estimates provided in the text are statistically significant at the 0.05 level or better. Findings From 1997 to 2004, elderly individuals represented approximately 12 percent of the U.S. population each year;3 however, this age group accounted for about 35 percent of hospital stays annually. Table 1 describes the general characteristics of hospitalizations among the elderly from 1997 to 2004. The average hospital costs for these stays increased by over 25 percent–from $7,800 per stay in 1997 to $9,800 per stay in 2004(after adjusting for inflation).4 While costs increased, the average length of stay (ALOS) decreased by just under one day (from 6.4 days in 1997 to 5.7 days in 2004). Across the years, many of these stays were complicated by chronic coexisting conditions, such as diabetes and hypertension; on average, each hospitalization for elderly individuals contained two comorbidities. In addition, from 1997 to 2004, an increasingly large proportion of hospitalizations for the elderly were admitted through the emergency department (ED)–a rise of 18 percent (49 percent in 1997 to 57 percent in 2004). |
|
Most frequent reasons for hospitalization among elderly individuals
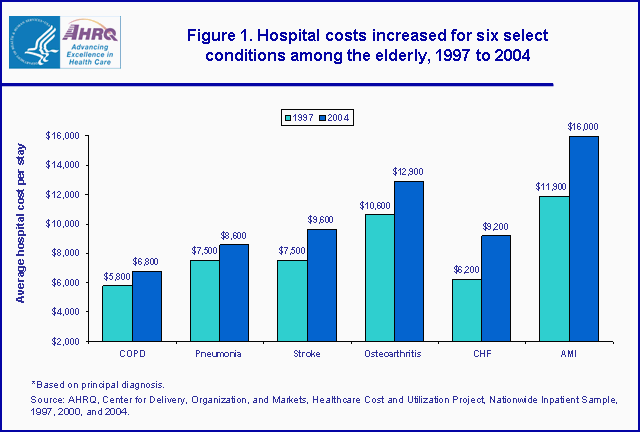
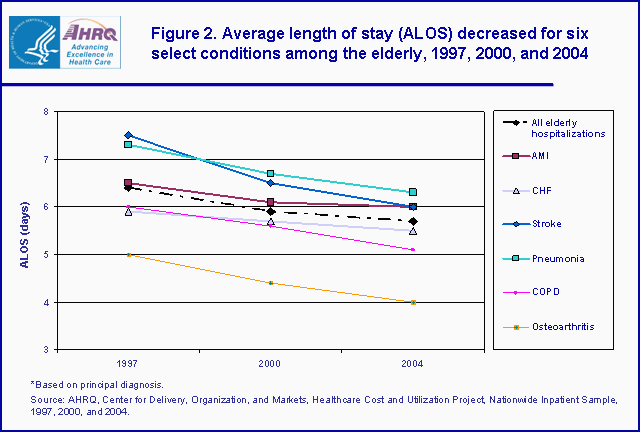
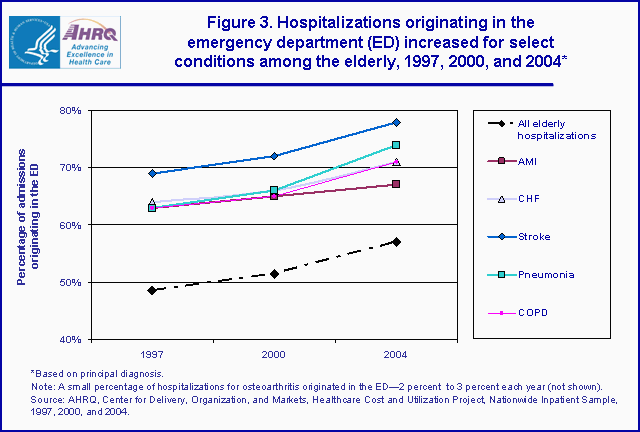
Heart and respiratory conditions, such as congestive heart failure and pneumonia, were consistently among the most common reasons for hospitalizations among elderly individuals between 1997 and 2004. Table 2 presents a list of the top 10 reasons for hospitalization in 1997, 2000, and 2004. These top 10 conditions accounted for nearly 40 percent of elderly hospitalizations each year. Trends in hospital costs and ALOS for select conditions Hospital costs increased across the years for each of the six select conditions that are the focus of this brief: congestive heart failure (CHF), pneumonia, acute myocardial infarction or heart attack (AMI), chronic obstructive pulmonary disease (COPD), acute cerebrovascular disease (stroke), and osteoarthritis. Figure 1 presents the changes in hospital costs for these six select conditions from 1997 to 2004. Specifically, hospital costs for CHF increased by about 48 percent–from $6,200 per stay in 1997 to $9,200 per stay in 2004. AMI also experienced a large cost increase of over $4,000 per hospital stay (from $11,900 in 1997 to $16,000 in 2004). Stroke and osteoarthritis both increased by over $2,000 per stay. For pneumonia and COPD, the average hospital cost increased by approximately $1,000 per stay. While hospital costs increased over time, hospital stays for each select condition were shorter in 2004 relative to 1997–dropping by 0.4 to 1.5 days, depending on the condition. In 2004, the ALOS for these six conditions ranged from 4 days to 6 days. Figure 2 presents the ALOS for these six select conditions in 1997, 2000, and 2004. The conditions with the greatest cost increases, CHF and AMI, experienced the smallest declines in ALOS: 0.4 days and 0.5 days, respectively. Pneumonia and stroke, the two diagnoses with the longest ALOS in 1997, experienced the greatest decreases in ALOS in 2004 (1 day and 1.5 days, respectively). Trends in admissions through the ED for select conditions From 1997 to 2004, the rate of hospital admissions initiated in the ED increased for all six select conditions. Hospitalizations for these conditions tended to originate in the ED more often, relative to other causes of elderly hospitalizations. Figure 3 presents the percentage of hospitalizations that originated in the ED for these select conditions in 1997, 2000, and 2004. With the exception of osteoarthritis, a condition for which there is typically a low rate of hospital admissions from the ED, hospitalizations commonly began in the ED in 2004, ranging from 67 percent of stays for AMI to 78 percent of stays for stroke. Among the six conditions, the three diagnoses that experienced the greatest increase in admissions from the ED (on average a 15 percent rise from 1997) were pneumonia, COPD, and stroke. Data Source The estimates in this Statistical Brief are based on data from the HCUP 1997–2004 Nationwide Inpatient Sample (NIS). The NIS is weighted to provide national estimates of hospital use.
Definitions Types of hospitals included in HCUP HCUP is based on data from community hospitals, defined as short-term, non-Federal, general and other hospitals, excluding hospital units of other institutions (e.g., prisons). HCUP data include OB-GYN, ENT, orthopedic, cancer, pediatric, public, and academic medical hospitals. They exclude long-term care, rehabilitation, psychiatric, and alcoholism and chemical dependency hospitals, but these types of discharges are included if they are from community hospitals. Unit of analysis The unit of analysis is the hospital discharge (i.e., the hospital stay), not a person or patient. This means that a person who is admitted to the hospital multiple times in one year will be counted each time as a separate "discharge" from the hospital. Costs and charges Total hospital charges were converted to costs using cost-to-charge ratios (CCR) based on hospital accounting reports from the Centers for Medicare and Medicaid Services (CMS).5 Costs will tend to reflect the actual costs of production, while charges represent what the hospital billed for the case. For each hospital, a hospital-wide CCR is used because detailed charges are not available across all HCUP States. Hospital charges reflect the amount the hospital charged for the entire hospital stay and does not include professional (physician) fees. For the purposes of this Statistical Brief, all cost data have been presented in 2004 dollars using the Bureau of Labor Statistics Consumer Price Index All Urban Consumers (CPI-U) U.S. city average and reported to the nearest hundreds. (Note: Costs for 2004 data are imputed from the 2003 CCR file and costs for the 1998 data are imputed from the 1997 CCR file.) Principal diagnosis and Clinical Classifications Software (CCS) The principal diagnosis is that condition established after study to be chiefly responsible for the patient’s admission to the hospital. Secondary diagnoses are concomitant conditions that coexist at the time of admission or that develop during the stay. All-listed diagnoses include the principal diagnosis plus these additional secondary conditions. The conditions presented in this brief are based on the principal diagnosis. ICD-9-CM is the International Classification of Diseases, Ninth Revision, Clinical Modification, which assigns numeric codes to diagnoses. There are about 12,000 ICD-9-CM diagnosis codes. CCS categorizes ICD-9-CM diagnoses into 260 clinically meaningful categories. This "clinical grouper" makes it easier to quickly understand patterns of diagnoses and procedures. The conditions detailed in this brief were defined by CCS principal diagnosis codes. The following CCS diagnosis codes were used to identify the six select conditions: – 100 Acute myocardial infarction (AMI) (heart attack) – 108 Congestive heart failure – 109 Acute cerebrovascular disease (stroke) – 122 Pneumonia – 127 Chronic obstructive pulmonary disease (COPD) – 203 Osteoarthritis About the NIS The HCUP Nationwide Inpatient Sample (NIS) is a nationwide database of hospital inpatient stays. The NIS is nationally representative of all community hospitals (i.e., short-term, non-Federal, non-rehabilitation hospitals). The NIS is a sample of hospitals and includes all patients from each hospital, regardless of payer. It is drawn from a sampling frame of states that comprise 88 percent of the U.S. population for 2004. The vast size of the NIS allows the study of topics at both the national and regional levels for specific subgroups of patients. In addition, NIS data are standardized across years to facilitate ease of use. About HCUP HCUP is a family of powerful healthcare databases, software tools, and products for advancing research. Sponsored by the Agency for Healthcare Research and Quality (AHRQ), HCUP includes the largest all-payer encounter-level collection of longitudinal healthcare data (inpatient, ambulatory surgery, and emergency department) in the United States, beginning in 1988. HCUP is a Federal-State-Industry Partnership that brings together the data collection efforts of many organizations–such as State data organizations, hospital associations, private data organizations, and the Federal government–to create a national information resource. For more information about HCUP, visit http://www.hcup-us.ahrq.gov/. HCUP would not be possible without the contributions of the following data collection Partners from across the United States: Arizona Department of Health Services Arkansas Department of Health & Human Services California Office of Statewide Health Planning & Development Colorado Health & Hospital Association Connecticut Integrated Health Information (Chime, Inc.) Florida Agency for Health Care Administration Georgia GHA: An Association of Hospitals & Health Systems Hawaii Health Information Corporation Illinois Health Care Cost Containment Council and Department of Public Health Indiana Hospital&Health Association Iowa Hospital Association Kansas Hospital Association Kentucky Department for Public Health Maryland Health Services Cost Review Commission Massachusetts Division of Health Care Finance and Policy Michigan Health & Hospital Association Minnesota Hospital Association Missouri Hospital Industry Data Institute Nebraska Hospital Association Nevada Division of Health Care Financing and Policy, Department of Human Resources New Hampshire Department of Health & Human Services New Jersey Department of Health and Senior Services New York State Department of Health North Carolina Department of Health and Human Services Ohio Hospital Association Oregon Office for Oregon Health Policy and Research and Oregon Association of Hospitals and Health Systems Rhode Island Department of Health South Carolina State Budget and Control Board South Dakota Association of Healthcare Organizations Tennessee Hospital Association Texas Department of State Health Services Utah Department of Health Vermont Association of Hospitals and Health Systems Virginia Health Information Washington State Department of Health West Virginia Health Care Authority Wisconsin Department of Health and Family Services For additional HCUP statistics, visit HCUPnet, our interactive query system at https://datatools.ahrq.gov/hcupnet. References For a detailed description of HCUP and more information on the design of the NIS and methods to calculate estimates, please refer to the following publications: Steiner, C., Elixhauser, A., Schnaier, J. The Healthcare Cost and Utilization Project: An Overview. Effective Clinical Practice 5(3):143–51, 2002. Design of the HCUP Nationwide Inpatient Sample, 2004. Online. August 14, 2006. U.S. Agency for Healthcare Research and Quality. http://www.hcup-us.ahrq.gov/db/nation/nis/reports/NIS_2004_Design_Report.pdf Houchens, R., Elixhauser, A. Final Report on Calculating Nationwide Inpatient Sample (NIS) Variances, 2001. HCUP Methods Series Report #2003-2. Online. June 2005 (revised June 6, 2005). U.S. Agency for Healthcare Research and Quality. http://www.hcup-us.ahrq.gov/reports/methods/2003_02.pdf Houchens, R., Elixhauser, A. Using the HCUP Nationwide Inpatient Sample to Estimate Trends. (Updated for 1988–2004). HCUP Methods Series Report #2006-05 Online. August 18, 2006. U.S. Agency for Healthcare Research and Quality. http://www.hcup-us.ahrq.gov/reports/methods/2006_05_NISTrendsReport_1988-2004.pdf Suggested Citation Nagamine, M., Jiang, H. J., and Merrill, C. T. Trends in Elderly Hospitalizations, 1997–2004. HCUP Statistical Brief #14. October 2006. Agency for Healthcare Research and Quality, Rockville, MD. http://www.hcup-us.ahrq.gov/reports/statbriefs/sb14.pdf. *** AHRQ welcomes questions and comments from readers of this publication who are interested in obtaining more information about access, cost, use, financing, and quality of healthcare in the United States. We also invite you to tell us how you are using this Statistical Brief and other HCUP data and tools, and to share suggestions on how HCUP products might be enhanced to further meet your needs. Please e-mail us at hcup@ahrq.gov or send a letter to the address below:Irene Fraser, Ph.D., Director Center for Delivery, Organization, and Markets Agency for Healthcare Research and Quality 540 Gaither Road Rockville, MD 20850 1Centers for Disease Control and Prevention. Public health and aging: Trends in aging–United States and worldwide. Morbidity and Mortality Weekly Report (MMWR), 52(06);101–106, February 14, 2003. 2AHRQ Press Release. List of priority conditions for research under Medicare Modernization Act released. December 15, 2004. 3U.S. Census Bureau. National population estimates–characteristics. http://www.census.gov/popest/national/asrh/ (Accessed July 11, 2006). 4U.S. Department of Labor, Bureau of Labor Statistics. Consumer Price Index All Urban Consumers (CPI-U), U.S. city average. http://www.bls.gov/cpi/home.htm (Accessed September 20, 2006.) 5U.S. Department of Labor, Bureau of Labor Statistics. Consumer Price Index All Urban Consumers (CPI-U), U.S. city average. http://www.bls.gov/cpi/home.htm (Accessed September 20, 2006.) |
| Table 1. Characteristics of hospitalizations among the elderly, 1997�2004 | ||||||||
| 1997 | 1998 | 1999 | 2000 | 2001 | 2002 | 2003 | 2004 | |
| Number of hospital stays, thousands (percentage of all hospital stays) | 12,482 (36.0) |
12,650 (36.3) |
12,487 (35.2) |
12,737 (35.0) |
13,317 (35.8) |
13,192 (34.9) |
13,233 (34.6) |
13,059 (33.8) |
| Mean costs per stay, dollars* | $7,800 | $7,600 | $7,700 | $8,400 | $8,500 | $9,100 | $9,400 | $9,800 |
| Mean length of stay, days | 6.4 | 6.1 | 6.0 | 5.9 | 5.8 | 5.8 | 5.7 | 5.7 |
| Percentage of hospital stays in which the patient died in the hospital | 5.1% | 5.1% | 5.2% | 5.0% | 4.8% | 4.7% | 4.7% | 4.5% |
| Percentage of hospital stays that were admitted from the ED | 48.5% | 50.0% | 51.6% | 51.5% | 53.5% | 57.4% | 57.4% | 57.0% |
| Number of comorbidities that were present on admission to the hospital | 1.8 | 1.8 | 1.9 | 1.9 | 2.0 | 2.1 | 2.2 | 2.3 |
| *1997�2003 costs have been adjusted for inflation and are noted in 2004 dollars. Source: AHRQ, Center for Delivery, Organization, and Markets, Healthcare Cost and Utilization Project, Nationwide Inpatient Sample, 1997�2004. | ||||||||
| Table 2. Top 10 reasons for hospitalizations among the elderly, 1997, 2000, and 2004 | |||
| Number of discharges in thousands (percent of elderly discharges) | |||
| Principal diagnosis | 1997 | 2000 | 2004 |
| Congestive heart failure (CHF) | 799 (6.3) |
786 (6.2) |
820 (6.3) |
| Pneumonia | 727 (5.7) |
743 (5.8) |
713 (5.5) |
| Coronary atherosclerosis (hardening of the heart arteries) | 825 (6.5) |
751 (5.9) |
641 (4.9) |
| Cardiac dysrhythmias | 410 (3.2) |
455 (3.6) |
477 (3.7) |
| Acute myocardial infarction (AMI) (heart attack) | 456 (3.6) |
472 (3.7) |
416 (3.2) |
| Osteoarthritis | 315 (2.5) |
293 (2.3) |
405 (3.1) |
| Acute cerebrovascular disease (stroke) | 484 (3.8) |
426 (3.3) |
375 (2.9) |
| Chronic obstructive pulmonary disease (COPD) | 381 (3.0) |
413 (3.2) |
365 (2.8) |
| Rehabilitation care | 299 (2.3) |
330 (2.6) |
341 (2.6) |
| Fluid and electrolyte disorders | Not a top 10 condition in 1997 | 289 (2.3) |
294 (2.3) |
| Fracture of neck of femur (hip fracture) | 312 (2.4) |
Not a top 10 condition in 2000 | Not a top 10 condition in 2004 |
| Source: AHRQ, Center for Delivery, Organization, and Markets, Healthcare Cost and Utilization Project, Nationwide Inpatient Sample, 1997, 2000, and 2004. | |||
|