STATISTICAL BRIEF #158 |
July 2013
Audrey J. Weiss, Ph.D., Anne Elixhauser, Ph.D., Jaeyong Bae, M.A., and William Encinosa, Ph.D. Introduction Prescription medications are widely used to treat a variety of acute and chronic medical conditions, and their use has increased substantially in the United States over the past 20–25 years.1 In the years 1988–1994, approximately 38 percent of the U.S. population reported that they had used a prescription drug in the past 30 days; this increased to nearly 48 percent of the population in the period from 2005 to 2008.2 Prescription drug use has increased among all age groups, reaching 25 percent of children and 90 percent of the elderly in the years 2005–2008.3 Moreover, the number of medications per patient also has increased. For example, in the period from 1988–1994, just over one-third of the elderly used three or more prescription drugs in the past 30 days, compared to nearly two-thirds in the years 2005–2008.4 The intention of prescription medications is to help cure disease or alleviate symptoms; however, sometimes the drugs can cause patient injury, known as an adverse drug event (ADE). With the substantial rise in the use of medications, there has been a concomitant increase in the occurrence of ADEs reported to the FDA.5 However, the FDA's Adverse Event Reporting System only requires drug manufacturers to report ADEs while many ADEs are often reported in hospitals instead. Between 2004 and 2008, there was a 52 percent increase in the number of ADEs reported in U.S. hospitals.6 Adverse drug events increase the risk of death, the length of hospitalization, and the cost of care.7,8 Hospital stays involving ADEs have been reported for a range of drugs, including hormones, analgesics, antibiotics, and cardiovascular drugs, among others.9 Adverse drug events may be a reason for admission to the hospital—that is, the ADE was present on admission (POA). Alternatively, ADEs may originate during the hospital stay because of medications administered during hospitalization. Adverse drug events are the most common nonsurgical adverse events in hospitals.10 In 2008, about 14 percent of Medicare patients experienced an adverse event originating during their hospital stay, costing an estimated $3.8 billion a year, with about a third of the events being ADEs.11 This Statistical Brief presents more recent data on national ADE rates over all payers in 2011. In 32 of 46 States participating in the Healthcare Cost and Utilization Project (HCUP), the data indicate whether diagnoses are POA or originate during the hospital stay. In these States, inpatient data can be used to chart the frequency of in-hospital events and to report the frequency of community-occurring ADEs that are serious enough to require hospitalization and be observed at admission. This Statistical Brief presents data from these 32 States. The 2011 rates are reported for general classes as well as the specific types of drugs that cause ADEs.12 All numbers noted in the text and included in the tables are actual values, not estimates, because the data include a census of discharges rather than a sample of discharges. In other words, we count the actual number of hospital stays with ADEs in the 32 States. Because we analyze numbers for the actual population rather than a sample, there is no need to estimate how well the sample represents an underlying population. As a result, there is no sampling error associated with the calculated values presented, and significance testing is not necessary.13 |
|
Findings
Frequency of adverse drug events, 2011 Across a total of 20,172,966 discharges in the 32 States included in our analysis, there were 782,757 ADEs that were present on admission and 259,662 ADEs that originated during the hospital stay. Table 1 presents the rate and percentage of ADEs for a range of causes. Overall, ADEs observed during hospitalization were more likely to be present on admission (388 per 10,000 discharges) than to originate during the hospital stay (129 per 10,000 discharges). Among ADEs present on admission, the most common general causes were antibiotics and anti-infectives (23.4 percent of all ADEs), systemic agents (13.6 percent), nonspecific ADE causes (12.9 percent), and hormones (11.9 percent). Among ADEs that originated during the stay, the most prevalent general causes were antibiotics and anti-infectives (28.0 percent of all ADEs), nonspecific ADE causes (16.6 percent), hormones (16.1 percent), and analgesics (12.6 percent). |
| Table 1. Adverse drug events (ADEs) in hospital inpatient settings, 32 states, 2011 | ||||
| Adverse drug event causea | ADEs based on diagnoses present on admission | ADEs based on diagnoses that originated during the hospital stay | ||
|---|---|---|---|---|
| Number of ADEs per 10,000 discharges | Percent of ADEsb | Number of ADEs per 10,000 discharges | Percent of ADEsb | |
| Any ADE cause | 388.0 | 100.0 | 128.7 | 100.0 |
| Antibiotics and anti-infectives | 90.9 | 23.4 | 36.1 | 28.0 |
| Antibiotics | 12.5 | 3.2 | 12.9 | 10.0 |
| Clostridium difficile infection14 | 73.1 | 18.8 | 21.9 | 17.1 |
| Other anti-infectives | 6.3 | 1.6 | 1.7 | 1.3 |
| Hormones | 46.3 | 11.9 | 20.7 | 16.1 |
| Steroids | 37.3 | 9.6 | 19.7 | 15.3 |
| Insulin and hypoglycemics | 7.1 | 1.8 | 0.8 | 0.6 |
| Other hormones | 3.0 | 0.8 | 0.3 | 0.2 |
| Systemic agents | 52.8 | 13.6 | 8.5 | 6.6 |
| Antineoplastic drugs | 49.2 | 12.7 | 7.8 | 6.0 |
| Antiallergy and antiemetic drugs | 3.1 | 0.8 | 0.7 | 0.5 |
| Other systemic agents | 0.8 | 0.2 | 0.1 | 0.1 |
| Agents affecting blood constituents | 43.9 | 11.3 | 8.5 | 6.6 |
| Anticoagulants | 40.6 | 10.5 | 6.7 | 5.2 |
| Other agents that affect blood constituents | 3.9 | 1.0 | 1.9 | 1.5 |
| Analgesics | 45.5 | 11.7 | 16.2 | 12.6 |
| Opiates/Narcotics | 18.8 | 4.9 | 11.2 | 8.7 |
| NSAIDS | 28.3 | 7.3 | 5.1 | 4.0 |
| Anticonvulsants and anti-Parkinson drugs | 11.0 | 2.8 | 1.5 | 1.2 |
| Hydantoin | 3.3 | 0.9 | 0.4 | 0.3 |
| Other anticonvulsants | 7.3 | 1.9 | 1.0 | 0.7 |
| Anti-Parkinson drugs | 0.8 | 0.2 | 0.1 | 0.1 |
| Sedatives or hypnotics | 11.0 | 2.8 | 5.7 | 4.4 |
| CNS depressants and anesthetics | 3.9 | 1.0 | 6.7 | 5.2 |
| Psychotropic agents | 34.8 | 9.0 | 4.2 | 3.2 |
| Antidepressants | 9.5 | 2.5 | 0.5 | 0.4 |
| Antipsychotics | 7.0 | 1.8 | 0.8 | 0.7 |
| Benzodiazepine | 18.1 | 4.7 | 2.2 | 1.7 |
| Other psychotropic drugs | 7.2 | 1.8 | 0.8 | 0.6 |
| Central nervous system drugs | 4.9 | 1.3 | 0.4 | 0.3 |
| Autonomic nervous system drugs | 2.6 | 0.7 | 0.7 | 0.5 |
| Cardiovascular drugs | 29.4 | 7.6 | 7.5 | 5.8 |
| Digoxin | 4.8 | 1.2 | 0.6 | 0.5 |
| Antiadrenergics | 4.2 | 1.1 | 1.1 | 0.9 |
| Other cardiovascular drugs | 21.6 | 5.6 | 5.9 | 4.6 |
| GI system drugs | 1.3 | 0.3 | 0.5 | 0.4 |
| Water, mineral, and uric acid metabolism drugs | 16.9 | 4.4 | 6.1 | 4.8 |
| Saluretics | 5.2 | 1.3 | 0.7 | 0.5 |
| Other diuretics | 10.7 | 2.8 | 4.6 | 3.6 |
| Other drugs affecting mineral and uric acid metabolism | 1.6 | 0.4 | 0.9 | 0.7 |
| Smooth muscle and respiratory drugs | 4.0 | 1.0 | 1.1 | 0.8 |
| Skin, eye, mucous membrane drugs | 1.0 | 0.3 | 0.3 | 0.3 |
| Vaccines | 0.3 | 0.1 | 0.1 | 0.1 |
| Other specific drugs | 0.2 | 0.1 | 0.0 | 0.0 |
| Nonspecific ADE causes (drug type not specified) | 49.9 | 12.9 | 21.4 | 16.6 |
| Abbreviation: NSAIDS, nonsteroidal anti-inflammatory drugs. a General ADEs are in bold; specific ADEs are indented. b The sum may be greater than 100% because some hospital stays may involve more than one ADE. Source: Agency for Healthcare Research and Quality (AHRQ), Center for Delivery, Organization, and Markets, Healthcare Cost and Utilization Project (HCUP), State Inpatient Databases (SID) for 32 States, 2011. |
||||
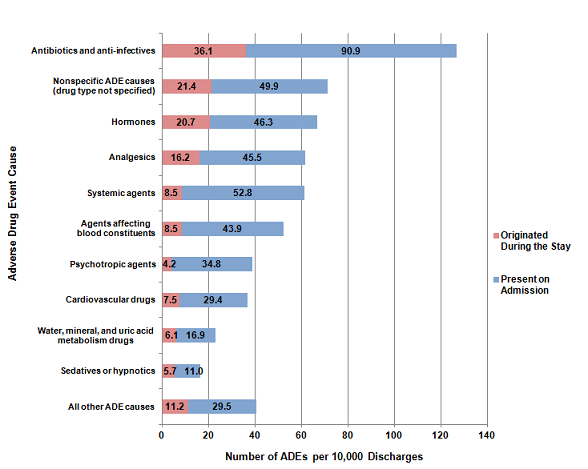
General causes of adverse drug events, 2011 The general causes of adverse drug events that were present on hospital admission and those that originated during the stay are provided in Figure 1. The order of the list is from the most to least frequently occurring cause overall. The most frequent general causes of ADEs were antibiotics and anti-infectives (127 events per 10,000 discharges), nonspecific ADE causes (71 events), hormones (67 events), and analgesics (62 events). Across all general causes, ADEs were substantially more likely to be present on admission than to originate during the stay. |
|
Figure 1. General causes of adverse drug events (ADEs), 2011
Source: Agency for Healthcare Research and Quality (AHRQ), Center for Delivery, Organization, and Markets, Healthcare Cost and Utilization Project (HCUP), State Inpatient Databases (SID) for 32 States, 2011 Figure 1 is a stacked bar graph, showing the number of adverse drug events per 10,000 discharges by the cause of the adverse drug event, for those that originated during the stay and those that were present on admission. Antibiotics and anti-infectives: 36.1 originated during the stay and 90.9 were present on admission. Nonspecific adverse event causes, drug type not specified: 21.4 originated during the stay and 49.9 were present on admission. Hormones: 20.7 originated during the stay and 46.3 were present on admission. Analgesics: 16.2 originated during the stay and 45.5 were present on admission. Systemic agents: 8.5 originated during the stay and 52.8 were present on admission. Agents affecting blood constituents: 8.5 originated during the stay and 43.9 were present on admission. Psychotropic agents: 4.2 originated during the stay and 34.8 were present on admission. Cardiovascular drugs: 7.5 originated during the stay and 29.4 were present on admission. Water, mineral, and uric acid metabolism drugs: 6.1 originated during the stay and 16.9 were present on admission. Sedatives or hypnotics: 5.7 originated during the stay and 11.0 were present on admission. All other adverse drug event causes: 11.2 originated during the stay and 29.5 were present on admission. Source: Agency for Healthcare Research and Quality, Center for Delivery, Organization, and Markets, Healthcare Cost and Utilization Project, State Inpatient Databases for 32 States, 2011. |
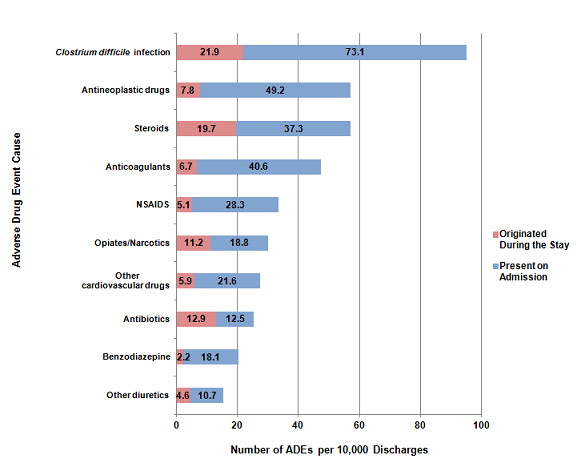
Most common specific causes of adverse drug events, 2011 Figure 2 presents the 10 most common specific causes of adverse drug events. The data represent causes that occurred at a rate of more than 15 per 10,000 discharges. Clostridium difficile infection was the most common ADE cause, occurring at a rate of 95 per 10,000 discharges. The next two most frequently occurring ADE causes—antineoplastic drugs and steroids—each occurred at a rate of 57 per 10,000 discharges. With the exception of antibiotics, all of the most common specific causes of ADEs were more likely to be present on admission than to originate during the hospital stay. For antibiotics, the number of events was nearly equal across the settings: 12.5 ADEs per 10,000 discharges were present on admission versus 12.9 ADEs that originated during the stay. |
|
Figure 2. Ten most common specific causes of adverse drug events (ADEs), 2011
Abbreviation: NSAIDS, nonsteroidal anti-inflammatory drugs Figure 2 is a stacked bar graph, showing the number of adverse drug events per 10,000 discharges by the cause of the adverse drug event, for those that originated during the stay and those that were present on admission. Clostridium difficile infection: 21.9 originated during the stay and 73.1 were present on admission. Antineoplastic drugs: 7.8 originated during the stay and 49.2 were present on admission. Steroids: 19.7 originated during the stay and 37.3 were present on admission. Anticoagulants: 6.7 originated during the stay and 40.6 were present on admission. Nonsteroidal anti-inflammatory drugs: 5.1 originated during the stay and 28.3 were present on admission. Opiates and Narcotics: 11.2 originated during the stay and 18.8 were present on admission. Other cardiovascular drugs: 5.9 originated during the stay and 21.6 were present on admission. Antibiotics: 12.9 originated during the stay and 12.5 were present on admission. Benzodiazepine: 2.2 originated during the stay and 18.1 were present on admission. Other diuretics: 4.6 originated during the stay and 10.7 were present on admission. Source: Agency for Healthcare Research and Quality, Center for Delivery, Organization, and Markets, Healthcare Cost and Utilization Project, State Inpatient Databases for 32 States, 2011.
|
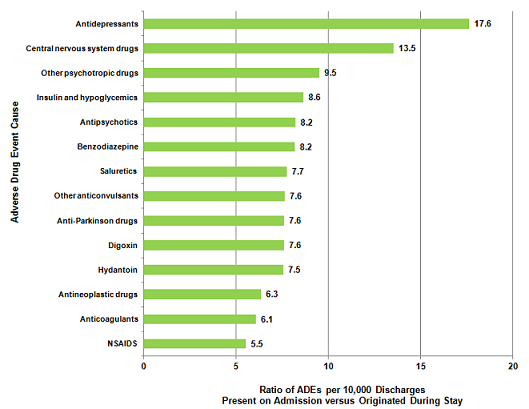
Most common causes of adverse drug events that were present on admission versus originated during the stay, 2011 Across all causes of adverse drug events, there were three times as many ADEs that were present on admission than originated during the stay. Most causes of adverse drug events were more likely to be present on admission. Figure 3 presents the ratio of ADEs per 10,000 discharges that were present on admission versus those that originated during the stay for ADE causes that had at least a 5-fold difference (i.e., the ratio was at least 5.0). Most of the ADE causes had a ratio between 5.0 and 10.0. Only two ADE causes exceeded a ratio of 10.0: ADEs that were due to antidepressants (17.6 times more likely to be POA) and central nervous system drugs (13.5 times more likely to be POA). Only one ADE cause—CNS depressants and anesthetics (data not shown)—was more likely to originate during the hospital stay (4 per 10,000 discharges were present on admission versus 7 per 10,000 discharges originated during the stay). ADEs caused by antibiotics were about equally likely to originate during the stay as to be present on admission (data not shown). |
|
Figure 3. Most common causes of adverse drug events (ADEs) that were present on admission versus those that originated during the stay, 2011
Abbreviation: NSAIDS, nonsteroidal anti-inflammatory drugs Figure 3 is a bar graph showing the ratio of adverse drug events per 10,000 discharges present on admission versus those that originated during the stay by the cause of the adverse drug event. Antidepressants, 17.6, Central nervous system drugs, 13.5, Other psychotropic drugs, 9.5, Insulin and hypoglycemics, 8.6, Antipsychotics, 8.2, Benzodiazepine, 8.2, Saluretics, 7.7, Other anticonvulsants, 7.6, Anti-Parkinson drugs, 7.6, Digoxin, 7.6, Hydantoin, 7.5, Antineoplastic drugs, 6.3, Anticoagulants, 6.1, Nonsteroidal anti-inflammatory drugs, 5.5. Source: Agency for Healthcare Research and Quality, Center for Delivery, Organization, and Markets, Healthcare Cost and Utilization Project, State Inpatient Databases for 32 States, 2011.
|
Data Source
The estimates in this Statistical Brief are based upon data from the Healthcare Cost and Utilization Project (HCUP) 2011 State Inpatient Databases (SID) from 32 States. These States included data elements that designated whether diagnoses were present on admission or originated during the stay: Arkansas, Arizona, California, Colorado, Florida, Georgia, Hawaii, Iowa, Illinois, Indiana, Kansas, Kentucky, Massachusetts, Maryland, Michigan, Minnesota, Montana, Nebraska, New Jersey, Nevada, New York, Oklahoma, Oregon, Pennsylvania, South Carolina, South Dakota, Tennessee, Texas, Virginia, Vermont, Washington, and Wisconsin. Definitions The specific causes of adverse drug events presented in this Statistical Brief were based on a review of International Classification of Diseases, Ninth Revision, Clinical Modification (ICD-9-CM) diagnosis codes and external cause of injury codes (E codes). The specific ICD-9-CM codes used for each ADE cause is provided in the separate appendix associated with this Statistical Brief on the HCUP-US website at: http://www.hcup-us.ahrq.gov/reports/statbriefs/sb158_appendix.pdf. Present on admission was determined for each discharge diagnosis based on two types of present-on-admission indicator flags in the SID: (1) a diagnosis-specific flag that indicates whether each diagnosis was present on admission, and (2) an E code flag that indicates whether each external cause of injury was present on admission. A total of 4,554 hospitals and 30,149,145 discharges were in the original SID for the 32 States in this study. Hospitals and individual discharge records with missing or incomplete present-on-admission information were excluded from the analysis, as shown in Table 2. |
| Table 2. Exclusion criteria and the number of hospitals and discharges excluded | ||||
| Exclusion Criteria | Hospitals Excludeda | Discharges Excludeda | ||
|---|---|---|---|---|
| Number | Percent | Number | Percent | |
| Hospitals that reported all diagnoses and E-codes as being present on admission | 48 | 1.1 | 47,104 | 0.2 |
| Hospitals with 20 percent or more discharges with a missing present on admission indicator for nonmissing diagnoses or E-codes | 1,768 | 38.8 | 8,619,776 | 28.6 |
| Hospitals that only coded present on admission for Medicare patients | 5 | 0.1 | 3,140 | 0.0 |
| Discharges with missing present on admission information for nonmissing diagnoses or E-codes | n/a | n/a | 1,309,298 | 4.3 |
| aSome excluded hospitals and discharges are counted more than once, as a function of meeting more than one exclusion criteria. | ||||
The final analysis file for this Statistical Brief included 2,737 hospitals (60.1 percent) and 20,172,966 discharges (66.9 percent) across the 32 States.
Unit of analysis The unit of analysis is the hospital discharge (i.e., the hospital stay), not a person or patient. This means that a person who is admitted to the hospital multiple times in one year will be counted each time as a separate "discharge" from the hospital. About HCUP HCUP is a family of powerful healthcare databases, software tools, and products for advancing research. Sponsored by the Agency for Healthcare Research and Quality (AHRQ), HCUP includes the largest all-payer encounter-level collection of longitudinal healthcare data (inpatient, ambulatory surgery, and emergency department) in the United States, beginning in 1988. HCUP is a Federal-State-Industry Partnership that brings together the data collection efforts of many organizations—such as State data organizations, hospital associations, private data organizations, and the Federal government—to create a national information resource. HCUP would not be possible without the contributions of the following data collection Partners from across the United States: Alaska State Hospital and Nursing Home Association Arizona Department of Health Services Arkansas Department of Health California Office of Statewide Health Planning and Development Colorado Hospital Association Connecticut Hospital Association Florida Agency for Health Care Administration Georgia Hospital Association Hawaii Health Information Corporation Illinois Department of Public Health Indiana Hospital Association Iowa Hospital Association Kansas Hospital Association Kentucky Cabinet for Health and Family Services Louisiana Department of Health and Hospitals Maine Health Data Organization Maryland Health Services Cost Review Commission Massachusetts Center for Health Information and Analysis Michigan Health & Hospital Association Minnesota Hospital Association Mississippi Department of Health Missouri Hospital Industry Data Institute Montana MHA - An Association of Montana Health Care Providers Nebraska Hospital Association Nevada Department of Health and Human Services New Hampshire Department of Health & Human Services New Jersey Department of Health New Mexico Department of Health New York State Department of Health North Carolina Department of Health and Human Services North Dakota (data provided by the Minnesota Hospital Association) Ohio Hospital Association Oklahoma State Department of Health Oregon Association of Hospitals and Health Systems Oregon Health Policy and Research Pennsylvania Health Care Cost Containment Council Rhode Island Department of Health South Carolina Budget & Control Board South Dakota Association of Healthcare Organizations Tennessee Hospital Association Texas Department of State Health Services Utah Department of Health Vermont Association of Hospitals and Health Systems Virginia Health Information Washington State Department of Health West Virginia Health Care Authority Wisconsin Department of Health Services Wyoming Hospital Association About the SID The HCUP State Inpatient Databases (SID) are hospital inpatient databases from data organizations participating in HCUP. The SID contain the universe of the inpatient discharge abstracts in the participating HCUP States, translated into a uniform format to facilitate multistate comparisons and analyses. Together, the SID encompass more than 95 percent of all U.S. community hospital discharges in 2011. The SID can be used to investigate questions unique to one State, to compare data from two or more States, to conduct market area variation analyses, and to identify State-specific trends in inpatient care utilization, access, charges, and outcomes. For More Information For more information about HCUP, visit http://www.hcup-us.ahrq.gov/. For additional HCUP statistics, visit HCUPnet, our interactive query system, at https://datatools.ahrq.gov/hcupnet. For information on other hospitalizations in the United States, download HCUP Facts and Figures: Statistics on Hospital-Based Care in the United States in 2009, located at http://www.hcup-us.ahrq.gov/reports.jsp. For a detailed description of HCUP, more information on the design of the State Inpatient Databases (SID), please refer to the following publications: Introduction to the HCUP State Inpatient Databases. Online. December 2012. U.S. Agency for Healthcare Research and Quality. http://hcup-us.ahrq.gov/db/state/siddist/Introduction_to_SID.pdf. Accessed June 24, 2013. Suggested Citation Weiss AJ (Truven Health Analytics), Elixhauser A (AHRQ), Bae J (Emory University), Encinosa W (AHRQ). Origin of Adverse Drug Events in U.S. Hospitals, 2011. HCUP Statistical Brief #158. July 2013. Agency for Healthcare Research and Quality, Rockville, MD. http://www.hcup-us.ahrq.gov/reports/statbriefs/sb158.pdf. Acknowledgements The authors would like to acknowledge the contributions of Devi Katikineni and Valeriy Bakaushin of Social & Scientific Systems, Inc. *** AHRQ welcomes questions and comments from readers of this publication who are interested in obtaining more information about access, cost, use, financing, and quality of healthcare in the United States. We also invite you to tell us how you are using this Statistical Brief and other HCUP data and tools, and to share suggestions on how HCUP products might be enhanced to further meet your needs. Please e-mail us at hcup@ahrq.gov or send a letter to the address below:Irene Fraser, Ph.D., Director Center for Delivery, Organization, and Markets Agency for Healthcare Research and Quality 540 Gaither Road Rockville, MD 20850 1 National Center for Health Statistics. Health, United States, 2011: With Special Feature on Socioeconomic Status and Health. Hyattsville, MD: Centers for Disease Control and Prevention; 2012. 2 Ibid. 3 Ibid. 4 Ibid. 5 Moore TJ, Cohen MR, Furberg CD. Serious adverse drug events reported to the Food and Drug Administration, 1998–2005. Archives of Internal Medicine 2007;167(15):1752–9. 6 Lucado J, Paez K, Elixhauser E. Medication-Related Adverse Outcomes in U.S. Hospitals and Emergency Departments, 2008. HCUP Statistical Brief #109. April 2011. Agency for Healthcare Research and Quality, Rockville, MD. http://www.hcup-us.ahrq.gov/reports/statbriefs/sb109.pdf. Accessed June 24, 2013. 7 Classen DC, Jaser L, and Budnitz DS. Adverse Drug Events Among Hospitalized Medicare Patients: Epidemiology and National Estimates from a New Approach to Surveillance. The Joint Comm.J. on Quality and Patient Safety. 2010, 36:1, 12-21. 8 Classen DC, Pestotnik SL, Evans RS, et al. Adverse drug events in hospitalized patients. Excess length of stay, extra costs, and attributable mortality. JAMA 1997 Jan 22:277(4):301–6. 9 Lucado J, Paez K, Elixhauser E. Medication-Related Adverse Outcomes in U.S. Hospitals and Emergency Departments, 2008. HCUP Statistical Brief #109. April 2011. Agency for Healthcare Research and Quality, Rockville, MD. http://www.hcup-us.ahrq.gov/reports/statbriefs/sb109.pdf. Accessed June 24, 2013. 10 de Vries EN, Ramrattan MA, Smorenburg SM, Gouma DJ, Boermeester MA. The incidence and nature of in-hospital adverse events: a systematic review. Quality and Safety in Health Care. 2008;17;216–23. 11 Levinson DR. Adverse Events in Hospitals: National Incidence Among Medicare Beneficiaries. Office of Inspector General, Department of Health and Human Services, 2010. OEI-06-09-00090. 12 2010 HCUP ADE origination rates were presented in Encinosa WE and Bae J. Will Meaningful Use Hospital EMR Prevent Hospital-Acquired Drug Events? WHITE Conference, October, 2012. http://www.rhsmith.umd.edu/files/Documents/Centers/CHIDS/events/2013/2013WHITE/2012WHITEProgram.pdf. 13 Houchens, R. Inferences with HCUP State Databases Final Report. HCUP Methods Series Report # 2010-05. Online October 12, 2010. U.S. Agency for Healthcare Research and Quality. http://www.hcup-us.ahrq.gov/reports/methods/2010_05.pdf. Accessed June 24, 2013. 14 Clostridium difficile infection (CDI) often occurs as a complication of antibiotic therapy; ampicillin, clindamycin, third-generation cephalosporins (such as cefotaxime and ceftazidime), and fluoroquinolones are commonly identified as high-risk drugs. From: Blondeau JM. What have we learned about antimicrobial use and the risks for Clostridium difficile-associated diarrhoea? Journal of Antimicrobial Chemotherapy 2009;63(2):230–7. |