STATISTICAL BRIEF #161 |
September 2013
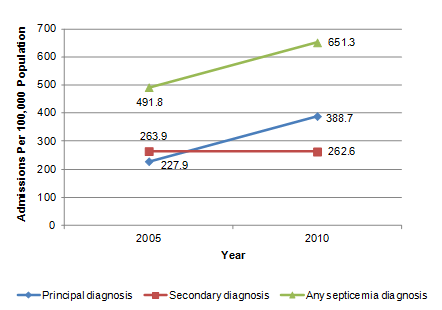
Janet P. Sutton, Ph.D. and Bernard Friedman, Ph.D. Introduction Septicemia, commonly referred to as sepsis, is a serious blood infection that produces systemic inflammation and may lead to organ failure, shock, and even death. Most often caused by bacteria or bacterial toxins in the blood stream (bacteremia with sepsis), more than one million cases of septicemia are reported in the United States each year.1 Costs of septicemia treatment are high, with total hospital costs estimated to be more than $24 billion in 2007.2 Despite resources incurred in treatment, an estimated 25 to 50 percent of patients succumb to this condition, making septicemia the tenth leading cause of death in the United States.3 Hospitalizations associated with septicemia have risen markedly over the past decade. A study conducted by the Agency for Healthcare Research and Quality (AHRQ) found that between 2000 and 2009, the number of hospitalizations with a principal diagnosis of septicemia increased by 148 percent, and hospitalizations with a secondary diagnosis of septicemia increased by 66 percent. In fact, septicemia was the sixth most common principal diagnosis in the inpatient setting, accounting for one out of every 23 hospitalized patients.4 This Statistical Brief builds on comparisons between 2000 and 2009 data on septicemia-related hospitalizations that were presented in a previous report4 by examining trends in septicemia hospitalizations for 2005 and 2010. It focuses on the subpopulation with two or more septicemia admissions during the year. Seven geographically diverse States are included in these analyses: Arizona, California, Florida, Nebraska, New York, Utah, and Washington. In addition to describing growth in the number of septicemia hospitalizations, this analysis provides estimates of the number of distinct individuals with a septicemia hospitalization and the number of individuals with multiple septicemia admissions during the year. Changes in the number of admissions, characteristics of patients, average length of stay, and discharge disposition are examined for patients with one hospital stay for septicemia and compared to those with multiple septicemia hospitalizations, using data from the Healthcare Cost and Utilization Project (HCUP) State Inpatient Databases (SID). Estimates of average length of stay and discharge disposition for the subgroup with more than one hospitalization are made in reference to the index (initial) hospitalization. Unless otherwise stated, differences between estimates noted in the text are statistically significant at the 0.05 level or better. Findings Septicemia admissions In 2010, hospital admissions with a principal or secondary septicemia diagnosis approximated 651.3 per 100,000 population. This represents a greater than 32 percent increase relative to 2005, when the rate of septicemia admissions was estimated at 491.8 per 100,000 population. As shown in Figure 1, almost all of this increase was due to admissions where septicemia was the principal diagnosis. Between 2005 and 2010, the number of admissions with a principal septicemia diagnosis increased by nearly 71 percent—from a rate of 227.9 per 100,000 population to a rate of 388.7 per 100,000 population. |
|
|
Figure 1. Septicemia admissions per 100,000 population for patients aged 18 years and older in selected States, 2005 and 2010
Source: Agency for Healthcare Research and Quality (AHRQ), Center for Delivery, Organization, and Markets, Healthcare Cost and Utilization Project (HCUP), State Inpatient Databases, 2005 and 2010: Arizona, California, Florida, Nebraska, New York, Utah, and Washington This is a line diagram showing the admissions per 100,000 population by the years 2005 and 2010 for admissions with a principal diagnosis of septicemia, secondary diagnosis of septicemia, and any septicemia diagnosis. 2005: Principal diagnosis: 227.9, Secondary diagnosis: 263.9, Any septicemia diagnosis: 491.8. 2010: Principal diagnosis: 388.7, Secondary diagnosis: 262.6, Any septicemia diagnosis: 651.3. Source: Agency for Healthcare Research and Quality (AHRQ), Center for Delivery, Organization, and Markets, Healthcare Cost and Utilization Project (HCUP), State Inpatient Databases, 2005 and 2010: Arizona, California, Florida, Nebraska, New York, Utah, and Washington. |
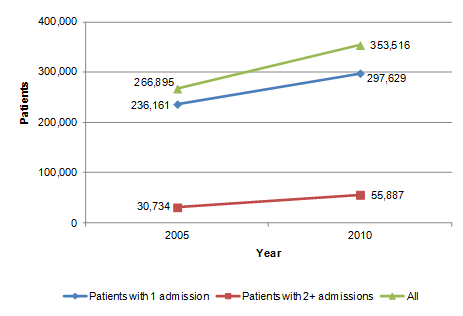
Number of individuals with a septicemia admission The number of individuals with a septicemia-related hospital admission—either as a principal or a secondary diagnosis—increased from 267,000 in 2005 to 354,000 in 2010, which is a growth of approximately 33 percent. In both 2005 and 2010, the vast majority of patients experienced only one admission with a septicemia diagnosis during the year. As shown in Figure 2, in 2005 only 11.5 percent of patients (a total of 30,734) had multiple septicemia admissions during the calendar year compared to 15.8 percent of patients in 2010 (a total of 55,887). |
|
Figure 2. Number of patients aged 18 years and older with one and two or more septicemia hospitalizations* in selected States, 2005 and 2010
*Includes hospitalizations where septicemia is a principal or secondary diagnosis The asterisk indicates hospitalizations where septicemia is a principal or secondary diagnosis. This is a line diagram showing the number of patients by the years 2005 and 2010 for admissions with 1 admission for septicemia, 2 or more admissions for septicemia, and all septicemia admissions. 2005: Patients with 1 admission: 236,161, Patients with 2 or more admissions: 30,734, All septicemia admissions: 266,895. 2010: Patients with 1 admission: 297,629, Patients with 2 or more admissions: 55,887, All septicemia admissions: 353,516. Source: Agency for Healthcare Research and Quality (AHRQ), Center for Delivery, Organization, and Markets, Healthcare Cost and Utilization Project (HCUP), State Inpatient Databases (SID), 2005 and 2010: Arizona, California, Florida, Nebraska, New York, Utah, and Washington. |
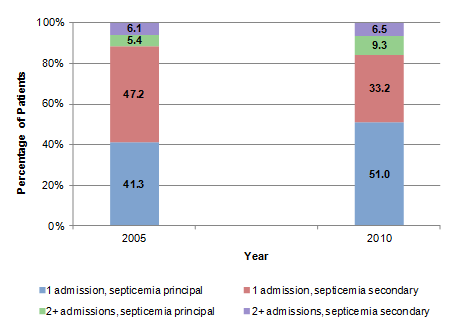
Trends in number of septicemia admissions for septicemia as a principal or secondary diagnosis Trends in the proportion of individuals with one or multiple septicemia admissions differed by whether septicemia was the principal or secondary admitting diagnosis. As shown in Figure 3, between 2005 and 2010 the proportion of individuals with one septicemia admission where septicemia was the principal diagnosis increased from 41.3 percent to 51.0 percent—a growth of 23 percent. During the same time period, the proportion of individuals with two or more admissions for which septicemia was the principal diagnosis increased from 5.4 percent to 9.3 percent—a growth of 72 percent. Among those with a septicemia secondary diagnosis, the proportion with one admission decreased from 47.2 percent to 33.2 percent—a decline of 30 percent. No difference was observed in the proportion of individuals with multiple admissions when septicemia was the secondary diagnosis during the index stay. |
|
Figure 3. Percentage of patients with one or multiple septicemia hospitalizations* by principal or secondary septicemia diagnosis in selected States, 2005 and 2010
*For patients with multiple admissions, determination of whether septicemia is the principal or secondary diagnosis is based on the ICD-9-CM diagnoses codes corresponding to the index hospitalization. The asterisk indicates for patients with multiple admissions, determination of whether septicemia is the principal or secondary diagnosis is based on the ICD-9-CM diagnoses codes corresponding to the index hospitalization. This is a stacked bar chart showing the percentage of patients by the years 2005 and 2010 for patients with 1 admission with a septicemia principal diagnosis, 1 admission with a septicemia secondary diagnosis, and 2 or more admissions in each of these categories. 2005: 1 admission, sepsis principal diagnosis: 41.3, 1 admission, sepsis secondary diagnosis: 47.2, 2 or more admissions, sepsis principal diagnosis: 5.4, 2 or more admissions, sepsis secondary diagnosis: 6.1. 2010: 1 admission, sepsis principal diagnosis: 51, 1 admission, sepsis secondary diagnosis: 33.2, 2 or more admissions, sepsis principal diagnosis: 9.3, 2 or more admissions, sepsis secondary diagnosis: 6.5. Source: Agency for Healthcare Research and Quality (AHRQ), Center for Delivery, Organization, and Markets, Healthcare Cost and Utilization Project (HCUP), State Inpatient Databases (SID), 2005 and 2010: Arizona, California, Florida, Nebraska, New York, Utah, and Washington. |
Characteristics of patients with multiple septicemia admissions As shown in Table 1, there were larger differences between patients with a principal versus a secondary septicemia diagnosis than between patients with one versus multiple septicemia admissions. Among the subgroup with a septicemia principal diagnosis, equal proportions—approximately one-fifth—of those with one admission and those with multiple septicemia admissions were 85 years of age or older. However, among those with a secondary septicemia diagnosis, only 14.1 percent with one admission and 11.5 percent with multiple admissions were in this age group. Approximately one-half of admissions with a diagnosis of septicemia were female. |
| Table 1. Characteristics of patients with a hospital admission for septicemia as a principal or secondary diagnosis in selected States, 2010 | ||||
| Characteristic | Principal diagnosis | Secondary diagnosis | ||
|---|---|---|---|---|
| 1 admission (% of n) | 2+ admissions (% of n) | 1 admission (% of n) | 2+ admissions (% of n) | |
| Age (years) | ||||
| 18–44 | 9.1 | 7.2 | 12.6 | 12.0 |
| 45-64 | 24.8 | 25.3 | 31.4 | 33.2 |
| 65-84 | 43.9 | 46.8 | 41.9 | 43.4 |
| 85+ | 22.2 | 20.7 | 14.1 | 11.5 |
| Sex | ||||
| Female | 52.8 | 49.1 | 47.6 | 46.3 |
| Primary Payer | ||||
| Medicare | 68.5 | 74.3 | 60.5 | 65.5 |
| Medicaid | 9.9 | 10.6 | 13.5 | 14.0 |
| Private | 15.7 | 11.8 | 19.2 | 16.7 |
| Self-pay | 3.0 | 1.4 | 3.3 | 1.5 |
| Other | 2.7 | 1.7 | 3.4 | 2.1 |
| Source: Agency for Healthcare Research and Quality (AHRQ), Center for Delivery, Organization, and Markets, Healthcare Cost and Utilization Project (HCUP), State Inpatient Databases (SID), 2005 and 2010: Arizona, California, Florida, Nebraska, New York, Utah, and Washington | ||||
Medicare was the expected primary payer for a greater proportion of individuals with multiple septicemia admissions than for those with a single admission. Among patients for which septicemia was a principal diagnosis, 68.5 percent of patients with one admission were insured by Medicare, compared to 74.3 percent of those with multiple admissions. Almost two-thirds of patients with a septicemia admission were covered by Medicare.
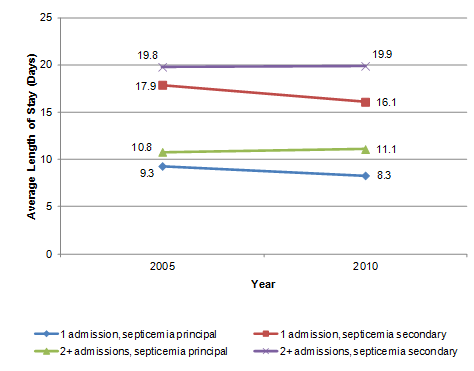
Thirty-day readmissions Among patients readmitted after a stay with septicemia as the principal diagnosis, 51.5 percent were readmitted within 30 days in 2005 compared to 62.3 percent readmitted within 30 days in 2010—a 21 percent increase (data not shown). Among those readmitted following an index stay with a secondary septicemia diagnosis, the proportion readmitted within 30 days decreased from 48.5 percent in 2005 to 37.7 percent in 2010—a decrease of 22 percent. Trends in average length of stay Figure 4 provides information on the average length of stay for patients admitted with a principal and secondary septicemia diagnosis. As indicated on this figure, average length of stay declined by 1 day (from an average of 9.3 to 8.3 days) for patients with one admission where septicemia was the principal diagnosis. Among patients with only one admission where septicemia was a secondary diagnosis, length of stay declined by almost 2 days from an average of 17.9 days in 2005 to 16.1 days in 2010. For the subset of patients with multiple septicemia admissions, length of stay was examined for the index admission. Regardless of whether septicemia was a principal or secondary diagnosis, between 2005 and 2010 no significant differences in average length of stay for the index admission were observed for the subgroup of patients who experienced multiple admissions during the year. |
|
Figure 4. Average length of stay* for patients discharged with a principal or secondary septicemia diagnosis by number of septicemia discharges in the year in selected States, 2005 and 2010
*For patients with multiple admissions, length of stay is based on the index hospitalization. The asterisk indicates that for patients with multiple admissions, length of stay is based on the index hospitalization. This is a line diagram showing the average length of stay in days by the years 2005 and 2010 for admissions with 1 admission for septicemia as a principal diagnosis, 2 or more admissions for septicemia as a principal diagnosis, and admissions for septicemia as a secondary diagnosis for each of these categories. 2005: 1 admission, septicemia as a principal diagnosis: 9.3, 2 or more admissions, septicemia as a principal diagnosis: 10.8, 1 admission, septicemia as a secondary diagnosis: 17.9, 2 or more admissions, septicemia as a secondary diagnosis: 19.8. 2010: 1 admission, septicemia as a principal diagnosis: 8.3, 2 or more admissions, septicemia as a principal diagnosis: 11.1, 1 admission, septicemia as a secondary diagnosis: 16.1, 2 or more admissions, septicemia as a secondary diagnosis: 19.9. Source: Agency for Healthcare Research and Quality (AHRQ), Center for Delivery, Organization, and Markets, Healthcare Cost and Utilization Project (HCUP), State Inpatient Databases (SID), 2005 and 2010: Arizona, California, Florida, Nebraska, New York, Utah, and Washington. |
Discharge disposition As shown in Table 2, patients with multiple admissions for septicemia were more likely to be discharged to a skilled nursing facility (SNF) or long-term care (LTC) following the index hospitalization. In 2010, for example, 46.8 percent of patients with a principal septicemia diagnosis who would later have another admission had been discharged to a SNF or LTC following their index stay. In contrast, only 24.6 percent of patients with a principal septicemia diagnosis who were not readmitted during the subsequent year had been discharged to a SNF or LTC. |
| Table 2. Discharge disposition after the index hospital stay* for patients with a principal or secondary septicemia diagnosis by number of admissions in a year in selected States, 2010 | ||||
| Discharge disposition after index stay | Septicemia principal | Septicemia secondary | ||
|---|---|---|---|---|
| 1 admission (% of n) | 2+ admissions (% of n)(index stay) | 1 admission (% of n) | 2+ admissions (% of n)(index stay) | |
| Age (years) | ||||
| Skilled nursing facility or long-term care | 24.6 | 46.8 | 21.3 | 37.0 |
| Home | 34.3 | 20.2 | 29.4 | 21.8 |
| Home health | 17.7 | 16.8 | 19.9 | 18.6 |
| Other | 23.4 | 16.2 | 29.4 | 22.6 |
| *For patients with multiple admissions, discharge disposition is determined for the index hospitalization. Source: Agency for Healthcare Research and Quality (AHRQ), Center for Delivery, Organization, and Markets, Healthcare Cost and Utilization Project (HCUP), State Inpatient Databases (SID), 2005 and 2010: Arizona, California, Florida, Nebraska, New York, Utah, and Washington |
||||
Admission source Regardless of whether septicemia was a principal or secondary diagnosis, a greater proportion of patients with one septicemia admission were admitted from a SNF (data not shown). For the subgroup with a septicemia principal diagnosis, 3.7 percent of patients with one hospitalization had been admitted from a SNF compared to 2.2 percent of those with multiple subsequent septicemia admissions. For the subgroups with a septicemia secondary diagnosis, 5.3 percent of patients with one hospitalization and 2.9 percent of those with multiple hospitalizations had been admitted from a SNF. Individuals admitted from a SNF were more likely to die during their hospitalization than those admitted from the community or other setting (data not shown). In 2010, 28.0 percent of patients admitted from a SNF died during the hospitalization compared to 19.8 percent of those admitted from other settings. Note Coding practices may have changed in the time period covered by this study. The extent to which these changes may have affected observed trends is unclear. Data Source The estimates in this Statistical Brief are based upon a readmission analysis file created using the Healthcare Cost and Utilization Project (HCUP) 2005 and 2010 State Inpatient Databases (SID) from seven States: Arizona, California, Florida, Nebraska, New York, Utah, and Washington. States were selected based on the availability of reliable, verified synthetic patient identifiers that can be used to track a person across time and hospitals. Definitions Diagnoses, ICD-9-CM, and Clinical Classifications Software (CCS) The principal diagnosis is that condition established after study to be chiefly responsible for the patient's admission to the hospital. Secondary diagnoses are concomitant conditions that coexist at the time of admission or that develop during the stay.For purposes of this study, admissions with a principal and secondary septicemia diagnosis are classified as principal septicemia in order to avoid double counts. ICD-9-CM is the International Classification of Diseases, Ninth Revision, Clinical Modification, which assigns numeric codes to diagnoses. There are about 14,000 ICD-9-CM diagnosis codes. CCS categorizes ICD-9-CM diagnoses into a manageable number of clinically meaningful categories5. This "clinical grouper" makes it easier to quickly understand patterns of diagnoses. CCS categories identified as "Other" are typically not reported; these categories include miscellaneous, otherwise unclassifiable diagnoses that may be difficult to interpret as a group. Case definition Admissions with a septicemia diagnosis were identified as those with a single-level CCS diagnosis category = 2, and included the following ICD-9-CM codes: 003.1, 020.2, 022.3, 036.2, 038.0, 038.1, 038.10, 038.11, 038.12, 038.19, 038.2, 038.3, 038.40, 038.41, 038.42, 038.43, 038.44, 038.49, 038.8, 038.9, 054.5, 449, 771.81, and 790.7. Because the algorithm that individual States use to generate encrypted identifiers may vary across years, it was not possible to track individuals over a fixed window of time. Therefore, analyses were limited to individual experiences during calendar year 2005 and 2010. Readmissions Any cause 30-day readmissions were identified as any admission that occurred up to 30 days following discharge for the index hospitalization. In other words, patients with a septicemia index hospitalization who were discharged alive were followed for a period of 30 days. If another admission to the same or a different hospital (for any diagnosis) occurred during this time period, a readmission indicator was set to "1". If more than one discharge occurred during this time frame, only one readmission was counted. Transfers to another hospital that occurred on the same day as the discharge for the index admission were not counted as a readmission. Multiple (2+ septicemia admissions) Individuals with multiple septicemia admissions were identified as any patient with a principal or secondary septicemia diagnosis (as appropriate to the analysis) who experienced one or more hospitalizations with a septicemia principal or secondary diagnosis during the calendar year. With the exception that the second admission had to occur during the same calendar year, no restriction was placed on the number of days between the index hospitalization and the following septicemia admission. Types of hospitals included in HCUP HCUP is based on data from community hospitals, which are defined as short-term, non-Federal, general and other hospitals, excluding hospital units of other institutions (e.g., prisons). HCUP data include obstetrics and gynecology, otolaryngology, orthopedic, cancer, pediatric, public, and academic medical hospitals. Excluded are long-term care, rehabilitation, psychiatric, and alcoholism and chemical dependency hospitals. However, if a patient received long-term care, rehabilitation, or treatment for psychiatric or chemical dependency conditions in a community hospital, the admission record for that stay will be included in the Nationwide Inpatient Sample (NIS). Unit of analysis The units of analysis in this Statistical Brief are the hospital admission (i.e., the hospital stay) and the person or patient. The former means that a person who is admitted to the hospital multiple times in one year will be counted each time as a separate "admission" to a hospital. The latter means that a person who is admitted to the hospital multiple times during the year is counted only once. Individuals represented in these analyses include those aged 18 years or older. Payer Payer is the expected primary payer for the hospital stay. To make coding uniform across all HCUP data sources, payer combines detailed categories into general groups:
Encounters billed to the State Children's Health Insurance Program (SCHIP) may be included here. They may be classified as Medicaid, Private Insurance, or Other, depending on the structure of the State program. Because most State data do not identify SCHIP patients specifically, it is not possible to present this information separately. When more than one payer is listed for a hospital admission, the first-listed payer is used. Admission source or point of origin Admission source (now known as patient's point of origin) indicates where the patient was located prior to admission to the hospital. Emergency admission indicates that the patient was admitted to the hospital through the emergency department. Admission from another hospital indicates that the patient was admitted to this hospital from another short-term, acute-care hospital. This usually signifies that the patient required the transfer in order to obtain more specialized services that the originating hospital could not provide. Admission from a long-term care facility indicates that the patient was admitted from a long-term facility such as a nursing home. Discharge status Discharge status reflects the disposition of the patient at discharge from the hospital and includes the following six categories: routine (to home); transfer to another short-term hospital; other transfers (including skilled nursing facility, intermediate care, and another type of facility such as a nursing home); home healthcare; against medical advice (AMA); or died in the hospital. About HCUP HCUP is a family of powerful healthcare databases, software tools, and products for advancing research. Sponsored by the Agency for Healthcare Research and Quality (AHRQ), HCUP includes the largest all-payer encounter-level collection of longitudinal healthcare data (inpatient, ambulatory surgery, and emergency department) in the United States, beginning in 1988. HCUP is a Federal-State-Industry Partnership that brings together the data collection efforts of many organizations—such as State data organizations, hospital associations, private data organizations, and the Federal government—to create a national information resource. HCUP would not be possible without the contributions of the following data collection Partners from across the United States: Alaska State Hospital and Nursing Home Association Arizona Department of Health Services Arkansas Department of Health California Office of Statewide Health Planning and Development Colorado Hospital Association Connecticut Hospital Association Florida Agency for Health Care Administration Georgia Hospital Association Hawaii Health Information Corporation Illinois Department of Public Health Indiana Hospital Association Iowa Hospital Association Kansas Hospital Association Kentucky Cabinet for Health and Family Services Louisiana Department of Health and Hospitals Maine Health Data Organization Maryland Health Services Cost Review Commission Massachusetts Center for Health Information and Analysis Michigan Health & Hospital Association Minnesota Hospital Association Mississippi Department of Health Missouri Hospital Industry Data Institute Montana MHA - An Association of Montana Health Care Providers Nebraska Hospital Association Nevada Department of Health and Human Services New Hampshire Department of Health & Human Services New Jersey Department of Health New Mexico Department of Health New York State Department of Health North Carolina Department of Health and Human Services North Dakota (data provided by the Minnesota Hospital Association) Ohio Hospital Association Oklahoma State Department of Health Oregon Association of Hospitals and Health Systems Oregon Health Policy and Research Pennsylvania Health Care Cost Containment Council Rhode Island Department of Health South Carolina Budget & Control Board South Dakota Association of Healthcare Organizations Tennessee Hospital Association Texas Department of State Health Services Utah Department of Health Vermont Association of Hospitals and Health Systems Virginia Health Information Washington State Department of Health West Virginia Health Care Authority Wisconsin Department of Health Services Wyoming Hospital Association About the SID The HCUP State Inpatient Databases (SID) are hospital inpatient databases from data organizations participating in HCUP. The SID contain the universe of the inpatient discharge abstracts in the participating HCUP States, translated into a uniform format to facilitate multistate comparisons and analyses. Together, the SID encompass more than 95 percent of all U.S. community hospital discharges in 2009. The SID can be used to investigate questions unique to one State, to compare data from two or more States, to conduct market area variation analyses, and to identify State-specific trends in inpatient care utilization, access, charges, and outcomes. For More Information For more information about HCUP, visit http://www.hcup-us.ahrq.gov/. For additional HCUP statistics, visit HCUPnet, our interactive query system, at https://datatools.ahrq.gov/hcupnet. For information on other hospitalizations in the United States, download HCUP Facts and Figures: Statistics on Hospital-Based Care in the United States in 2009, located at http://www.hcup-us.ahrq.gov/reports.jsp. For a detailed description of HCUP, more information on the design of the Nationwide Inpatient Sample (NIS), and methods to calculate estimates, please refer to the following publications: Introduction to the HCUP Nationwide Inpatient Sample, 2009. Online. May 2011. U.S. Agency for Healthcare Research and Quality. http://hcup-us.ahrq.gov/db/nation/nis/NIS_2009_INTRODUCTION.pdf. Accessed August 7, 2013. Introduction to the HCUP Nationwide Emergency Department Sample, 2009. Online. September 2011. U.S. Agency for Healthcare Research and Quality. http://hcup-us.ahrq.gov/db/nation/neds/NEDS2009Introductionv3.pdf. Accessed August 7, 2013. Houchens R, Elixhauser A. Final Report on Calculating Nationwide Inpatient Sample (NIS) Variances, 2001. HCUP Methods Series Report #2003-2. Online. June 2005 (revised June 6, 2005). U.S. Agency for Healthcare Research and Quality. http://www.hcup-us.ahrq.gov/reports/methods/2003_02.pdf. Accessed July 22, 2013. Houchens RL, Elixhauser A. Using the HCUP Nationwide Inpatient Sample to Estimate Trends. (Updated for 1988–2004). HCUP Methods Series Report #2006–05. Online. August 18, 2006. U.S. Agency for Healthcare Research and Quality. http://www.hcup-us.ahrq.gov/reports/methods/2006_05_NISTrendsReport_1988-2004.pdf. Accessed August 7, 2013. Acknowledgements The authors would like to thank Valeriy Bakaushin for programming assistance and Tyler Oberlander for support in the production of the brief. Suggested Citation Sutton J (Social & Scientific Systems, Inc.), Friedman B (AHRQ). Trends in Septicemia Hospitalizations and Readmissions in Selected HCUP States, 2005 and 2010. HCUP Statistical Brief #161. September 2013. Agency for Healthcare Research and Quality, Rockville, MD. http://www.hcup-us.ahrq.gov/reports/statbriefs/sb161.pdf. *** AHRQ welcomes questions and comments from readers of this publication who are interested in obtaining more information about access, cost, use, financing, and quality of healthcare in the United States. We also invite you to tell us how you are using this Statistical Brief and other HCUP data and tools, and to share suggestions on how HCUP products might be enhanced to further meet your needs. Please e-mail us at hcup@ahrq.gov or send a letter to the address below:Irene Fraser, Ph.D., Director Center for Delivery, Organization, and Markets Agency for Healthcare Research and Quality 540 Gaither Road Rockville, MD 20850 1 Martin GS. Sepsis, severe sepsis and septic shock: changes in incidence, pathogens and outcomes. Expert Review of Anti-Infective Therapy. 2012;10(6):701-6. 2 Lagu T, Rothberg M, Shieh M, Pekow P, Steingrub J, Lindenaur P. Hospitalizations, costs and outcomes of severe septicemia in the United States, 2003 and 2007. Critical Care Medicine. 2012;40(3):754–61. 3 National Institutes of Health, National Institute of General Medical Sciences. Sepsis Fact Sheet. Updated June 12, 2013. http://www.nigms.nih.gov/Education/Pages/factsheet_sepsis.aspx. Accessed August 7, 2013. 4 Elixhauser A, Friedman B, Stranges E. Septicemia in U.S. Hospitals, 2009. HCUP Statistical Brief #122. October 2011. Rockville, MD: Agency for Healthcare Research and Quality. http://www.hcup-us.ahrq.gov/reports/statbriefs/sb122.pdf. Accessed August 7, 2013. 5 HCUP Clinical Classifications Software (CCS). Healthcare Cost and Utilization Project (HCUP). U.S. Agency for Healthcare Research and Quality, Rockville, MD. Updated March 2013. http://www.hcup-us.ahrq.gov/toolssoftware/ccs/ccs.jsp. Accessed August 7, 2013. |