STATISTICAL BRIEF #173 |
May 2014
Jennifer E. Moore, Ph.D., R.N., Whitney P. Witt, Ph.D., M.P.H., and Anne Elixhauser, Ph.D. Introduction Childbirth is the most prevalent reason for hospitalization in the United States.1,2 Of the 4.1 million hospital stays in 2009 involving childbirth, 91.3 percent of vaginal and 99.9 percent of cesarean section deliveries had at least one complicating condition.3 These conditions range in severity and may include those that are preexisting, such as mental health disorders; those that create risk factors, such as multiple gestation; and those that may lead to complications of care, such as an abnormality of fetal heart rate or rhythm. In the United States, childbirth accounts for about 10 percent of all maternal hospital stays and $12.4 billion in hospitalization costs for live births; it represents, in the aggregate, one of the most costly conditions for inpatient hospital care.4,5 The average cost of a vaginal birth in 2008 was $2,900 without complications and $3,800 with complications.2 The average cost of a cesarean section was $4,700 without complications and $6,500 with complications. A recent report from the Centers for Disease Control and Prevention analyzed and compared 2010 payment source data from U.S. birth certificates and the National Hospital Discharge Survey. Results showed that the most common payment source for deliveries was private insurance. However, in the past decade, privately insured deliveries have declined by 16 percent, while Medicaid-covered deliveries have increased by 40 percent.6 Type of insurance may influence the prevalence of interventions (e.g., induction of labor, cesarean section) associated with a complicating condition and mode of delivery.6,7 This Statistical Brief presents data from the Healthcare Cost and Utilization Project (HCUP) Nationwide Inpatient Sample (NIS) on the source of payment for pregnancy and childbirth hospitalizations with complicating conditions versus without complicating conditions by mode of delivery in 2011. We examine stays for vaginal and cesarean section deliveries and compare rates of complicating conditions by expected payer type (Medicaid versus private insurance). All data are reported from the maternal perspective (i.e., reflecting the experience of the mother, not the newborn) among women who had a hospital delivery in 2011. |
|
Patient characteristics, hospital utilization, and source of payment for hospital stays are presented for hospital stays involving complicated and uncomplicated vaginal and cesarean section deliveries. Differences between women who were primiparous (giving birth for the first time) and multiparous (giving birth for the second or more times) were not analyzed because the data do not provide this level of detail. During an individual stay, multiple complicating conditions may be identified through the principal diagnosis or through secondary diagnoses that may influence the course of care. Because of limitations in the data, this Statistical Brief does not explicitly distinguish between preexisting conditions and complications of care. Furthermore, we acknowledge that there are known limitations in the accuracy of capturing perinatal conditions and complications through hospital coding.8,9
All differences between estimates noted in the text and tables are statistically significant at the 0.05 level or better. Clinical significance was also considered for reporting and presentation. Findings Characteristics of childbirth hospital stays, 2011 Table 1 reports select characteristics of vaginal and cesarean section deliveries for Medicaid versus private insurance in 2011. |
| Table 1. Selected characteristics of childbirth hospital stays by payer and delivery method, 2011* | ||||
| Characteristic | Medicaid | Private Insurance | ||
|---|---|---|---|---|
| Vaginal | Cesarean section | Vaginal | Cesarean section | |
| Total number of discharges | 1,129,100 | 520,400 | 1,256,800 | 677,500 |
| Childbirth stays, % | 29.6 | 13.6 | 33.0 | 17.8 |
| Delivery type by payer, % | 68.5 | 31.5 | 65.0 | 35.0 |
| Mean length of stay, days | 2.2 | 3.4 | 2.2 | 3.6 |
| Mean hospital costs, $ | 3,400 | 5,900 | 3,400 | 5,900 |
| Aggregate costs, billion $ | 3.8 | 3.1 | 4.3 | 4.0 |
| Mean patient age, years | 25 | 27 | 29 | 31 |
| Multiple gestation, n | 4,900 | 15,000 | 8,100 | 28,800 |
| Multiple gestation stays, % | 8.1 | 25.0 | 13.6 | 48.0 |
| Multiple gestation delivery type by payer, % | 24.6 | 75.4 | 22.0 | 78.0 |
| * Approximately 6 percent of childbirth stays were among women who were uninsured or covered by Medicare. Percentages do not total 100 because these data were not included. Source: Agency for Healthcare Research and Quality (AHRQ), Center for Delivery, Organization, and Markets, Healthcare Cost and Utilization Project (HCUP), Nationwide Inpatient Sample (NIS), 2011 | ||||
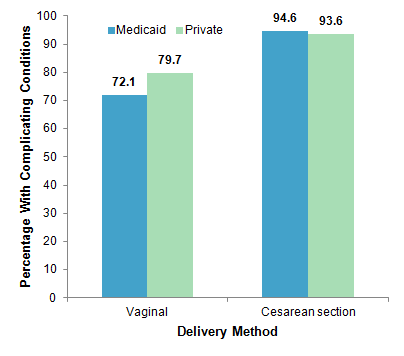
Complicating conditions by payer and delivery method, 2011 Figure 1 presents the distribution of discharges with complicating conditions by payer type and delivery method. |
|
Figure 1. Percentage of stays with presence of complicating conditions, by payer and delivery method, 2011
Source: Agency for Healthcare Research and Quality (AHRQ), Center for Delivery, Organization, and Markets, Healthcare Cost and Utilization Project (HCUP), Nationwide Inpatient Sample (NIS), 2011 Figure 1 is a bar chart showing the percentage of hospital stays involving childbirth with complicating conditions by delivery method for women covered by Medicaid versus private insurance. Vaginal delivery: Medicaid: 72.1, Private Insurance: 79.7. Cesarean section delivery: Medicaid: 94.6, Private Insurance: 93.6. Source: Agency for Healthcare Research and Quality (AHRQ), Center for Delivery, Organization, and Markets, Healthcare Cost and Utilization Project (HCUP), Nationwide Inpatient Sample (NIS), 2011. |
Rates of complicating conditions by maternal age and payer, 2011 Table 2 shows the number and rate of complications among hospital childbirth stays by maternal age, payer, and delivery method. |
| Table 2. Number and rate (per 100 discharges) of hospital childbirth stays with complicating conditions by maternal age, payer, and delivery method, 2011 | ||||||||
| Maternal age, years | Discharges with complications | |||||||
|---|---|---|---|---|---|---|---|---|
| Medicaid | Private insurance | |||||||
| Vaginal | Cesarean section | Vaginal | Cesarean section | |||||
| n | Rate | n | Rate | n | Rate | n | Rate | |
| All ages | 814,600 | 72.1 | 492,200 | 94.6 | 1,001,600 | 79.7 | 634,200 | 93.6 |
| <15 | 1,700 | 72.6 | 600 | 88.0 | 500 | 75.5 | 100 | 94.1 |
| 15-17 | 41,100 | 75.6 | 12,500 | 90.5 | 13,100 | 76.8 | 3,800 | 89.5 |
| 18-34 | 381,300 | 72.0 | 190,900 | 93.3 | 171,200 | 76.7 | 74,700 | 91.6 |
| 25-29 | 210,600 | 70.6 | 139,600 | 95.5 | 309,200 | 78.7 | 170,100 | 93.2 |
| 30-24 | 119,700 | 73.0 | 91,500 | 96.1 | 331,000 | 81.0 | 222,700 | 94.3 |
| 35-39 | 48,300 | 74.5 | 45,000 | 95.7 | 146,200 | 82.2 | 126,700 | 94.4 |
| 40-44 | 11,200 | 75.9 | 11,300 | 94.4 | 28,700 | 83.3 | 33,200 | 93.4 |
| >44 | 500 | 72.3 | 700 | 97.3 | 1,400 | 81.8 | 2,800 | 91.7 |
| Note: Principal and secondary diagnoses were examined. Source: Agency for Healthcare Research and Quality (AHRQ), Center for Delivery, Organization, and Markets, Healthcare Cost and Utilization Project (HCUP), Nationwide Inpatient Sample (NIS), 2011 | ||||||||
Common complicating conditions by delivery method and payer, 2011 Table 3 provides the rate per 1,000 deliveries for the 10 most common complicating conditions associated with childbirth stays by payer and delivery method. Conditions are sorted by frequency for patients covered by Medicaid. (Detailed tables on complicating conditions by payer and delivery type are provided in the Appendix.) |
| Table 3. Rates of the 10 most common complicating conditions by delivery method and payer, 2011 | |||||
| Medicaid | Private insurance | ||||
|---|---|---|---|---|---|
| Rank | Complicating condition | Rate per 1,000 discharges | Rank | Complicating condition | Rate per 1,000 discharges |
| Vaginal deliveries | |||||
| 1 | First-degree perineal laceration | 232 | 2 | First-degree perineal laceration | 241 |
| 2 | Second-degree perineal laceration | 178 | 1 | Second-degree perineal laceration | 314 |
| 3 | Anemia | 127 | 5 | Anemia | 73 |
| 4 | Post-term pregnancy | 127 | 3 | Post-term pregnancy | 130 |
| 5 | Abnormality in fetal heart rate or rhythm | 122 | 4 | Abnormality in fetal heart rate or rhythm | 120 |
| 6 | Preeclampsia | 58 | 6 | Preeclampsia | 57 |
| 7 | Mental disorders | 51 | 10 | Mental disorders | 31 |
| 8 | Premature rupture of membranes | 39 | 7 | Premature rupture of membranes | 43 |
| 9 | Precipitate labor | 33 | |||
| 10 | Other immediate postpartum hemorrhage | 27 | |||
| 8 | Thyroid dysfunction | 34 | |||
| 9 | Third-degree perineal laceration | 32 | |||
| Cesarean section deliveries | |||||
| 1 | Previous cesarean section | 488 | 1 | Previous cesarean section | 434 |
| 2 | Abnormality in fetal heart rate or rhythm | 202 | 2 | Abnormality in fetal heart rate or rhythm | 180 |
| 3 | Anemia | 186 | 3 | Anemia | 128 |
| 4 | Preeclampsia | 100 | 4 | Preeclampsia | 105 |
| 5 | Post-term pregnancy | 93 | 7 | Post-term pregnancy | 91 |
| 6 | Other malposition and malpresentation | 89 | 5 | Other malposition and malpresentation | 104 |
| 7 | Breech | 76 | 6 | Breech | 94 |
| 8 | Mental disorders | 59 | |||
| 9 | Fetopelvic disproportion | 45 | 9 | Fetopelvic disproportion | 48 |
| 10 | Excessive fetal growth | 41 | 8 | Excessive fetal growth | 58 |
| 10 | Thyroid dysfunction | 48 | |||
| Note: Principal and secondary diagnoses were examined. Source: Agency for Healthcare Research and Quality (AHRQ), Center for Delivery, Organization, and Markets, Healthcare Cost and Utilization Project (HCUP), Nationwide Inpatient Sample (NIS), 2011 | |||||
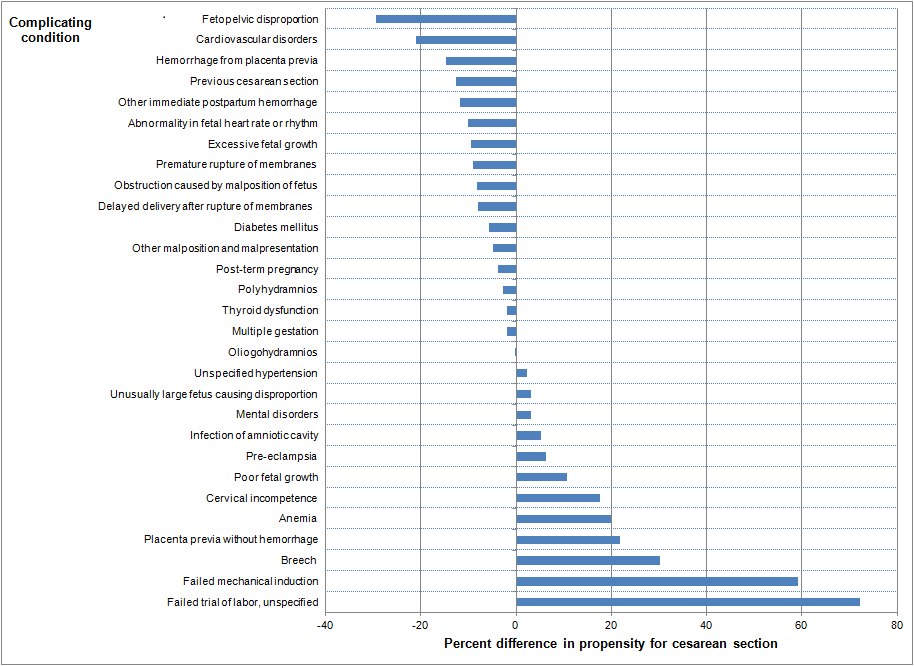
We also examined differences in prevalence rates among less common complicating conditions (see Appendix). Overall, there were very few differences in the rate of these conditions between Medicaid and private insurance for vaginal or cesarean section deliveries. There were two exceptions: thyroid dysfunction and delayed delivery after artificial rupture of membranes were each three times more common among private-payer discharges than among Medicaid-covered discharges for both types of deliveries. Propensity for cesarean section delivery comparing payer, by complicating condition, 2011 Figure 2 presents the percent difference in the propensity for having a cesarean section delivery for privately insured versus Medicaid-covered stays by complicating condition. |
|
Figure 2. Propensity for cesarean section delivery, comparing privately insured versus Medicaid-covered deliveries by complicating condition
Note: Principal and secondary diagnoses were examined. Conditions with a rate of at least 5 per 1000 for cesarean section delivery are shown. This is a tornado bar chart showing the type of complicating condition by the percent difference in propensity for cesarean section. Complicating condition: Fetopelvic disproportion: -29.43, Cardiovascular disorders: -20.97, Hemorrhage from placenta previa: -14.68, Previous cesarean section: -12.62, Other immediate postpartum hemorrhage: -11.79, Abnormality in fetal heart rate or rhythm: -10.12, Excessive fetal growth: -9.43, Premature rupture of membranes: -9.09, Obstruction caused by malposition of fetus: -8.12, Delayed delivery after rupture of membranes: -8.01, Diabetes mellitus: -5.75, Other malposition and malpresentation: -4.83, Post-term pregnancy: -3.83, Polyhydramnios: -2.63, Thyroid dysfunction: -1.95, Multiple gestation: -1.79, Oliogohydramnios: -0.25, Unspecified hypertension: 2.24, Unusually large fetus causing disproportion: 3.18, Mental disorders: 3.19, Infection of amniotic cavity: 5.29, Preeclampsia: 6.33, Poor fetal growth: 10.72, Cervical incompetence: 17.60, Anemia: 19.90, Placenta previa without hemorrhage: 21.78, Breech: 30.14, Failed mechanical induction: 59.12, Failed trial of labor, unspecified: 72.26. |
|
| Appendix. Rates of specific complicating conditions of childbirth by delivery method and payer, 2011 | ||||
| Complicating condition | Rate per 1,000 discharges | |||
|---|---|---|---|---|
| Medicaid | Private insurance | |||
| Vaginal | Cesarean section | Vaginal | Cesarean section | |
| Complications mainly related to pregnancy | ||||
| Antepartum hemorrhage, abruptio placentae, and placenta previa | ||||
| Placenta previa without hemorrhage | 0.9 | 5.8 | 1.1 | 8.4 |
| Hemorrhage from placenta previa | 0.3 | 6.3 | 0.4 | 7.1 |
| Other antepartum hemorrhage | 0.3 | 0.7 | 0.3 | 0.7 |
| Unspecified antepartum hemorrhage | 2.0 | 3.0 | 1.7 | 2.7 |
| Hypertension complicating pregnancy, childbirth, and the puerperium | ||||
| Other preexisting hypertension complicating pregnancy childbirth and the puerperium | 0.3 | 0.8 | 0.3 | 0.8 |
| Preeclampsia | 58.3 | 99.7 | 57.4 | 104.5 |
| Eclampsia | 0.4 | 1.6 | 0.3 | 1.1 |
| Unspecified hypertension complicating pregnancy childbirth or the puerperium | 4.8 | 8.1 | 4.8 | 8.3 |
| Late pregnancy | ||||
| Post-term pregnancy | 126.5 | 92.7 | 129.8 | 91.4 |
| Prolonged pregnancy | 1.1 | 1.2 | 0.8 | 1.0 |
| Other current conditions in the mother | ||||
| Diabetes mellitus | 5.3 | 20.3 | 4.6 | 16.7 |
| Thyroid dysfunction | 12.5 | 17.7 | 34.4 | 47.6 |
| Anemia | 127.4 | 186.1 | 73.3 | 128.3 |
| Mental disorders | 50.9 | 59.2 | 31.3 | 37.5 |
| Cardiovascular disorders | 4.0 | 8.1 | 5.3 | 8.5 |
| Normal delivery and other indications for care in pregnancy, labor, and delivery | ||||
| Multiple gestation | ||||
| Multiple gestation | 4.3 | 28.8 | 6.5 | 42.5 |
| Malposition and malpresentation of fetus | ||||
| Breech | 3.6 | 75.8 | 3.4 | 94.0 |
| Other malposition and malpresentation | 14.3 | 88.5 | 17.7 | 104.1 |
| Disproportion | ||||
| Fetopelvic disproportion | 0.2 | 44.6 | 0.2 | 48.2 |
| Unusually large fetus causing disproportion | 0.2 | 4.7 | 0.2 | 5.1 |
| Abnormality of organs and soft tissues of pelvis | ||||
| Previous cesarean section | 23.8 | 488.2 | 24.2 | 434.3 |
| Cervical incompetence | 3.5 | 5.4 | 3.7 | 6.7 |
| Other known or suspected fetal and placental | ||||
| Fetal distress | 0.9 | 2.3 | 1.0 | 2.2 |
| Intrauterine death | 5.2 | 3.0 | 4.2 | 2.0 |
| Poor fetal growth | 21.6 | 35.0 | 17.4 | 31.1 |
| Excessive fetal growth | 10.8 | 40.6 | 17.0 | 57.7 |
| Polyhydramnios | ||||
| Polyhydramnios | 4.9 | 14.2 | 5.9 | 16.5 |
| Other problems associated with amniotic cavity | ||||
| Oliogohydramnios | 25.4 | 40.3 | 22.8 | 36.0 |
| Premature rupture of membranes | 39.1 | 39.7 | 43.2 | 39.9 |
| Delayed delivery after spontaneous or unspecified rupture of membranes | 11.0 | 14.2 | 11.3 | 13.5 |
| Delayed delivery after artificial rupture of membranes | 0.3 | 0.3 | 0.7 | 0.9 |
| Infection of amniotic cavity | 17.0 | 29.1 | 14.3 | 25.8 |
| Other indications for care or intervention related | ||||
| Failed mechanical induction | 0.3 | 36.1 | 0.2 | 37.1 |
| Abnormality in fetal heart rate or rhythm | 121.6 | 202.4 | 120.4 | 180.2 |
| Complications occurring mainly during the course of labor and delivery | ||||
| Obstructed labor | ||||
| Obstruction caused by malposition of fetus | 0.6 | 19.4 | 0.7 | 20.2 |
| Shoulder dystocia | 21.3 | 0.6 | 20.9 | 0.7 |
| Failed trial of labor, unspecified | 0.1 | 6.8 | 0.0 | 5.7 |
| Other causes of obstructed labor | 0.1 | 0.2 | 0.0 | 0.2 |
| Unspecified obstructed labor | 0.3 | 0.4 | 0.4 | 0.5 |
| Abnormality of forces of labor | ||||
| Precipitate labor | 33.4 | 0.3 | 27.7 | 0.3 |
| Long labor | ||||
| Prolonged first stage | 1.1 | 0.7 | 1.4 | 1.1 |
| Prolonged second stage | 4.0 | 2.1 | 7.3 | 3.7 |
| Prolonged labor, unspecified | 1.9 | 1.7 | 1.8 | 1.6 |
| Trauma to perineum and vulva during delivery | ||||
| First-degree perineal laceration | 232.2 | 0.6 | 240.6 | 0.8 |
| Second-degree perineal laceration | 177.9 | 0.3 | 313.5 | 0.7 |
| Third-degree perineal laceration | 16.1 | 0.1 | 31.5 | 0.1 |
| Fourth-degree perineal laceration | 4.8 | 0.0 | 6.8 | 0.0 |
| Postpartum hemorrhage | ||||
| Third-stage hemorrhage | 3.0 | 1.5 | 3.2 | 1.5 |
| Other immediate postpartum hemorrhage | 26.7 | 21.6 | 22.9 | 16.3 |
| Delayed and secondary postpartum | 3.2 | 0.7 | 3.3 | 0.5 |
| Complications of the puerperium | ||||
| Obstetrical pulmonary embolism | ||||
| Obstetrical air embolism | 0.0 | 0.0 | 0.0 | 0.0 |
| Amniotic fluid embolism | 0.0 | 0.1 | 0.0 | 0.1 |
| Obstetrical blood-clot embolism | 0.1 | 0.3 | 0.1 | 0.2 |
| Other pulmonary embolism | 0.0 | 0.0 | ||
Data Source
The estimates in this Statistical Brief are based upon data from the HCUP 2011 Nationwide Inpatient Sample (NIS). Definitions Diagnoses, ICD-9-CM, Clinical Classifications Software (CCS), and Diagnosis-Related Groups (DRGs) The principal diagnosis is that condition established after study to be chiefly responsible for the patient's admission to the hospital. Secondary diagnoses are concomitant conditions that coexist at the time of admission or develop during the stay. ICD-9-CM is the International Classification of Diseases, Ninth Revision, Clinical Modification, which assigns numeric codes to diagnoses. There are approximately 14,000 ICD-9-CM diagnosis codes. CCS categorizes ICD-9-CM diagnoses into a manageable number of clinically meaningful categories.10 This "clinical grouper" makes it easier to quickly understand patterns of diagnoses. CCS categories identified as "Other" typically are not reported; these categories include miscellaneous, otherwise unclassifiable diagnoses that may be difficult to interpret as a group. DRGs comprise a patient classification system that categorizes patients into groups that are clinically coherent and homogeneous with respect to resource use. DRGs group patients according to diagnosis, type of treatment (procedures), age, and other relevant criteria. Each hospital stay has one assigned DRG. For the purpose of this Brief, "complicating conditions" includes selected ICD-9-CM diagnosis codes that are in the ICD-9-CM code section titled "Complications of Pregnancy, Childbirth, and the Puerperium."11 The specific ICD-9-CM diagnosis codes used to identify each type of complicating condition are provided in Table 4. |
| Table 4. ICD-9-CM codes used to define complicating conditions 12 | |||||
| Complicating condition | ICD-9-CM diagnosis codes | ||||
|---|---|---|---|---|---|
| Complications mainly related to pregnancy (640-649) | Antepartum hemorrhage, abruptio placentae, and placenta previa (641) 641.0 placenta previa without hemorrhage 641.1 hemorrhage from placenta previa 641.8 other antepartum hemorrhage 641.9 unspecified antepartum hemorrhage Hypertension complicating pregnancy, childbirth, and the puerperium 642.2 other pre-existing hypertension complicating pregnancy, childbirth, and the puerperium 642.3, 642.4, and 642.5 preeclampsia 642.6 eclampsia 642.9 unspecified hypertension complicating pregnancy, childbirth, or puerperium Late pregnancy 645.1 post-term pregnancy 645.2 prolonged pregnancy Other current conditions in the mother classifiable elsewhere, but complicating pregnancy, childbirth, or the puerperium 648.0 diabetes mellitus 648.1 thyroid dysfunction 648.2 anemia 648.4 mental disorders 648.5 and 648.6 cardiovascular disorders |
||||
| Normal delivery and other indications for care in pregnancy, labor, and delivery 650-659) | Multiple gestation 651.0, 651.1, and 651.2 multiple gestation Malposition and malpresentation of fetus 652.1 and 652.2 breech 652.0, 652.3, 652.4, 652.5, 652.6, 652.7, 652.8, and 652.9 other malposition and malpresentation Disproportion 653.4 fetopelvic disproportion 653.5 unusually large fetus causing disproportion Abnormality of organs and soft tissues of pelvis 654.2 previous cesarean delivery 654.5 cervical incompetence Other known or suspected fetal and placental problems affecting management of mother 656.3 fetal distress 656.4 intrauterine death 656.5 poor fetal growth 656.6 excessive fetal growth Polyhydramnios 657 polyhydramnios Other problems associated with amniotic cavity and membranes 658.0 oligohydramnios 658.1 premature rupture of membranes 658.2 delayed delivery after spontaneous or unspecified rupture of membranes 658.3 delayed delivery after artificial rupture of membranes 658.4 infection of amniotic cavity |
||||
| Normal delivery and other indications for care in pregnancy, labor, and delivery (650-659) | Other Indications for Care or Intervention Related to Labor and Delivery 659.0 and 659.1 failed mechanical induction 659.7 abnormality in fetal heart rate or rhythm |
||||
| Complications occurring mainly in the course of labor and delivery (660-669) | Obstructed labor 660.0 obstruction caused by malposition of fetus at onset of labor 660.4 shoulder dystocia 660.6 failed trial of labor, unspecified 660.8 other causes of obstructed labor 660.9 unspecified obstructed labor Abnormality of forces of labor 661.3 precipitate labor Long labor 662.0 prolonged first stage 662.1 prolonged labor, unspecified 662.2 prolonged second stage Trauma to perineum and vulva during delivery 664.0 first-degree perineal laceration 664.1 second-degree perineal laceration 664.2 third-degree perineal laceration 664.3 fourth-degree perineal laceration Postpartum hemorrhage 666.0 third-stage hemorrhage 666.1 other immediate postpartum hemorrhage 666.2 delayed and secondary postpartum hemorrhage |
||||
| Complications of the puerperium (670-677) | Obstetrical pulmonary embolism 673.0 obstetrical air embolism 673.1 amniotic fluid embolism 673.2 obstetrical blood-clot embolism 673.8 other pulmonary embolism |
||||
Case definition Analyses presented in this Statistical Brief were limited to childbirth-related hospital discharges that resulted in a delivery. Mode of delivery was defined by DRG as follows:
HCUP is based on data from community hospitals, which are defined as short-term, non-Federal, general, and other hospitals, excluding hospital units of other institutions (e.g., prisons). HCUP data include obstetrics and gynecology, otolaryngology, orthopedic, cancer, pediatric, public, and academic medical hospitals. Excluded are long-term care, rehabilitation, psychiatric, and alcoholism and chemical dependency hospitals. However, if a patient received long-term care, rehabilitation, or treatment for psychiatric or chemical dependency conditions in a community hospital, the discharge record for that stay will be included in the Nationwide Inpatient Sample (NIS). Unit of analysis The unit of analysis is the hospital discharge (i.e., the hospital stay), not a person or patient. This means that a person who is admitted to the hospital multiple times in one year will be counted each time as a separate "discharge" from the hospital. Costs and charges Total hospital charges were converted to costs using HCUP Cost-to-Charge Ratios based on hospital accounting reports from the Centers for Medicare & Medicaid Services (CMS).13 Costs will reflect the actual expenses incurred in the production of hospital services, such as wages, supplies, and utility costs; charges represent the amount a hospital billed for the case. For each hospital, a hospital-wide cost-to-charge ratio is used. Hospital charges reflect the amount the hospital billed for the entire hospital stay and do not include professional (physician) fees. For the purposes of this Statistical Brief, costs are reported to the nearest hundred. Payer Payer is the expected primary payer for the hospital stay. To make coding uniform across all HCUP data sources, payer combines detailed categories into general groups:
For this Statistical brief, approximately six percent of childbirth stays were from women who were uninsured or insured through Medicare or some other payer. These data were not included in the main sample (see additional information in Table 1). When more than one payer is listed for a hospital discharge, the first-listed payer is used. About HCUP The Healthcare Cost and Utilization Project (HCUP, pronounced "H-Cup") is a family of healthcare databases and related software tools and products developed through a Federal-State-Industry partnership and sponsored by the Agency for Healthcare Research and Quality (AHRQ). HCUP databases bring together the data collection efforts of State data organizations, hospital associations, private data organizations, and the Federal government to create a national information resource of encounter-level healthcare data (HCUP Partners). HCUP includes the largest collection of longitudinal hospital care data in the United States, with all-payer, encounter-level information beginning in 1988. These databases enable research on a broad range of health policy issues, including cost and quality of health services, medical practice patterns, access to healthcare programs, and outcomes of treatments at the national, State, and local market levels. HCUP would not be possible without the contributions of the following data collection Partners from across the United States: Alaska State Hospital and Nursing Home Association Arizona Department of Health Services Arkansas Department of Health California Office of Statewide Health Planning and Development Colorado Hospital Association Connecticut Hospital Association Florida Agency for Health Care Administration Georgia Hospital Association Hawaii Health Information Corporation Illinois Department of Public Health Indiana Hospital Association Iowa Hospital Association Kansas Hospital Association Kentucky Cabinet for Health and Family Services Louisiana Department of Health and Hospitals Maine Health Data Organization Maryland Health Services Cost Review Commission Massachusetts Center for Health Information and Analysis Michigan Health & Hospital Association Minnesota Hospital Association Mississippi Department of Health Missouri Hospital Industry Data Institute Montana MHA - An Association of Montana Health Care Providers Nebraska Hospital Association Nevada Department of Health and Human Services New Hampshire Department of Health & Human Services New Jersey Department of Health New Mexico Department of Health New York State Department of Health North Carolina Department of Health and Human Services North Dakota (data provided by the Minnesota Hospital Association) Ohio Hospital Association Oklahoma State Department of Health Oregon Association of Hospitals and Health Systems Oregon Health Policy and Research Pennsylvania Health Care Cost Containment Council Rhode Island Department of Health South Carolina Budget & Control Board South Dakota Association of Healthcare Organizations Tennessee Hospital Association Texas Department of State Health Services Utah Department of Health Vermont Association of Hospitals and Health Systems Virginia Health Information Washington State Department of Health West Virginia Health Care Authority Wisconsin Department of Health Services Wyoming Hospital Association About Statistical Briefs HCUP Statistical Briefs are descriptive summary reports presenting statistics on hospital inpatient and emergency department use and costs, quality of care, access to care, medical conditions, procedures, patient populations, and other topics. The reports use HCUP administrative healthcare data. About the NIS The HCUP Nationwide Inpatient Sample (NIS) is a nationwide database of hospital inpatient stays. The NIS is nationally representative of all community hospitals (i.e., short-term, non-Federal, nonrehabilitation hospitals). The NIS is a sample of hospitals and includes all patients from each hospital, regardless of payer. It is drawn from a sampling frame that contains hospitals comprising more than 95 percent of all discharges in the United States. The vast size of the NIS allows the study of topics at the national and regional levels for specific subgroups of patients. In addition, NIS data are standardized across years to facilitate ease of use. For More Information For more information about HCUP, visit http://www.hcup-us.ahrq.gov/. For additional HCUP statistics, visit HCUPnet, our interactive query system, at https://datatools.ahrq.gov/hcupnet. For information on other hospitalizations in the United States, refer to the following HCUP Statistical Briefs located at http://www.hcup-us.ahrq.gov/reports/statbriefs/statbriefs.jsp:
For a detailed description of HCUP, more information on the design of the Nationwide Inpatient Sample (NIS), and methods to calculate estimates, please refer to the following publications: Introduction to the HCUP Nationwide Inpatient Sample, 2009. Online. May 2011. U.S. Agency for Healthcare Research and Quality. http://hcup-us.ahrq.gov/db/nation/nis/NIS_2009_INTRODUCTION.pdf. Accessed April 18, 2014. Houchens R, Elixhauser A. Final Report on Calculating Nationwide Inpatient Sample (NIS) Variances, 2001. HCUP Methods Series Report #2003-2. Online. June 2005 (revised June 6, 2005). U.S. Agency for Healthcare Research and Quality. http://www.hcup-us.ahrq.gov/reports/methods/2003_02.pdf. Accessed April 18, 2014. Suggested Citation Moore JE (AHRQ), Witt WP (Truven Health Analytics), Elixhauser A (AHRQ). Complicating Conditions Associated With Childbirth, by Delivery Method and Payer, 2011. HCUP Statistical Brief #173. May 2014. Agency for Healthcare Research and Quality, Rockville, MD. http://www.hcup-us.ahrq.gov/reports/statbriefs/sb173-Childbirth-Delivery-Complications.pdf. Acknowledgments The authors would like to acknowledge the contributions of Nils Nordstrand and Maris Watkins of Truven Health Analytics and of Joani Slager, DNP, CNM, CPC, FACNM of Bronson Healthcare. *** AHRQ welcomes questions and comments from readers of this publication who are interested in obtaining more information about access, cost, use, financing, and quality of healthcare in the United States. We also invite you to tell us how you are using this Statistical Brief and other HCUP data and tools, and to share suggestions on how HCUP products might be enhanced to further meet your needs. Please e-mail us at hcup@ahrq.gov or send a letter to the address below:Irene Fraser, Ph.D., Director Center for Delivery, Organization, and Markets Agency for Healthcare Research and Quality 540 Gaither Road Rockville, MD 20850 1 Hall MJ, DeFrances CJ, Williams SN, Golosinskiy A, Schwartzman A. National Hospital Discharge Survey: 2007 Summary. Natlonal Health Statistics Report No. 29. Hyattsville, MD: National Center for Health Statistics; October 2010. 2 Podulka J, Stranges E, Steiner C. Hospitalizations Related to Childbirth, 2008. HCUP Statistical Brief #110. April 2011. Agency for Healthcare Research and Quality. Rockville, MD. 3 Stranges E, Wier LM, Elixhauser A. Complicating Conditions of Vaginal Deliveries and Cesarean Sections, 2009. HCUP Statistical Brief #131. May 2012. Agency for Healthcare Research and Quality. Rockville, MD. 4 Torio CM, Andrews RM. National Inpatient Hospital Costs: The Most Expensive Conditions by Payer, 2011. HCUP Statistical Brief #160. August 2013. Agency for Healthcare Research and Quality. Rockville, MD. 5 Rank order of major diagnostic category by aggregate costs, 2011. HCUPnet. Agency for Healthcare Research and Quality. Rockville, MD. https://datatools.ahrq.gov/hcupnet/#query/eyJBTkFMWVNJU19UWVBFIjpbIkFUX1IiXSwiT1VUQ09NRV9NRUFTVVJFUyI6WyJPTV9BQ09fUiJdLCJZRUFSUyI6WyJZUl8yMDExIl0sIkNBVEVHT1JJWkFUSU9OX1RZUEUiOlsiQ1RfTURDIl0sIkRBVEFTRVRfU09VUkNFIjpbIkRTX05JUyJdfQ==. Accessed April 18, 2018. 6 Curtin SC, Osterman MJ, Uddin SF, Sutton SR, Reed PR. Source of Payment for the Delivery: Births in a 33-State and District of Columbia Reporting Area, 2010. National Vital Statistics Reports, Vol. 62, No. 5. Hyattsville, MD: National Center for Health Statistics; December 2013. 7 Kozhimannil KB, Shippee TP, Adegoke O, Vemig BA. Trends in hospital-based childbirth care: the role of health insurance. Am J Manag Care. 2013 Apr;19(4):e125-32. 8 Heisler CA, Melton LJ, 3rd, Weaver AL, Gebhart JB. Determining perioperative complications associated with vaginal hysterectomy: code classification versus chart review. J Am Coll Surg. 2009 Jul;209(1):119-22. 9 Yasmeen S, Romano PS, Schembri ME, Keyzer JM, Gilbert WM. Accuracy of obstetric diagnoses and procedures in hospital discharge data. Am J Obstet Gynecol. 2006 Apr;194(4):992-1001. 10 HCUP Clinical Classifications Software (CCS). Healthcare Cost and Utilization Project (HCUP). U.S. Agency for Healthcare Research and Quality, Rockville, MD. Updated April 2014. http://www.hcup-us.ahrq.gov/toolssoftware/ccs/ccs.jsp. Accessed April 18, 2014. 11 Complications Mainly Related To Pregnancy (640-649); Normal Delivery and Other Indications for Care in Pregnancy, Labor, and Delivery (650-659); Complications Occurring Mainly in the Course of Labor and Delivery (660-669); and Complications of the Puerperium (670-677). See http://www.icd9data.com/2013/Volume1/630-679/default.htm. 12 The American College of Obstetricians and Gynecologists. Clinical Management Guidelines for Obstetricians and Gynecologists. Practice Bulletin; April 2014. http://www.acog.org/~/media/List%20of%20Titles/PBListOfTitles.pdf?dmc=1&ts=20140320T1329103747. 13 HCUP Cost-to-Charge Ratio Files (CCR). Healthcare Cost and Utilization Project (HCUP). 2001-2009. U.S. Agency for Healthcare Research and Quality, Rockville, MD. Updated August 2013. http://www.hcup-us.ahrq.gov/db/state/costtocharge.jsp. Accessed January 29, 2013. |