STATISTICAL BRIEF #183 |
November 2014
Claudia A. Steiner, M.D., M.P.H., Marguerite L. Barrett, M.S., Audrey J. Weiss, Ph.D., and Roxanne M. Andrews, Ph.D. Introduction Approximately one in four American adults and two-thirds of Medicare beneficiaries have multiple chronic conditions (MCC).1 Patients with MCC are those who have two or more chronic conditions at the same time—for instance, diabetes and hypertension, or arthritis and osteoporosis. The U.S. Department of Health and Human Services (HHS) has established an initiative specifically focused on the prevention and management of MCC.2 Steiner and Friedman (2013) reported that nearly three-fourths of adult patients hospitalized in the United States in 2009 had MCC.3 Patients with MCC had higher in-hospital mortality rates, longer lengths of stay in the hospital, and higher average hospital costs compared with patients without MCC. The researchers also found that hospitalizations involving MCC differed by age, with older adults substantially more likely to have MCC (68 percent of patients aged 45-64 years and 87 percent of patients aged 65 years and older) compared with younger adults (37 percent of patients aged 18-44 years). In this Healthcare Cost and Utilization Project (HCUP) Statistical Brief, we use historical inpatient data from 2003 through 2012 along with early 2013 data from nine HCUP States to develop national quarterly projections of nonmaternal hospital inpatient stays and average hospital costs among adult patients with and without MCC through 2014. For patients with MCC, the percentage of stays and average hospital costs are presented by patient age group and sex, along with the average annual percentage change over time. Differences greater than 10 percent between annual weighted estimates are noted in the text. Because analyses in this Statistical Brief are based on all discharges from all States weighted to a national level, the values may differ slightly from results reported from the HCUP National (Nationwide) Inpatient Sample (NIS). |
|
Findings
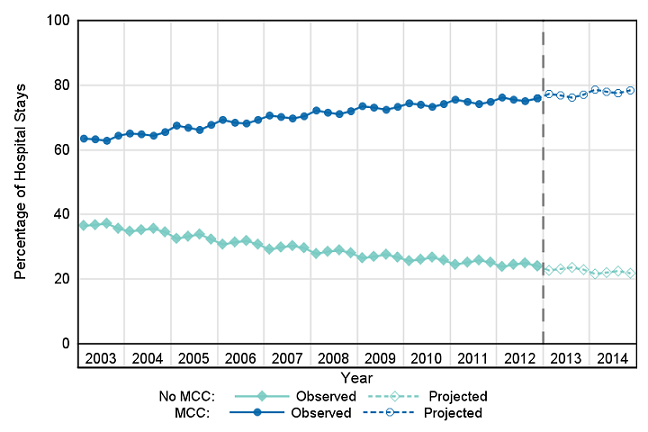
Hospital utilization and costs for adults with and without MCC, 2003-2014 Figure 1 presents trends in the percentage of nonmaternal hospital inpatient stays among adult patients with and without multiple chronic conditions (MCC) for 2003-2012 (actual values) and for 2013 and 2014 (projected values). |
|
Figure 1. Percentage of hospital inpatient stays by presence of multiple chronic conditions, 2003-2014
Abbreviation: MCC, multiple chronic conditions. Figure 1 is a line graph that shows the percentage of nonmaternal hospital stays for inpatients with and without multiple chronic conditions in actual values from 2003 to 2012 and in projected values for 2013 and 2014. The percentage of hospital stays with no major chronic conditions decreased steadily and gradually from 36.6% in first quarter 2003 to 24.0% by fourth quarter 2012; they were projected to be 22.9% in by fourth quarter 2013 and 21.7% by fourth quarter 2014. The percentage of hospital stays with major chronic conditions increased steadily and gradually from 63.4% in first quarter 2003 to 76.0% in fourth quarter 2012; they were projected to be 77.2% by fourth quarter 2013 and 78.4% by fourth quarter 2014. |
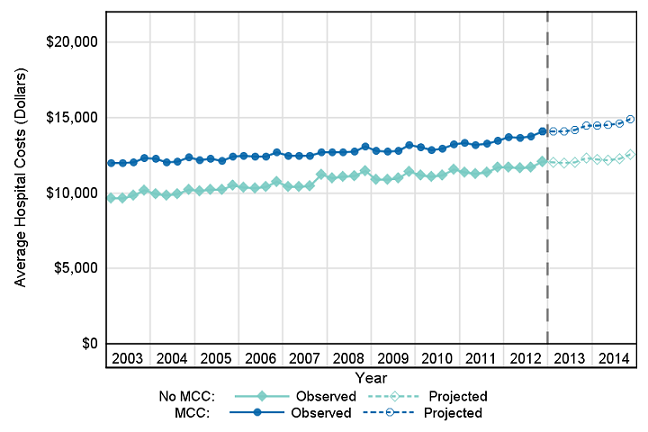
Figure 2 presents trends in the cost of nonmaternal hospital inpatient stays among adult patients with and without MCC for 2003-2012 (actual values) and for 2013 and 2014 (projected values). All costs are inflation adjusted to 2014 dollars. |
|
Figure 2. Average inflation-adjusted hospital costs by presence of multiple chronic conditions, 2003-2014
Abbreviation: MCC, multiple chronic conditions. Figure 2 is a line graph that shows average hospital costs for nonmaternal hospital stays of patients with and without multiple chronic conditions in actual values 2003 to 2012 and in projected values for 2013 and 2014. All costs are inflation adjusted to 2014 dollars. Average inflation-adjusted hospital costs for patients without major chronic conditions increased steadily and gradually from $9,647 in first quarter 2003 to $12,063 in fourth quarter 2012; it was projected to be $12,336 by fourth quarter 2013 and $12,554 by fourth quarter 2014. Average inflation-adjusted costs for patients with major chronic conditions increased steadily and gradually from $11,998 in first quarter 2003 to $14,074 in fourth quarter 2012; it was projected to be $14,471 by fourth quarter 2013 and $14,872 by fourth quarter 2014. |
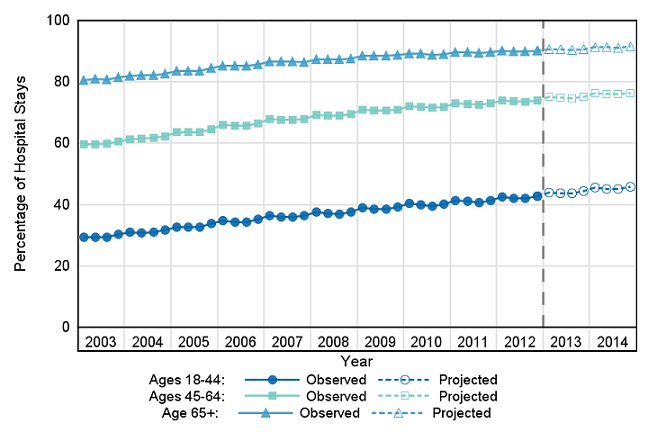
Hospital utilization and costs for adults with MCC by patient age, 2003-2014 Figure 3 presents trends in the percentage of nonmaternal hospital inpatient stays among adult patients with MCC by patient age group for 2003-2012 (actual values) and for 2013 and 2014 (projected values). |
|
Figure 3. Percentage of hospital inpatient stays among adults with multiple chronic conditions by patient age, 2003-2014
Note: The denominator used to calculate each age-specific percentage with multiple chronic conditions (MCC) was all nonmaternal, adult hospital stays for that age group. For any given point in time, the sum of the percentages with MCC across all age groups does not equal 100 because only the percentages of stays for patients with MCC are presented for each age group (the percentages of stays for patients without MCC are not shown). Figure 3 is a line graph that shows the percentage of nonmaternal hospital stays of adults with multiple chronic conditions in actual values for 2003-2012 and in projected values for 2013 and 2014, broken out by patient age. The percentage of nonmaternal stays of patients with multiple chronic conditions in the 18-44 year age group grew steadily and gradually from 29.4% in first quarter 2003 to 42.8% in fourth quarter 2012 and was projected to be 44.4% by fourth quarter 2013 and 45.9% by fourth quarter 2014. The percentage of nonmaternal stays for patients with multiple chronic conditions in the 45-64 year age group grew steadily and gradually from 59.5% in first quarter 2003 to 73.9% in fourth quarter 2012 and was projected to be 75.1% by fourth quarter 2013 and 76.4% by fourth quarter 2014. The percentage of nonmaternal stays for patients with multiple chronic conditions in the 65+ year age group grew steadily and gradually from 80.6% in first quarter 2003 to 90.1% in fourth quarter 2012 and was projected to be 90.7% in fourth quarter 2013 and 91.4% in fourth quarter 2014. |
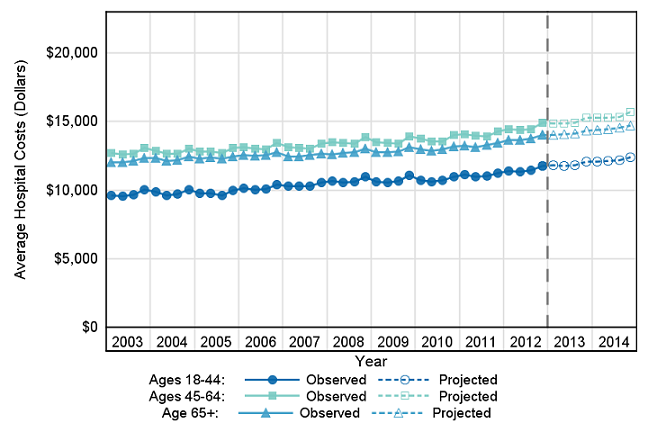
Figure 4 presents trends in the cost of nonmaternal hospital inpatient stays for adults with MCC by patient age group for 2003-2012 (actual values) and for 2013 and 2014 (projected values). All costs are inflation adjusted to 2014 dollars. |
|
Figure 4. Average inflation-adjusted hospital costs among adults with multiple chronic conditions by patient age, 2003-2014
Note: Inflation-adjusted costs are presented in 2014 dollars. Figure 4 is a line graph that shows the average inflation-adjusted hospital costs among adults with multiple chronic conditions in actual values for 2003-2012 and in projected values for 2013 and 2014. All costs are inflation adjusted to 2014 dollars. Hospital costs for patients with multiple chronic conditions in the 18-44 year age group increased steadily and gradually from $9,622 in first quarter 2003 to $11,772 in fourth quarter 2012 and was projected to be $12,104 by fourth quarter 2013 and $12,412 by fourth quarter 2014. Hospital costs for patients with multiple chronic conditions in the 45-64 year age group increased steadily and gradually from $12,690 in first quarter 2003 to $14,908 in fourth quarter 2012 and was projected to be $15,285 by fourth quarter 2013 and $15,696 by fourth quarter 2014. Hospital costs for patients with multiple chronic conditions in the 65+ year age group increased steadily and gradually from $12,052 in first quarter 2003 to $14,014 in fourth quarter 2012 and was projected to be $14,354 by fourth quarter 2013 and $14,712 by fourth quarter 2014. |
Hospital utilization and costs for adults with MCC by patient age and sex, 2003-2014 Table 1 presents the percentage of nonmaternal hospital stays and average hospital costs among adult patients with MCC by patient age group (as presented in Figures 3 and 4) and by patient sex and age group in 2003 and 2012 (actual values) and in 2014 (projected values). The average annual percentage change from 2003 to 2012 (actual change) and from 2012 to 2014 (projected change) is provided. |
| Table 1. Percentage of hospital stays and inflation-adjusted average hospital costs among adults with multiple chronic conditions by patient age and sex, 2003-2014 | |||||
| Outcome by patient characteristic | 2003 (actual) | 2012 (actual) | Average annual % change 2003-2012 | 2014 (projected) | Average annual % change 2012-2014 |
|---|---|---|---|---|---|
| Hospital stays, %a | |||||
| All adults | 63.5 | 75.7 | 2.0 | 78.1 | 1.6 |
| Age group, years, both sexes | |||||
| 18-44 | 29.6 | 42.4 | 4.1 | 45.4 | 3.5 |
| 45-64 | 59.9 | 73.8 | 2.3 | 76.2 | 1.6 |
| 65+ | 81.0 | 90.0 | 1.2 | 91.3 | 0.7 |
| Age group, years, male | |||||
| 18-44 | 33.2 | 45.0 | 3.5 | 47.8 | 3.0 |
| 45-64 | 63.7 | 76.2 | 2.0 | 78.3 | 1.4 |
| 65+ | 81.5 | 90.6 | 1.2 | 91.8 | 0.7 |
| Age group, years, female | |||||
| 18-44 | 26.6 | 39.9 | 4.6 | 42.9 | 3.7 |
| 45-64 | 56.3 | 71.3 | 2.7 | 74.0 | 1.8 |
| 65+ | 80.5 | 89.6 | 1.2 | 90.1 | 0.7 |
| Average hospital costs, inflation-adjusted $b | |||||
| All adults | 12,000 | 13,700 | 1.5 | 14,500 | 2.9 |
| Age group, years | |||||
| 18-44 | 9,700 | 11,400 | 1.9 | 12,100 | 3.1 |
| 45-64 | 12,700 | 14,500 | 1.5 | 15,300 | 2.9 |
| 65+ | 12,100 | 13,700 | 1.4 | 14,400 | 2.6 |
| Age group, years, male | |||||
| 18-44 | 10,100 | 11,800 | 1.8 | 12,500 | 2.9 |
| 45-64 | 13,500 | 15,100 | 1.3 | 15,900 | 2.6 |
| 65+ | 13,200 | 14,700 | 1.3 | 15,400 | 2.2 |
| Age group, years, female | |||||
| 18-44 | 9,300 | 11,000 | 1.9 | 11,700 | 3.0 |
| 45-64 | 11,800 | 13,700 | 1.7 | 14,700 | 3.3 |
| 65+ | 11,300 | 12,900 | 1.5 | 13,600 | 2.8 |
| a The denominator used to calculate each age-specific and sex/age-specific percentage with multiple chronic conditions (MCC) was all nonmaternal, adult hospital stays for that age or sex/age group. For any given point in time, the sum of the percentages with MCC across all age or sex/age groups does not equal 100 because only the percentages of stays for patients with MCC are presented for each age or sex/age group (the percentages of stays for patients without MCC are not shown). b Inflation-adjusted costs are presented in 2014 dollars. Note: Data from 2012 were used as end points in both the 2003-2012 and 2012-2014 analyses. Source: Agency for Healthcare Research and Quality (AHRQ), Center for Delivery, Organization, and Markets, Healthcare Cost and Utilization Project (HCUP), State Inpatient Databases (SID), 2003-2012, and early State discharge data, 2013 | |||||
Data Source The estimates in this Statistical Brief are based upon data from the Healthcare Cost and Utilization Project (HCUP) State Inpatient Databases (SID) for 2003 through 2012. The SID from 2003 through 2012 include about 341 million inpatient discharges from 47 States. At the time that these statistics were generated, we had early quarterly data for nine States for 2013. The 2013 projections incorporated observed rates for these nine States and rates estimated from time-series models for the remaining States. For 2014, the projections were based entirely on rates estimated from time-series models. National quarterly projections for 2013 and 2014 were generated using the SAS Time Series Forecasting System™ (Version 9.2).4 Projections were first calculated by State and then weighted proportionally to the nine census divisions and the nation. For each State, the software automatically selected from among 40 different time-series models the model with the lowest mean absolute percentage error (MAPE) for that State. National quarterly trends were calculated as a weighted average of the State-level quarterly trends within each division. Each State's weight was proportional to its total number of discharges (excluding newborns) as reported in the American Hospital Association (AHA) Annual Survey of Hospitals. These AHA-based weights were used throughout the 2003-2013 time period. This analysis was limited to nonmaternal hospital stays for adults aged 18 years and older. Definitions Diagnoses, ICD-9-CM, and Clinical Classifications Software (CCS) The principal diagnosis is that condition established after study to be chiefly responsible for the patient's admission to the hospital. Secondary diagnoses are concomitant conditions that coexist at the time of admission or develop during the stay. All listed diagnoses include the principal diagnosis plus these additional secondary conditions ICD-9-CM is the International Classification of Diseases, Ninth Revision, Clinical Modification, which assigns numeric codes to diagnoses. There are approximately 14,000 ICD-9-CM diagnosis codes. CCS categorizes ICD-9-CM diagnoses into a manageable number of clinically meaningful categories.5 This clinical grouper makes it easier to quickly understand patterns of diagnoses. CCS categories identified as Other typically are not reported; these categories include miscellaneous, otherwise unclassifiable diagnoses that may be difficult to interpret as a group. Case definition For this report, hospital stays for patients with multiple chronic conditions (MCC) were defined as those with two or more chronic conditions. Chronic conditions were identified using the set of chronic conditions developed by the U.S. Department of Health and Human Services (HHS) Interagency Workgroup on MCC and the Office of the Assistant Secretary of Health.6 As reported by Goodman and colleagues (2013), 20 chronic conditions were identified with definitions for five selected HHS health data systems, including the HCUP Nationwide Inpatient Sample (NIS). For the HCUP inpatient databases, the 20 chronic conditions were defined using the Agency for Healthcare Research and Quality (AHRQ) Clinical Classifications Software (CCS), which groups together highly related diagnoses of the same condition. One condition, autism spectrum disorder, was defined for the NIS using ICD-9-CM diagnosis codes rather than CCS categories. Steiner and Friedman (2013) implemented these chronic condition definitions in a recent analysis of MCC using the 2009 NIS.7 The 20 chronic conditions and corresponding clinical coding criteria are provided in Table 2. Consistent with Steiner and Friedman (2013), we identified chronic conditions on the basis of the clinical coding criteria (listed in Table 2) indicated in either a principal or a secondary diagnosis code field on the discharge record. A chronic condition was counted only once per discharge regardless of the number of diagnosis codes (principal and secondary) that indicated the condition. |
| Table 2. Chronic conditions and clinical coding criteria | |
| Chronic condition | Clinical coding criteria |
|---|---|
| Hypertension | CCS 98, 99 |
| Hyperlipidemia | CCS 53 |
| Congestive heart failure | CCS 108 |
| Coronary artery disease (CAD) (includes acute myocardial infarction, which indicates chronic underlying CAD) | CCS 100, 101 |
| Diabetes | CCS 49, 50 |
| Stroke (includes acute stroke but indicates underlying cerebrovascular disease) | CCS 109-112 |
| Cardiac arrhythmias | CCS 105, 106 |
| Arthritis | CCS 202, 203 |
| Cancer | CCS 11-43 |
| Depression | CCS 657 |
| Dementia (includes Alzheimer's and other senile dementias) | CCS 653 |
| Substance abuse disorders | CCS 660, 661 |
| Chronic obstructive pulmonary disease | CCS 127 |
| Asthma | CCS 128 |
| Chronic kidney disease | CCS 156, 158 |
| HIV | CCS 5 |
| Hepatitis | CCS 6 |
| Autism spectrum disorder | ICD-9-CM 29900, 29901 |
| Schizophrenia | CCS 659 |
| Osteoporosis | CCS 206 |
Maternal discharges were excluded from the analysis. Maternal discharges were identified as those with a major diagnostic category (MDC) code of 14, pregnancy, childbirth, and puerperium. Average annual percentage change Average annual percentage change is calculated using the following formula: Average annual percentage change is calculated using the following formula: Average annual percentage change equals open bracket, open parenthesis, end value divided by beginning value, close parenthesis, to the power of 1 divided by change in years, minus 1, close bracket, multiplied by 100. Types of hospitals included in the HCUP State Inpatient Databases This analysis used State Inpatient Databases (SID) limited to data from community hospitals, which are defined as short-term, non-Federal, general, and other hospitals, excluding hospital units of other institutions (e.g., prisons). Community hospitals include obstetrics and gynecology, otolaryngology, orthopedic, cancer, pediatric, public, and academic medical hospitals. Excluded for this analysis are long-term care facilities such as rehabilitation, psychiatric, and alcoholism and chemical dependency hospitals. However, if a patient received long-term care, rehabilitation, or treatment for psychiatric or chemical dependency conditions in a community hospital, the discharge record for that stay was included in the analysis. Unit of analysis The unit of analysis is the hospital discharge (i.e., the hospital stay), not a person or patient. This means that a person who is admitted to the hospital multiple times in 1 year will be counted each time as a separate discharge from the hospital. Costs and charges Total hospital charges were converted to costs using HCUP Cost-to-Charge Ratios based on hospital accounting reports from the Centers for Medicare & Medicaid Services (CMS).8 Costs reflect the actual expenses incurred in the production of hospital services, such as wages, supplies, and utility costs; charges represent the amount a hospital billed for the case. For each hospital, a hospital-wide cost-to-charge ratio is used. Hospital charges reflect the amount the hospital billed for the entire hospital stay and do not include professional (physician) fees. For the purposes of this Statistical Brief, costs are reported to the nearest hundred. Quarterly cost data were weighted to produce annual costs. Quarterly and annual costs were adjusted for inflation using the Gross Domestic Product (GDP) from the U.S. Department of Commerce, Bureau of Economic Analysis (BEA), with 2014 as the index base.9 That is, all costs are expressed in 2014 dollars. About HCUP The Healthcare Cost and Utilization Project (HCUP, pronounced "H-Cup") is a family of databases and related software tools and products developed through a Federal-State-Industry partnership and sponsored by the Agency for Healthcare Research and Quality (AHRQ). HCUP databases bring together the data collection efforts of State data organizations, hospital associations, and private data organizations (HCUP Partners) and the Federal government to create a national information resource of encounter-level data. HCUP includes the largest collection of longitudinal hospital care data in the United States, with all-payer, encounter-level information beginning in 1988. These databases enable research on a broad range of health policy issues, including cost and quality of health services, medical practice patterns, access to programs, and outcomes of treatments at the national, State, and local market levels. HCUP would not be possible without the contributions of the following data collection Partners from across the United States: Alaska State Hospital and Nursing Home Association Arizona Department of Health Services Arkansas Department of Health California Office of Statewide Health Planning and Development Colorado Hospital Association Connecticut Hospital Association Florida Agency for Health Care Administration Georgia Hospital Association Hawaii Health Information Corporation Illinois Department of Public Health Indiana Hospital Association Iowa Hospital Association Kansas Hospital Association Kentucky Cabinet for Health and Family Services Louisiana Department of Health and Hospitals Maine Health Data Organization Maryland Health Services Cost Review Commission Massachusetts Center for Health Information and Analysis Michigan Health & Hospital Association Minnesota Hospital Association Mississippi Department of Health Missouri Hospital Industry Data Institute Montana MHA - An Association of Montana Health Care Providers Nebraska Hospital Association Nevada Department of Health and Human Services New Hampshire Department of Health & Human Services New Jersey Department of Health New Mexico Department of Health New York State Department of Health North Carolina Department of Health and Human Services North Dakota (data provided by the Minnesota Hospital Association) Ohio Hospital Association Oklahoma State Department of Health Oregon Association of Hospitals and Health Systems Oregon Health Policy and Research Pennsylvania Health Care Cost Containment Council Rhode Island Department of Health South Carolina Revenue and Fiscal Affairs Office South Dakota Association of Healthcare Organizations Tennessee Hospital Association Texas Department of State Health Services Utah Department of Health Vermont Association of Hospitals and Health Systems Virginia Health Information Washington State Department of Health West Virginia Health Care Authority Wisconsin Department of Health Services Wyoming Hospital Association About Statistical Briefs HCUP Statistical Briefs are descriptive summary reports presenting statistics on hospital inpatient and emergency department use and costs, quality of care, access to care, medical conditions, procedures, patient populations, and other topics. The reports use HCUP administrative data. About the SID The HCUP State Inpatient Databases (SID) are hospital inpatient databases from data organizations participating in HCUP. The SID contain the universe of the inpatient discharge abstracts in the participating HCUP States, translated into a uniform format to facilitate multistate comparisons and analyses. Together, the SID encompass more than 95 percent of all U.S. community hospital discharges. The SID can be used to investigate questions unique to one State, to compare data from two or more States, to conduct market-area variation analyses, and to identify State-specific trends in inpatient care utilization, access, charges, and outcomes. For More Information For more information about HCUP, visit http://www.hcup-us.ahrq.gov/. For additional HCUP statistics, visit HCUPnet, our interactive query system, at https://datatools.ahrq.gov/hcupnet. For information on other hospitalizations in the United States, refer to the following HCUP Statistical Briefs located at http://www.hcup-us.ahrq.gov/reports/statbriefs/statbriefs.jsp:
For a detailed description of HCUP and more information on the State Inpatient Databases (SID), please refer to the following database documentation: Agency for Healthcare Research and Quality. Overview of the State Inpatient Databases (SID). Healthcare Cost and Utilization Project (HCUP). Rockville, MD: Agency for Healthcare Research and Quality. Updated September 2014. http://www.hcup-us.ahrq.gov/sidoverview.jsp. Accessed September 11, 2014. Suggested Citation Steiner CA (AHRQ), Barrett ML (M.L. Barrett, Inc.), Weiss AJ (Truven Health Analytics), Andrews RM (AHRQ). Trends and Projections in Hospital Stays for Adults With Multiple Chronic Conditions (MCC), 2003-2014. HCUP Statistical Brief #183. November 2014. Agency for Healthcare Research and Quality, Rockville, MD. http://www.hcup-us.ahrq.gov/reports/statbriefs/sb183-Hospitalizations-Multiple-Chronic-Conditions-Projections-2014.pdf. Acknowledgments The authors would like to acknowledge the contributions of Clare Sun of Truven Health Analytics. *** AHRQ welcomes questions and comments from readers of this publication who are interested in obtaining more information about access, cost, use, financing, and quality of in the United States. We also invite you to tell us how you are using this Statistical Brief and other HCUP data and tools, and to share suggestions on how HCUP products might be enhanced to further meet your needs. Please e-mail us at hcup@ahrq.gov or send a letter to the address below:Irene Fraser, Ph.D., Director Center for Delivery, Organization, and Markets Agency for Healthcare Research and Quality 540 Gaither Road Rockville, MD 20850 1 U.S. Department of Health & Human Services. HHS Initiative on Multiple Chronic Conditions. Washington, DC: U.S. Department of Health and Human Services. http://www.hhs.gov/ash/initiatives/mcc/. Accessed January 23, 2014. 2 Ibid. 3 Steiner CA, Friedman VF. Hospital utilization, costs, and mortality for adults with multiple chronic conditions, Nationwide Inpatient Sample, 2009. [Erratum appears in Preventing Chronic Disease. 2013;10.] Preventing Chronic Disease. 2013;10:120292. 4 SAS Institute Inc. Large-Scale Automatic Forecasting Using Inputs and Calendar Events. White Paper. Rockville, MD: SAS Institute Inc.; 2009. 5 Agency for Healthcare Research and Quality. HCUP Clinical Classifications Software (CCS). Healthcare Cost and Utilization Project (HCUP). Rockville, MD: Agency for Healthcare Research and Quality. Updated July 2014. http://www.hcup-us.ahrq.gov/toolssoftware/ccs/ccs.jsp. Accessed September 11, 2014. 6 Goodman RA, Posner SF, Huang ES, Parekh AK, Koh HK. Defining and measuring chronic conditions: imperatives for research, policy, program and practice. Preventing Chronic Disease. 2013;10:120239. 7 Steiner CA, Friedman BF. Hospital utilization, costs, and mortality for adults with multiple chronic conditions, Nationwide Inpatient Sample, 2009. [Erratum appears in Preventing Chronic Disease 2013;10.] Preventing Chronic Disease. 2013;10:120292. Note that the original Goodman article contained two erroneous definitions of chronic conditions as applied to the NIS: Chronic kidney disease was misidentified as CCS 108 (Congestive heart failure), and Depression was misidentified as CCS 567 (does not exist). Steiner and Friedman corrected these two definitions in the chronic conditions definition table in their article: Chronic kidney disease (CCS 156 and 158) and Depression (CCS 657). 8 Agency for Healthcare Research and Quality. HCUP Cost-to-Charge Ratio (CCR) Files. Healthcare Cost and Utilization Project (HCUP). 2001-2011. Rockville, MD: Agency for Healthcare Research and Quality. Updated August 2014. http://www.hcup-us.ahrq.gov/db/state/costtocharge.jsp. September 11, 2014. 9 U.S. Bureau of Economic Analysis. National Income and Product Account Tables, Table 1.1.4. Price Indexes for Gross Domestic Product. http://www.bea.gov/iTable/iTable.cfm?ReqID=9&step=1#reqid=9&step=1&isuri=1. Accessed June 12, 2014. Inflation adjustment figures for Quarters 2, 3, and 4 in 2014 were not available at the time of this analysis. These values were extrapolated on the basis of the average increase in the inflation adjustment factor over the 5 quarters encompassing 2013 and Quarter 1 of 2014. The 2014 annual inflation adjustment factor also was not available at the time of this analysis. This value was calculated as the average of the four 2014 quarterly inflation factors. |