STATISTICAL BRIEF #192 |
June 2015
Kathryn Fingar, Ph.D., M.P.H. and Raynard Washington, Ph.D. Introduction Asthma is a chronic inflammatory condition affecting the airways. Episodes can be triggered by a range of factors, from allergies to air pollution, leading to swelling, tightening, and secretion of mucus in the airways, which causes wheezing, coughing, chest tightness, and shortness of breath.1 Asthma is one of the most common chronic conditions in childhood, affecting 6.8 million, or 9 percent of, children aged 17 years or younger in 2012.2 Although pediatric asthma is more prevalent than diabetes, diabetes is becoming an increasingly common chronic condition among children. Children with diabetes most often have type 1 diabetes, which destroys pancreatic cells that make insulin, preventing normal regulation of blood sugar. Type 2 diabetes occurs when the body develops resistance to insulin and is more often associated with obesity. Both types of diabetes have increased among children in recent years. From 2001 to 2009, the prevalence of type 1 diabetes among youth aged 0-19 years increased from 1.5 to 1.9 per 1,000 children. Type 2 diabetes increased from 0.3 to 0.5 per 1,000 children aged 10-19 years during the same time period.3 Without proper treatment, asthma and diabetes can lead to hospitalization. Many hospital stays are potentially avoidable through regular ambulatory care by specialty and primary care physicians. Potentially preventable hospitalizations among children have declined in recent years. The rate of hospital inpatient stays for acute and chronic conditions, including asthma and diabetes, among children aged 0-17 years declined by 18 percent from 2000 to 2007, which may be a result of efforts to improve clinical guidelines and establish medical homes, as well as other initiatives.4 Despite these improvements, asthma and diabetes remain more common in certain racial and ethnic minority groups and among poor and underserved populations, who may have limited access to preventive care.5,6 Pediatric hospital inpatient stays for asthma and diabetes may have increased in more recent years because of the recession, which officially lasted from December 2007 through June 2009.7 This Healthcare Cost and Utilization Project (HCUP) Statistical Brief presents data on potentially preventable inpatient hospitalizations for asthma and diabetes with short-term complications among children aged 0-17 years, estimated using the Agency for Healthcare Research and Quality (AHRQ) Pediatric Quality Indicators (PDIs) software version 4.4. The PDIs were developed to identify hospitalizations that are potentially amenable to prevention through regular ambulatory care. We examined trends in the rates of potentially preventable pediatric visits for asthma and diabetes per 100,000 population, overall and by select patient and hospital characteristics, from 2003 to 2012. Differences greater than 10 percent are noted in the text. Findings Trends in potentially preventable pediatric hospital inpatient stays for asthma and diabetes, 2003-2012 Figure 1 presents the rate of potentially preventable hospitalizations for asthma and diabetes per 100,000 population aged 0-17 years from 2003 through 2012. |
|
|
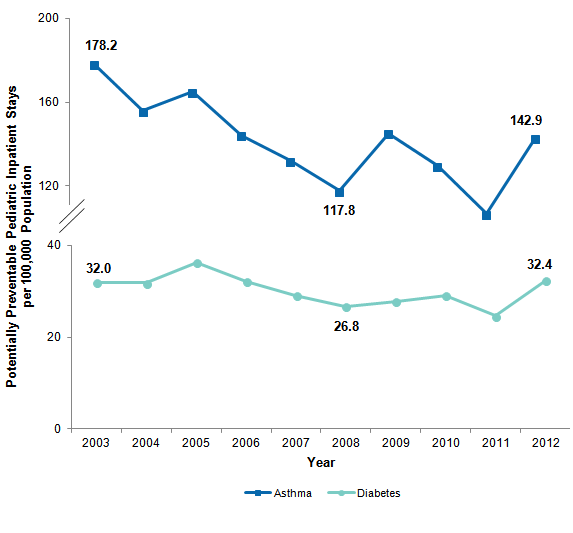
Figure 1. Rate of potentially preventable pediatric inpatient stays for asthma and diabetes, 2003-2012
Notes: Rates were adjusted by age and sex using the total U.S. resident population for 2010 as the standard population. Rates are per 100,000 children aged 0-17 years. Figure 1 is a line graph that shows the rate of potentially preventable pediatric inpatient stays for asthma and diabetes per 100,000 population from 2003 to 2012. For asthma, the rate of potentially preventable inpatient stays was 178.2 in 2003, 155.8 in 2004, 164.8 in 2005, 144.1 in 2006, 131.9 in 2007, 117.8 in 2008, 145.1 in 2009, 129.7 in 2010, 106.8 in 2011, and 142.9 in 2012. For diabetes, the rate of potentially preventable inpatient stays was 32.0 in 2003, 31.9 in 2004, 36.4 in 2005, 32.2 in 2006, 29.2 in 2007, 26.8 in 2008, 27.8 in 2009, 29.1 in 2010, 24.7 in 2011, and 32.4 in 2012. |
Figure 2 presents the aggregate inflation-adjusted total costs of potentially preventable inpatient stays for asthma and diabetes among children from 2003 through 2012. |
|
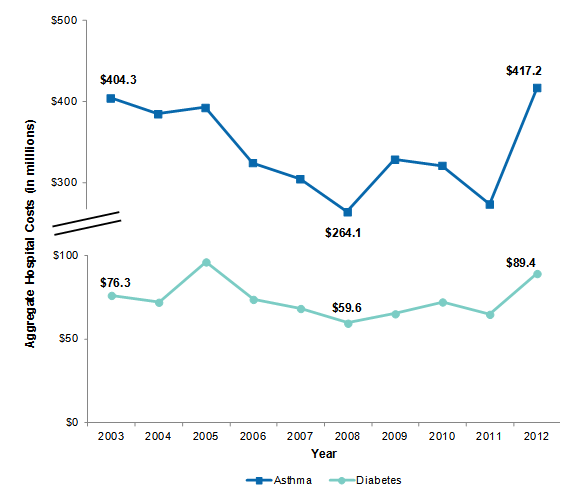
Figure 2. Aggregate inflation-adjusted costs of potentially preventable pediatric inpatient stays for asthma and diabetes, 2003-2012
Notes: All costs were inflation adjusted using the price index for the gross domestic product and are expressed in 2012 dollars. Figure 2 is a line graph that shows aggregate inflation-adjusted costs of potentially preventable pediatric inpatient stays for asthma and diabetes from 2003 to 2012.
For asthma, aggregate inflation-adjusted hospital costs for potentially preventable inpatient stays was $404.3 million in 2003, $384.9 million in 2004, $392.6 million in 2005, $324.6 million in 2006, $304.8 million in 2007, $264.1 million in 2008, $328.7 million in 2009, $321.2 million in 2010, $273.6 million in 2011, and $417.2 million in 2012. For diabetes, aggregate inflation-adjusted hospital costs for potentially preventable inpatient stays was $76.3 million in 2003, $72.2 million in 2004, $96.3 million in 2005, $73.9 million in 2006, $68.4 million in 2007, $59.6 million in 2008, $65.3 million in 2009, $72.3 million in 2010, $64.9 million in 2011, and $89.4 million in 2012.
|
Figure 3 presents the mean cost per stay of potentially preventable hospitalizations among children for asthma and diabetes from 2003 through 2012. |
|
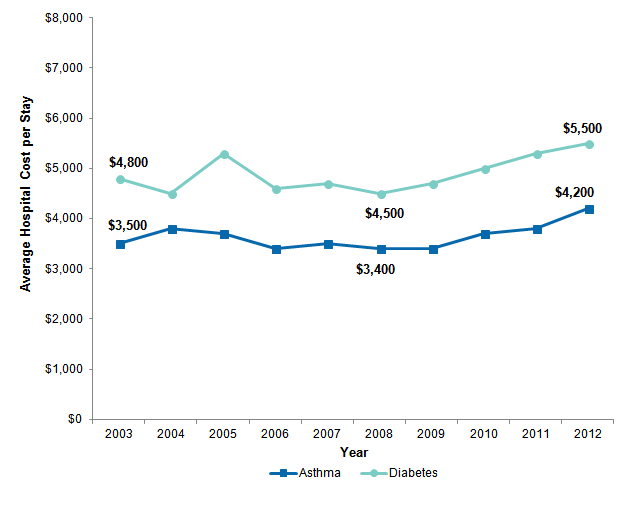
Figure 3. Average inflation-adjusted hospital cost per stay for potentially preventable pediatric inpatient stays for asthma and diabetes, 2003-2012
Notes: All costs were inflation adjusted using the price index for the gross domestic product and are expressed in 2012 dollars. Figure 3 is a line graph that shows average inflation-adjusted cost per stay for potentially preventable pediatric inpatient stays for asthma and diabetes from 2003 to 2012. For diabetes, average inflation-adjusted cost per stay for potentially preventable inpatient stays was $4,800 in 2003, $4,500 in 2004, $5,300 in 2005, $4,600 in 2006, $4,700 in 2007, $4,500 in 2008, $4,700 in 2009, $5,000 in 2010, $5,300 in 2011, and $5,500 in 2012. For asthma, average inflation-adjusted cost per stay for potentially preventable inpatient stays was $3,500 in 2003, $3,800 in 2004, $3,700 in 2005, $3,400 in 2006, $3,500 in 2007, $3,400 in 2008, $3,400 in 2009, $3,700 in 2010, $3,800 in 2011, and $4,200 in 2012.
|
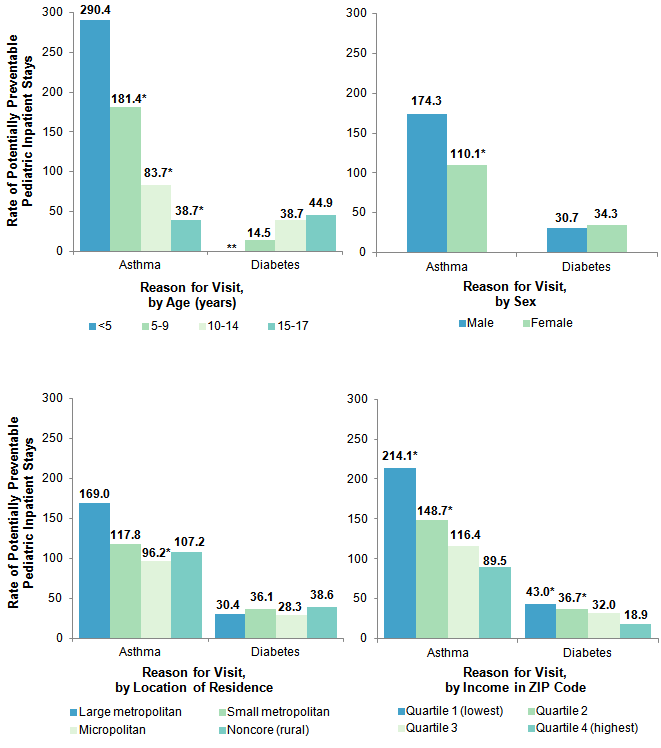
Characteristics of potentially preventable pediatric hospital inpatient stays for asthma and diabetes, 2012 Figure 4 presents the rate of pediatric hospitalizations for asthma and diabetes by select patient characteristics: age, sex, patient's location of residence, and median household income in the patient's ZIP Code of residence. |
|
Figure 4. Rate of potentially preventable pediatric inpatient stays for asthma and diabetes by patient characteristic, 2012
* p-value <0.01, when compared with the reference group: age <5 years, males, large metropolitan location, income quartile 4. Figure 4 is a set of bar charts that show the rate of potentially preventable pediatric inpatient stays and diabetes by patient characteristic for 2012. The number of inpatient stays per 100,000 for asthma by age was 290.4 for those younger than 5 years, 181.4 for those aged 5-9 years, 83.7 for those aged 10-14 years, and 38.7 for those aged 15-17 years. p<.01 for the three older age groups compared with the age <5 years reference group. The number of inpatient stays per 100,000 for diabetes by age was 14.5 for those aged 5-9 years, 38.7 for those aged 10-14 years, and 44.9 for those aged 15-17 years. Data were not calculated for children aged 0-4 years; because this age group was the reference group, p-values were not calculated for differences in diabetes rates across age groups. The number of inpatient stays per 100,000 for asthma by sex was 174.3 for males and 110.1 for females. p<.01 for females compared with the male reference group. The number of inpatient stays per 100,000 for diabetes by sex was 30.7 for males and 34.3 for females. The number of inpatient stays per 100,000 for asthma by location of residence was 169.0 for residence in a large metropolitan area, 117.8 for residence in a small metropolitan area, 96.2 for residence in a micropolitan area, and 107.2 for residence in a noncore (rural) area. p<.01 for micropolitan residence compared with the large metropolitan reference group. The number of inpatient stays per 100,000 for diabetes by location of residence was 30.4 for residence in a large metropolitan area, 36.1 for residence in a small metropolitan area, 28.3 for residence in a micropolitan area, and 38.6 for residence in a noncore (rural) area. The number of inpatient stays per 100,000 for asthma by income in ZIP Code was 214.1 for quartile 1, which was the lowest quartile; 148.7 for quartile 2; 116.4 for quartile 3; and 89.5 for quartile 4, which was the highest quartile. p<.01 for quartiles 1 and 2, compared with the quartile 4 reference group. The number of inpatient stays per 100,000 for diabetes by income in ZIP Code was 43.0 for quartile 1, which was the lowest quartile; 36.7 for quartile 2; 32.0 for quartile 3; and 18.9 for quartile 4, which was the highest quartile. p<.01 for quartiles 1 and 2, compared with the quartile 4 reference group.
|
Table 1 presents the cumulative percentage change in the rate of hospitalizations for asthma and diabetes among children from 2003 through 2012 by select patient and hospital characteristics. |
| Table 1. Rate of potentially preventable pediatric inpatient stays for asthma and diabetes by patient and hospital characteristics, 2003 and 2012 | |||||||
| Characteristic | Asthma | Diabetes | |||||
|---|---|---|---|---|---|---|---|
| Inpatient stays per 100,000 populationa | Cumulative change in rate, 2003-2012, % | Inpatient stays per 100,000 populationa | Cumulative change in rate, 2003-2012, % | ||||
| 2003 | 2012 | 2003 | 2012 | ||||
| Overall total | 178.2 | 142.9 | -19.8 | 32.0 | 32.4 | 1.2 | |
| Patient characteristics | |||||||
| Age group, years | |||||||
| <5 | 380.3 | 290.4 | -23.6 | DNC | DNC | N/A | |
| 5-9 | 195.3 | 181.4 | -7.1 | 13.3 | 14.5 | 9.3 | |
| 10-14 | 109.1 | 83.7 | -23.3 | 37.6 | 38.7 | 2.9 | |
| 15-17 | 72.8 | 38.7 | -46.9 | 46.8 | 44.9 | -4.0 | |
| Sex | |||||||
| Male | 213.1 | 174.3 | -18.2 | 26.0 | 30.7 | 17.7 | |
| Female | 141.9 | 110.1 | -22.4 | 38.4 | 34.3 | -10.6 | |
| Location (patient's residence) | |||||||
| Large metropolitan | 215.5 | 169.0 | -21.6 | 31.7 | 30.4 | -4.1 | |
| Small metropolitan | 130.5 | 117.8 | -9.8 | 30.6 | 36.1 | 18.0 | |
| Micropolitan | 132.2 | 96.2 | -27.2 | 32.0 | 28.3 | -11.7 | |
| Noncore | 152.4 | 107.2 | -29.7 | 40.8 | 38.6 | -5.5 | |
| Median household income (patient's ZIP Code) | |||||||
| Quartile 1 (lowest) | 281.7 | 214.1 | -24.0 | 39.8 | 43.0 | 8.1 | |
| Quartile 2 | 174.2 | 148.7 | -14.6 | 36.7 | 36.7 | 0.1 | |
| Quartile 3 | 143.3 | 116.4 | -18.8 | 31.3 | 32.0 | 2.4 | |
| Quartile 4 (highest) | 114.5 | 89.5 | -21.8 | 20.6 | 18.9 | -8.5 | |
| Hospital characteristics | |||||||
| Hospital region | |||||||
| Northeast | 290.9 | 179.3 | -38.4 | 29.4 | DSU | N/A | |
| Midwest | 157.6 | 185.5 | 17.8 | 33.6 | 55.5 | 65.4 | |
| South | 179.0 | 153.0 | -14.5 | 36.9 | 31.9 | -13.5 | |
| West | 114.1 | 66.4 | -41.8 | 25.4 | 14.6 | -42.5 | |
| Abbreviations: DNC, data not collected; DSU, data statistically unreliable because of a relative standard error greater than 30 percent a Rates were adjusted by age and sex using the total U.S. resident population for 2010 as the standard population; when reporting is by age, the adjustment was by sex only; when reporting is by sex, the adjustment was by age only. Stratified rates are per 100,000 children aged 0-17 years in a particular age group, sex, location of residence, income quartile, or region. Note: Although the cumulative change from 2003-2012 is presented, the trend may not be linear across intervening years. Source: Agency for Healthcare Research and Quality (AHRQ), Center for Delivery, Organization, and Markets, Healthcare Cost and Utilization Project (HCUP), Nationwide Inpatient Sample (NIS), 2003; State Inpatient Databases (SID), 2012, weighted to provide national estimates using the same methodology as the 2003 NIS; and the AHRQ Quality Indicators, version 4.4 | |||||||
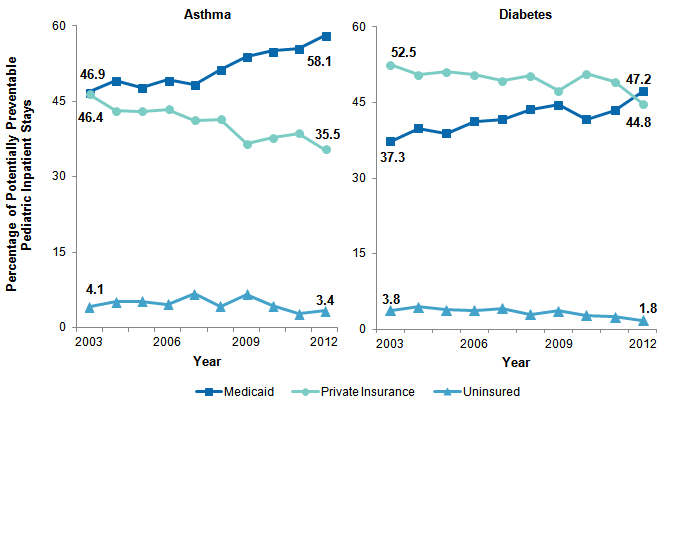
Figure 5 presents trends in the expected source of payment for asthma and diabetes potentially preventable hospitalizations among children, from 2003 through 2012. |
|
Figure 5. Potentially preventable pediatric inpatient stays for asthma and diabetes by primary expected payer, 2003-2012
Source: Agency for Healthcare Research and Quality (AHRQ), Center for Delivery, Organization, and Markets, Healthcare Cost and Utilization Project (HCUP), Nationwide Inpatient Sample (NIS), 2003-2011; State Inpatient Databases (SID), 2012, weighted to provide national estimates using the same methodology as the 2003-2011 NIS; and the AHRQ Quality Indicators, version 4.4 Figure 5 is a set of line graphs that show the percentage of potentially preventable pediatric inpatient stays for asthma and diabetes by primary expected payer between 2003 and 2012. For asthma, the percentage of potentially preventable pediatric inpatient stays covered by Medicaid was 46.9 in 2003, 49.1 in 2004, 47.8 in 2005, 49.3 in 2006, 48.4 in 2007, 51.4 in 2008, 53.9 in 2009, 55.0 in 2010, 55.6 in 2011, and 58.1 in 2012. For asthma, the percentage of potentially preventable pediatric inpatient stays covered by private insurance was 46.4 in 2003, 43.1 in 2004, 43.0 in 2005, 43.4 in 2006, 41.2 in 2007, 41.4 in 2008, 36.5 in 2009, 37.8 in 2010, 38.7 in 2011, and 35.5 in 2012. For asthma, the percentage of potentially preventable pediatric inpatient stays that were uninsured was 4.1 in 2003, 5.1 in 2004, 5.2 in 2005, 4.7 in 2006, 6.7 in 2007, 4.2 in 2008, 6.6 in 2009, 4.3 in 2010, 2.8 in 2011, and 3.4 in 2012. For diabetes, the percentage of potentially preventable pediatric inpatient stays covered by private insurance was 52.5 in 2003, 50.6 in 2004, 51.1 in 2005, 50.6 in 2006, 49.3 in 2007, 50.4 in 2008, 47.4 in 2009, 50.7 in 2010, 49.2 in 2011, and 44.8 in 2012. For diabetes, the percentage of potentially preventable pediatric inpatient stays covered by Medicaid was 37.3 in 2003, 39.9 in 2004, 38.9 in 2005, 41.3 in 2006, 41.7 in 2007, 43.6 in 2008, 44.5 in 2009, 41.7 in 2010, 43.4 in 2011, and 47.2 in 2012. For diabetes, the percentage of potentially preventable pediatric inpatient stays that were uninsured was 3.8 in 2003, 4.4 in 2004, 3.9 in 2005, 3.8 in 2006, 4.2 in 2007, 3.0 in 2008, 3.6 in 2009, 2.8 in 2010, 2.5 in 2011, and 1.8 in 2012.
|
Data Source The estimates in this Statistical Brief are based upon an analysis done for the National Healthcare Quality and Disparities Reports (NHQR/NHDR). Data came from the Healthcare Cost and Utilization Project (HCUP) 2003-2011 Nationwide Inpatient Sample (NIS). For data year 2012, we used an analysis file derived from the HCUP State Inpatient Databases (SID) that was designed to provide national estimates using weighted records from a sample of hospitals from 44 States using the same methodology employed for the 2003-2011 NIS. We did not use the 2012 National Inpatient Sample (NIS) because the sampling design and universe definition was revised. At the time of this analysis, NIS trend weights to make national estimates compatible between 2003-2011 and 2012 were unavailable. Supplemental sources included population denominator data from Nielsen, a vendor that compiles and adds value to the U.S. Bureau of Census data. Nielsen uses intercensal methods to estimate household and demographic statistics for geographic areas.8 Definitions Case definition Potentially preventable pediatric admissions for asthma and diabetes were defined using the AHRQ Quality Indicators (QIs) software, version 4.4. Further information on the AHRQ QIs, including documentation and free software downloads, is available at http://www.qualityindicators.ahrq.gov/. This includes information on the Pediatric Quality Indicators (PDIs, formerly known as PedQIs) used in this Statistical Brief. The PDIs contain measures of potentially preventable hospitalizations for children with asthma, gastroenteritis, diabetes short-term complications, and perforated appendix. Additional information on how the QI software was applied to the HCUP data for the statistics reported in this Statistical Brief is available in Coffey et al., 2012.9 Consistent with the AHRQ PDI software, preventable stays for asthma were defined as stays where asthma was the principal diagnosis and the following cases were excluded: admissions with cystic fibrosis or anomalies of the respiratory system, transfers from other institutions, and obstetric admissions. Preventable stays for diabetes were defined as stays for which the principal diagnosis was diabetes, and short-term complications included ketoacidosis, hyperosmolarity, or coma; transfers from other institutions and obstetric admissions are excluded. Types of hospitals included in the HCUP Nationwide Inpatient Sample The Nationwide Inpatient Sample (NIS) is based on data from community hospitals, which are defined as short-term, non-Federal, general, and other hospitals, excluding hospital units of other institutions (e.g., prisons). The NIS includes obstetrics and gynecology, otolaryngology, orthopedic, cancer, pediatric, public, and academic medical hospitals. Excluded are long-term care facilities such as rehabilitation, psychiatric, and alcoholism and chemical dependency hospitals. Types of hospitals included in HCUP State Inpatient Databases This analysis used State Inpatient Databases (SID) limited to data from community hospitals, which are defined as short-term, non-Federal, general, and other hospitals, excluding hospital units of other institutions (e.g., prisons). Community hospitals include obstetrics and gynecology, otolaryngology, orthopedic, cancer, pediatric, public, and academic medical hospitals. Excluded for this analysis are long-term care facilities such as rehabilitation, psychiatric, and alcoholism and chemical dependency hospitals. However, if a patient received long-term care, rehabilitation, or treatment for psychiatric or chemical dependency conditions in a community hospital, the discharge record for that stay was included in the analysis. Unit of analysis The unit of analysis is the hospital discharge (i.e., the hospital stay), not a person or patient. This means that a person who is admitted to the hospital multiple times in 1 year will be counted each time as a separate "discharge" from the hospital. Costs and charges Total hospital charges were converted to costs using HCUP Cost-to-Charge Ratios based on hospital accounting reports from the Centers for Medicare & Medicaid Services (CMS).10 Costs will reflect the actual expenses incurred in the production of hospital services, such as wages, supplies, and utility costs; charges represent the amount a hospital billed for the case. For each hospital, a hospital-wide cost-to-charge ratio is used. Hospital charges reflect the amount the hospital billed for the entire hospital stay and do not include professional (physician) fees. For the purposes of this Statistical Brief, costs are reported to the nearest hundred. Annual costs were inflation adjusted using the Gross Domestic Product (GDP) Price Index from the U.S. Department of Commerce, Bureau of Economic Analysis (BEA), with 2012 as the index base. That is, all costs are expressed in 2012 dollars. How HCUP estimates of costs differ from National Health Expenditure Accounts There are a number of differences between the costs cited in this Statistical Brief and spending as measured in the National Health Expenditure Accounts (NHEA), which are produced annually by the Centers for Medicare & Medicaid Services (CMS).11 The largest source of difference comes from the HCUP coverage of inpatient treatment only in contrast to the NHEA inclusion of outpatient costs associated with emergency departments and other hospital-based outpatient clinics and departments as well. The outpatient portion of hospitals' activities has been growing steadily and may exceed half of all hospital revenue in recent years. On the basis of the American Hospital Association Annual Survey, 2012 outpatient gross revenues (or charges) were about 44 percent of total hospital gross revenues.12 Smaller sources of differences come from the inclusion in the NHEA of hospitals that are excluded from HCUP. These include Federal hospitals (Department of Defense, Veterans Administration, Indian Health Services, and Department of Justice [prison] hospitals) as well as psychiatric, substance abuse, and long-term care hospitals. A third source of difference lies in the HCUP reliance on billed charges from hospitals to payers, adjusted to provide estimates of costs using hospital-wide cost-to-charge ratios, in contrast to the NHEA measurement of spending or revenue. HCUP costs estimate the amount of money required to produce hospital services, including expenses for wages, salaries, and benefits paid to staff as well as utilities, maintenance, and other similar expenses required to run a hospital. NHEA spending or revenue measures the amount of income received by the hospital for treatment and other services provided, including payments by insurers, patients, or government programs. The difference between revenues and costs include profit for for-profit hospitals or surpluses for nonprofit hospitals. Location of patients' residence Place of residence is based on the 2003 version of the Urban Influence Codes:
Median community-level income Median community-level income is the median household income of the patient's ZIP Code of residence. The cut-offs for the quartile designation are determined using ZIP Code demographic data obtained from the Nielsen Company. The income quartile is missing for patients who are homeless or foreign. Region Region is one of the four regions defined by the U.S. Census Bureau:
About HCUP The Healthcare Cost and Utilization Project (HCUP, pronounced "H-Cup") is a family of healthcare databases and related software tools and products developed through a Federal-State-Industry partnership and sponsored by the Agency for Healthcare Research and Quality (AHRQ). HCUP databases bring together the data collection efforts of State data organizations, hospital associations, and private data organizations (HCUP Partners) and the Federal government to create a national information resource of encounter-level healthcare data. HCUP includes the largest collection of longitudinal hospital care data in the United States, with all-payer, encounter-level information beginning in 1988. These databases enable research on a broad range of health policy issues, including cost and quality of health services, medical practice patterns, access to healthcare programs, and outcomes of treatments at the national, State, and local market levels. HCUP would not be possible without the contributions of the following data collection Partners from across the United States: Alaska State Hospital and Nursing Home Association Arizona Department of Health Services Arkansas Department of Health California Office of Statewide Health Planning and Development Colorado Hospital Association Connecticut Hospital Association District of Columbia Hospital Association Florida Agency for Health Care Administration Georgia Hospital Association Hawaii Health Information Corporation Illinois Department of Public Health Indiana Hospital Association Iowa Hospital Association Kansas Hospital Association Kentucky Cabinet for Health and Family Services Louisiana Department of Health and Hospitals Maine Health Data Organization Maryland Health Services Cost Review Commission Massachusetts Center for Health Information and Analysis Michigan Health & Hospital Association Minnesota Hospital Association Mississippi Department of Health Missouri Hospital Industry Data Institute Montana MHA - An Association of Montana Health Care Providers Nebraska Hospital Association Nevada Department of Health and Human Services New Hampshire Department of Health & Human Services New Jersey Department of Health New Mexico Department of Health New York State Department of Health North Carolina Department of Health and Human Services North Dakota (data provided by the Minnesota Hospital Association) Ohio Hospital Association Oklahoma State Department of Health Oregon Association of Hospitals and Health Systems Oregon Office of Health Analytics Pennsylvania Health Care Cost Containment Council Rhode Island Department of Health South Carolina Revenue and Fiscal Affairs Office South Dakota Association of Healthcare Organizations Tennessee Hospital Association Texas Department of State Health Services Utah Department of Health Vermont Association of Hospitals and Health Systems Virginia Health Information Washington State Department of Health West Virginia Health Care Authority Wisconsin Department of Health Services Wyoming Hospital Association About Statistical Briefs HCUP Statistical Briefs are descriptive summary reports presenting statistics on hospital inpatient and emergency department use and costs, quality of care, access to care, medical conditions, procedures, patient populations, and other topics. The reports use HCUP administrative healthcare data. About the NIS The HCUP National (Nationwide) Inpatient Sample (NIS) is a national (nationwide) database of hospital inpatient stays. The NIS is nationally representative of all community hospitals (i.e., short-term, non-Federal, nonrehabilitation hospitals). The NIS includes all payers. It is drawn from a sampling frame that contains hospitals comprising more than 95 percent of all discharges in the United States. The vast size of the NIS allows the study of topics at the national and regional levels for specific subgroups of patients. In addition, NIS data are standardized across years to facilitate ease of use. The 2012 NIS was redesigned to optimize national estimates. The redesign incorporates two critical changes:
The new sampling strategy is expected to result in more precise estimates than those that resulted from the previous NIS design by reducing sampling error: for many estimates, confidence intervals under the new design are about half the length of confidence intervals under the previous design. The change in sample design for 2012 necessitates recomputation of prior years' NIS data to enable analysis of trends that uses the same definitions of discharges and hospitals. About the SID The HCUP State Inpatient Databases (SID) are hospital inpatient databases from data organizations participating in HCUP. The SID contain the universe of the inpatient discharge abstracts in the participating HCUP States, translated into a uniform format to facilitate multistate comparisons and analyses. Together, the SID encompass more than 95 percent of all U.S. community hospital discharges in 2009. The SID can be used to investigate questions unique to one State, to compare data from two or more States, to conduct market-area variation analyses, and to identify State-specific trends in inpatient care utilization, access, charges, and outcomes. For More Information For more information about HCUP, visit http://www.hcup-us.ahrq.gov/. For additional HCUP statistics, visit HCUPnet, our interactive query system, at https://datatools.ahrq.gov/hcupnet. For information on other hospitalizations in the United States, refer to the following HCUP Statistical Briefs located at http://www.hcup-us.ahrq.gov/reports/statbriefs/statbriefs.jsp:
For a detailed description of HCUP, more information on the design of the National (Nationwide) Inpatient Sample (NIS) and the State Inpatient Databases (SID), and methods to calculate estimates, please refer to the following publications: Agency for Healthcare Research and Quality. Overview of the National (Nationwide) Inpatient Sample (NIS). Healthcare Cost and Utilization Project (HCUP). Rockville, MD: Agency for Healthcare Research and Quality. Updated November 2014. http://www.hcup-us.ahrq.gov/nisoverview.jsp. Accessed January 7, 2015. Agency for Healthcare Research and Quality. Overview of the State Inpatient Databases (SID). Healthcare Cost and Utilization Project (HCUP). Rockville, MD: Agency for Healthcare Research and Quality. Updated November 2014. http://www.hcup-us.ahrq.gov/sidoverview.jsp. Accessed January 7, 2015. Suggested Citation Fingar K (Truven Health Analytics) and Washington R (AHRQ). Potentially Preventable Pediatric Hospital Inpatient Stays for Asthma and Diabetes, 2003-2012. HCUP Statistical Brief #192. June 2015. Agency for Healthcare Research and Quality, Rockville, MD. http://www.hcup-us.ahrq.gov/reports/statbriefs/sb192-Pediatric-Preventable-Hospitalizations-Asthma-Diabetes.pdf. Acknowledgments The authors would like to acknowledge the contributions of Marguerite Barrett of M.L. Barrett, Inc. *** AHRQ welcomes questions and comments from readers of this publication who are interested in obtaining more information about access, cost, use, financing, and quality of healthcare in the United States. We also invite you to tell us how you are using this Statistical Brief and other HCUP data and tools, and to share suggestions on how HCUP products might be enhanced to further meet your needs. Please e-mail us at hcup@ahrq.gov or send a letter to the address below:Virginia Mackay-Smith, Acting Director Center for Delivery, Organization, and Markets Agency for Healthcare Research and Quality 540 Gaither Road Rockville, MD 20850 1 American Lung Association. Asthma & Children Fact Sheet. September 2014. Original source is no longer available on the Web; for related information, refer to http://www.healthofchildren.com/A/Asthma.html 2 Bloom B, Jones LI, Freeman G. Summary health statistics for U.S. children: National Health Interview Survey, 2012. National Center for Health Statistics. Vital and Health Statistics 10(258). 2013. 3 Dabelea D, Mayer-Davis EJ, Saydah S, et al. Prevalence of type 1 and type 2 diabetes among children and adolescents from 2001 to 2009. JAMA. 2014;311(17):1778-86. 4 Friedman B, Berdahl T, Simpson LA, et al. Annual Report on Health Care for Children and Youth in the United States: Focus on Trends in Hospital Use and Quality. Academic Pediatrics. 2011;11:263-79. 5 Ibid. 6 Berdahl T, Friedman B, McCormick MC, et al. Annual Report on Health Care for Children and Youth in the United States: Trends in Racial/Ethnic, Income, and Insurance Disparities Over Time, 2002-2009. Academic Pediatrics. 2013;13:191-203. 7 Ibid. 8 Barrett M, Lopez-Gonzalez L, Coffey R, Levit K. Population Denominator Data for Use with the HCUP Databases (Updated with 2013 Population Data). HCUP Methods Series Report #2014-02. August 18, 2014. U.S. Agency for Healthcare Research and Quality. http://www.hcup-us.ahrq.gov/reports/methods/2014-02.pdf. Accessed January 7, 2015. 9 Coffey R, Barrett M, Houchens R, et al. Methods Applying AHRQ Quality Indicators to Healthcare Cost and Utilization Project (HCUP) Data for the Eleventh (2013) National Healthcare Quality Report (NHQR) and National Healthcare Disparities Report (NHDR). HCUP Methods Series Report #2012-03. Online. November 12, 2012. U.S. Agency for Healthcare Research and Quality. http://www.hcup-us.ahrq.gov/reports/methods/2012_03.pdf. Accessed January 7, 2015. 10 Agency for Healthcare Research and Quality. HCUP Cost-to-Charge Ratio (CCR) Files. Healthcare Cost and Utilization Project (HCUP). 2001-2011. Rockville, MD: Agency for Healthcare Research and Quality. Updated December 2014. https://www.hcup-us.ahrq.gov/db/state/costtocharge.jsp. Accessed January 7, 2015. 11 For additional information about the NHEA, see Centers for Medicare & Medicaid Services (CMS). National Health Expenditure Data. CMS website May 2014. http://www.cms.gov/Research-Statistics-Data-and-Systems/Statistics-Trends-and-Reports/NationalHealthExpendData/index.html?redirect=/NationalHealthExpendData/. Accessed January 7, 2015. 12 American Hospital Association. TrendWatch Chartbook, 2014. Table 4.2. Distribution of Inpatient vs. Outpatient Revenues, 1992-2012. Original source is no longer available on the Web; for related information refer to TrendWatch Chartbook, 2018. Table 4.2. Distribution of Inpatient vs. Outpatient Revenues, 1995-2016. www.aha.org/system/files/2018-05/2018-chartbook-table-4-2.pdf. |