STATISTICAL BRIEF #196 |
November 2015
Kathryn Fingar, Ph.D., M.P.H., and Raynard Washington, Ph.D. Introduction Hospital readmissions can have negative consequences for patients and the hospitals at which they are treated, and also are costly for both public and private payers. In 2011, Medicare paid for 58 percent of all readmissions, followed by private insurance (20 percent) and Medicaid (18 percent).1 Readmissions are a significant portion of Medicare spending—37 percent of total Medicare spending is for inpatient care, and 18 percent of all inpatient admissions paid by Medicare are readmitted within 30 days, accounting for $15 billion in costs annually.2 In addition to these costs, repeat hospitalizations place patients at greater risk for complications, hospital acquired infections, and stress.3 Because the majority of readmissions are for nonsurgical services, it is unlikely that readmissions are profitable for hospitals.4 Although it may be necessary to readmit some patients, the fact that risk-adjusted readmission rates vary considerably across hospitals suggests that certain readmissions may be prevented through hospital practices, such as improving patient discharge instructions, coordinating postacute care, and reducing medical complications during the initial hospital stay.5 The Affordable Care Act established the Centers for Medicare & Medicaid Services Hospital Readmissions Reduction Program (HRRP) to provide a financial incentive for hospitals to reduce preventable readmissions. Effective in 2013, the HRRP imposes a financial penalty for hospitals with excess rates of readmissions for acute myocardial infarction (AMI), congestive heart failure (CHF), and pneumonia among Medicare beneficiaries. In 2015, penalties also will be calculated based on readmissions for chronic obstructive pulmonary disease (COPD) and hip and knee replacements.6 CMS includes these conditions and procedures because of their high volume and costs.7 This Healthcare Cost and Utilization Project (HCUP) Statistical Brief examines trends from 2009 through 2013 for all readmissions following an admission for any cause, as well as for readmissions following an admission for four high-volume conditions targeted by the HRRP: AMI, CHF, COPD, and pneumonia. Readmission was defined as a subsequent hospital admission for any cause within 30 days following an initial hospital admission, referred to as the index stay. Because all-cause readmissions were examined, readmissions may or may not be related to the primary reason for admission during the index stay. Trends in the rate and aggregate cost of readmissions were examined overall and by expected payer of the index stay. Therefore, the expected payer of the readmission may be different from that of the index stay. Aggregate costs are those for the readmission only, not counting the cost of the index stay. Differences of greater than 5 percent are noted in the text. Findings Readmission rates among high-volume conditions, 2013 Table 1 presents conditions with at least 250,000 index stays that had the highest rate of readmission for all causes within 30 days in 2013. The four highlighted conditions—AMI, CHF, COPD, and pneumonia—are the focus of this Statistical Brief. |
|
| Table 1. High-volume conditions ranked by rate of readmission for all causes within 30 days, 2013 | |||||
| Rank | Principal diagnosis for index hospital stay | Number of index admissions | Number of all-cause readmissions | Aggregate cost of readmissions, $ millions | Rate of all-cause readmission |
|---|---|---|---|---|---|
| Total index admissions for any cause | 28,124,869 | 3,900,556 | 52,398 | 13.9 | |
| 1 | Congestive heart failure, non-hypertensive | 782,079 | 183,534 | 2,728 | 23.5 |
| 2 | Schizophrenia and other psychotic disorders | 366,256 | 83,245 | 772 | 22.7 |
| 3 | Respiratory failure, insufficiency, arrest (adult) | 290,892 | 62,684 | 961 | 21.5 |
| 4 | Diabetes mellitus with complications | 486,886 | 99,108 | 1,204 | 20.4 |
| 5 | Acute renal failure | 431,452 | 87,537 | 1,190 | 20.3 |
| 6 | Chronic obstructive pulmonary disease and bronchiectasis | 570,077 | 114,067 | 1,384 | 20.0 |
| 7 | Complication of device, implant or graft | 581,289 | 111,838 | 1,973 | 19.2 |
| 8 | Alcohol-related disorders | 261,072 | 50,081 | 366 | 19.2 |
| 9 | Septicemia | 1,011,496 | 191,156 | 3,154 | 18.9 |
| 10 | Fluid and electrolyte disorders | 358,640 | 65,704 | 839 | 18.3 |
| 11 | Complications of surgical procedures or medical care | 426,917 | 76,292 | 1,212 | 17.9 |
| 12 | Pancreatic disorders (not diabetes) | 271,749 | 47,111 | 563 | 17.3 |
| 13 | Gastrointestinal hemorrhage | 328,428 | 55,173 | 741 | 16.8 |
| 14 | Urinary tract infection | 470,448 | 73,633 | 854 | 15.7 |
| 15 | Intestinal obstruction without hernia | 314,811 | 48,753 | 696 | 15.5 |
| 16 | Pneumonia | 824,700 | 127,601 | 1,809 | 15.5 |
| 17 | Mood disorders | 747,029 | 114,385 | 930 | 15.3 |
| 18 | Acute myocardial infarction | 485,462 | 71,300 | 1,043 | 14.7 |
| 19 | Dysrhythmia | 651,881 | 94,883 | 1,225 | 14.6 |
| 20 | Coronary atherosclerosis and other heart disease | 433,782 | 55,265 | 793 | 12.7 |
| Notes: Only conditions with greater than 250,000 index stays are shown. Principal diagnosis is based on the Clinical Classifications Software (CCS). Costs include those of the readmission only, excluding the cost of the index stay. Source: Agency for Healthcare Research and Quality (AHRQ), Center for Delivery, Organization, and Markets, Healthcare Cost and Utilization Project (HCUP), Nationwide Readmissions Database (NRD), 2013 | |||||
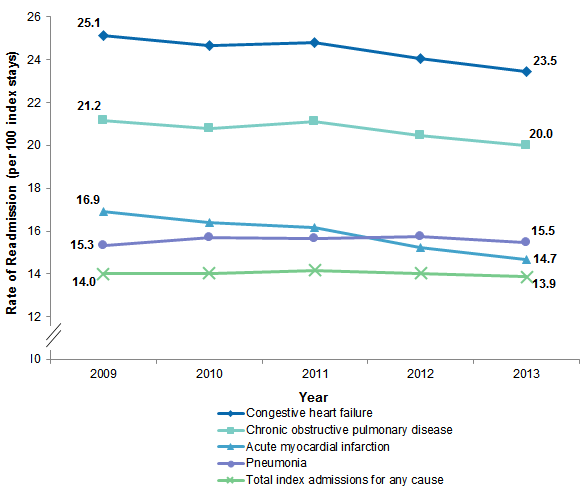
Trends in readmissions for AMI, CHF, COPD, and pneumonia, 2009-2013 Figure 1 presents trends in the rate of readmissions for any cause within 30 days, per 100 index stays, overall and for four high-volume conditions from 2009 through 2013. |
|
Figure 1. All-cause rate of readmission, by principal diagnosis of index admission, 2009-2013
Note: Principal diagnosis grouped according to the Clinical Classifications Software (CCS) Figure 1 shows the rate of readmission from 2009 through 2013 for acute myocardial infarction, congestive heart failure, chronic obstructive pulmonary disease, and pneumonia, and for all index admissions for any cause. The rate of readmission for congestive heart failure was 25.1 in 2009, 24.7 in 2010, 24.8 in 2011, 24.0 in 2012, and 23.5 in 2013. The rate of readmission for chronic obstructive pulmonary disease was 21.2 in 2009, 20.8 in 2010, 21.1 in 2011, 20.5 in 2012, and 20.0 in 2013. The rate of readmission for acute myocardial infarction declined steadily from 16.9 in 2009 to 14.7 in 2013. The rate of readmission for pneumonia was 15.3 in 2009, 15.7 in 2010, 15.6 in 2011, 15.7 in 2012, and 15.5 in 2013. And the rate of readmission for total index admissions for any cause was 14.0 in 2009 and 2010, 14.2 in 2011, 14.0 in 2012, and 13.9 in 2013. |
Table 2 presents trends in the 30-day all-cause readmission rate following index admissions for four high-volume conditions, by expected payer of the index stay, in 2009 and 2013. |
| Table 2. All-cause rate of readmission, by principal diagnosis and expected payer of the index stay, 2009-2013 | |||||
| Principal diagnosis for index hospital stay, by expected payer of the index stay | Number of all-cause readmissions | Rate of all-cause readmission | Cumulative percentage change in rate, 2009-2013 | ||
|---|---|---|---|---|---|
| 2009 | 2013 | 2009 | 2013 | ||
| Total, all four conditions | |||||
| Total | 571,393 | 496,502 | 19.7 | 18.6 | -5.4 |
| Expected payer of index stay | |||||
| Medicare | 430,916 | 376,761 | 22.0 | 20.3 | -7.9 |
| Medicaid | 64,000 | 57,064 | 19.8 | 20.5 | 3.5 |
| Private | 54,824 | 40,350 | 12.4 | 11.7 | -5.8 |
| Uninsured | 13,473 | 12,627 | 11.5 | 11.0 | -4.0 |
| Acute myocardial infarction | |||||
| Total | 79,199 | 71,300 | 16.9 | 14.7 | -13.1 |
| Expected payer of index stay | |||||
| Medicare | 56,348 | 51,334 | 20.4 | 17.8 | -12.8 |
| Medicaid | 5,962 | 5,683 | 19.9 | 17.7 | -10.7 |
| Private | 12,475 | 9,652 | 10.4 | 8.5 | -18.3 |
| Uninsured | 2,953 | 3,011 | 9.8 | 8.6 | -12.9 |
| Congestive heart failure | |||||
| Total | 214,198 | 183,534 | 25.1 | 23.5 | -6.6 |
| Expected payer of index stay | |||||
| Medicare | 168,791 | 144,138 | 25.6 | 23.7 | -7.2 |
| Medicaid | 22,285 | 19,809 | 30.4 | 29.1 | -4.1 |
| Private | 16,309 | 11,973 | 19.8 | 18.3 | -7.7 |
| Uninsured | 4,218 | 4,096 | 17.6 | 16.5 | -6.4 |
| Chronic obstructive pulmonary disease | |||||
| Total | 132,098 | 114,067 | 21.2 | 20.0 | -5.4 |
| Expected payer of index stay | |||||
| Medicare | 100,243 | 86,112 | 22.2 | 20.6 | -7.3 |
| Medicaid | 17,405 | 16,053 | 24.1 | 24.5 | 1.7 |
| Private | 9,364 | 7,041 | 13.9 | 13.7 | -1.1 |
| Uninsured | 3,038 | 2,594 | 13.9 | 12.0 | -14.0 |
| Pneumonia | |||||
| Total | 145,898 | 127,601 | 15.3 | 15.5 | 1.0 |
| Expected payer of index stay | |||||
| Medicare | 105,534 | 95,178 | 18.6 | 17.5 | -5.6 |
| Medicaid | 18,348 | 15,519 | 12.4 | 13.7 | 10.6 |
| Private | 16,676 | 11,685 | 9.6 | 10.1 | 4.8 |
| Uninsured | 3,263 | 2,926 | 7.9 | 8.9 | 13.3 |
| Note: Principal diagnosis grouped according to the Clinical Classifications Software (CCS). Data by payer do not add to the column total because other payers are not shown. Source: Agency for Healthcare Research and Quality (AHRQ), Center for Delivery, Organization, and Markets, Healthcare Cost and Utilization Project (HCUP), 2013 Nationwide Readmissions Database (NRD), and weighted national estimates from a readmissions analysis file derived from the 2009 State Inpatient Databases (SID) | |||||
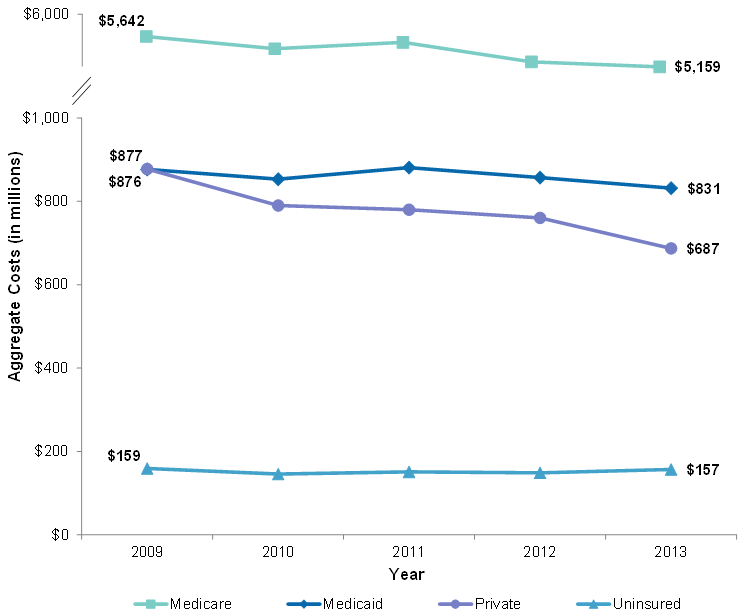
Figure 2 presents the inflation-adjusted aggregate costs for readmissions for four high-volume conditions, by expected payer of the index stay, from 2009 through 2013. |
|
Figure 2. Inflation-adjusted aggregate costs for readmissions for any cause following an index stay for AMI, CHF, COPD, or pneumonia, by expected payer of the index stay, 2009-2013
Abbreviations: AMI, acute myocardial infarction; CHF, congestive heart failure; COPD, chronic obstructive pulmonary disease Figure 2 shows inflation-adjusted aggregate costs for readmissions for any cause after an index stay for acute myocardial infarction, congestive heart failure, chronic obstructive pulmonary disease, or pneumonia from 2009 through 2013 by expected payer of the index stay. Aggregate costs of readmissions for index stays paid by Medicare were $5,642 million in 2009, $5,448 million in 2010, $5,551 million in 2011, $5,239 million in 2012, and $5,159 million in 2013. Aggregate costs of readmissions for index stays paid by Medicaid were $876 million in 2009, $853 million in 2010, $881 million in 2011, $857 million in 2012, and $831 million in 2013. Aggregate costs of readmissions for index stays paid by private insurance declined steadily from $877 million in 2009 to $687 million in 2013. Aggregate costs of readmissions for index stays that were uninsured were $159 million in 2009, $146 million in 2010, $151 million in 2011, $149 million in 2012, and $157 million in 2013.
|
Table 3 presents inflation-adjusted aggregate costs for readmissions for four high-volume conditions, by principal diagnosis and expected payer of the index stay, in 2009 and 2013. |
| Table 3. Inflation-adjusted aggregate costs of readmissions for four high-volume conditions, by principal diagnosis and expected payer of the index stay, 2009-2013 | |||
| Principal diagnosis for index hospital stay, by expected payer of the index stay | Aggregate costs for readmissions, $ millions | Cumulative percentage change in aggregate costs, 2009-2013 | |
|---|---|---|---|
| 2009 | 2013 | ||
| Total, all four conditions | |||
| Total | 7,661.6 | 6,964.7 | -9.1 |
| Expected payer of index stay | |||
| Medicare | 5,642.3 | 5,158.6 | -8.6 |
| Medicaid | 876.5 | 831.3 | -5.2 |
| Private | 877.4 | 687.1 | -21.7 |
| Uninsured | 159.2 | 156.8 | -1.5 |
| Acute myocardial infarction | |||
| Total | 1,098.3 | 1,043.4 | -5.0 |
| Expected payer of index stay | |||
| Medicare | 771.1 | 743.2 | -3.6 |
| Medicaid | 83.8 | 86.9 | 3.6 |
| Private | 183.7 | 151.5 | -17.6 |
| Uninsured | 38.2 | 39.7 | 4.0 |
| Congestive heart failure | |||
| Total | 2,975.0 | 2,728.2 | -8.3 |
| Expected payer of index stay | |||
| Medicare | 2,249.6 | 2,055.9 | -8.6 |
| Medicaid | 322.3 | 314.8 | -2.3 |
| Private | 317.0 | 252.4 | -20.4 |
| Uninsured | 50.9 | 56.2 | 10.4 |
| Chronic obstructive pulmonary disease | |||
| Total | 1,572.3 | 1,383.6 | -12.0 |
| Expected payer of index stay | |||
| Medicare | 1,202.0 | 1,049.4 | -12.7 |
| Medicaid | 198.3 | 189.2 | -4.6 |
| Private | 120.2 | 94.3 | -21.6 |
| Uninsured | 30.1 | 23.2 | -22.9 |
| Pneumonia | |||
| Total | 2,016.0 | 1,809.5 | -10.2 |
| Expected payer of index stay | |||
| Medicare | 1,419.6 | 1,310.1 | -7.7 |
| Medicaid | 272.1 | 240.5 | -11.6 |
| Private | 256.5 | 188.9 | -26.4 |
| Uninsured | 40.0 | 37.7 | -5.7 |
| Notes: Principal diagnosis grouped according to the Clinical Classifications Software (CCS). All costs are inflation adjusted using the price index for the gross domestic product and expressed in 2013 dollars. Costs include those of the readmission only, excluding the cost of the index stay. Data by payer do not add to the column total because other payers are not shown. Source: Agency for Healthcare Research and Quality (AHRQ), Center for Delivery, Organization, and Markets, Healthcare Cost and Utilization Project (HCUP), 2013 Nationwide Readmissions Database (NRD), and weighted national estimates from a readmissions analysis file derived from the 2009 State Inpatient Databases (SID) | |||
Data Source The estimates in this Statistical Brief are based upon data from the Healthcare Cost and Utilization Project (HCUP) 2013 Nationwide Readmissions Database (NRD) and the 2009-2012 State Inpatient Databases (SID). The SID were used to create readmissions analysis files consistent with the design of the 2013 NRD and weighted for national estimates. The statistics were generated from HCUPnet, a free, online query system that provides users with immediate access to the largest set of publicly available, all-payer national, regional, and State-level hospital care databases from HCUP.8 Definitions Diagnoses, ICD-9-CM, and Clinical Classifications Software (CCS) The principal diagnosis is that condition established after study to be chiefly responsible for the patient's admission to the hospital. Secondary diagnoses are concomitant conditions that coexist at the time of admission or develop during the stay. ICD-9-CM is the International Classification of Diseases, Ninth Revision, Clinical Modification, which assigns numeric codes to diagnoses. There are approximately 14,000 ICD-9-CM diagnosis codes. CCS categorizes ICD-9-CM diagnosis codes into a manageable number of clinically meaningful categories.9 This clinical grouper makes it easier to quickly understand patterns of diagnoses. CCS categories identified as Other typically are not reported; these categories include miscellaneous, otherwise unclassifiable diagnoses that may be difficult to interpret as a group. High-volume conditions The four high-volume conditions examined in this Statistical Brief were identified using the following CCS codes based on the principal diagnosis:
It should be noted that our estimates may differ from Medicare readmission rates computed using other data sources. The CMS HRRP uses a different algorithm to identify conditions.10 There may also be differences in the inclusion of beneficiaries with Medicare fee-for-service or Medicare Advantage and beneficiaries dually enrolled in Medicare and Medicaid. These groups are included in the Medicare estimates in this Statistical Brief. As shown in Table 4, despite these potential differences the rates of readmission following index stays for AMI, CHF, and pneumonia that were expected to be paid by Medicare, as reported in this Statistical Brief using HCUP data, are consistent with an analysis conducted by the Kaiser Family Foundation11 using CMS Hospital Compare data (the latter did not report COPD readmission rates). |
Table 4. A comparison of Medicare readmission rates following index stays for AMI, CHF, and pneumonia for 2008-2013 published by the Kaiser Family Foundation with those for 2009 and 2013 from HCUP |
||||
| Condition | KFF national average Medicare readmission rate, % | HCUP national Medicare readmission rate, % | ||
|---|---|---|---|---|
| 2008-2011 | 2010-2013 | 2009 | 2013 | |
| AMI | 19.7 | 17.8 | 20.4 | 17.8 |
| CHF | 24.7 | 22.7 | 25.6 | 23.7 |
| Pneumonia | 18.5 | 17.3 | 18.6 | 17.5 |
| Abbreviations: AMI, acute myocardial infarction; CHF, congestive heart failure; KFF, Kaiser Family Foundation Source: Kaiser Family Foundation analysis of Centers for Medicare & Medicaid Services Hospital Compare data files; Agency for Healthcare Research and Quality (AHRQ), Center for Delivery, Organization, and Markets, Healthcare Cost and Utilization Project (HCUP), 2013 Nationwide Readmissions Database (NRD), and weighted national estimates from a readmissions analysis file derived from the 2009 State Inpatient Databases (SID) | ||||
Readmissions The 30-day readmission rate is defined as the number of admissions for each condition for which there was at least one subsequent hospital admission within 30 days, divided by the total number of admissions from January through November of the same year. That is, when patients are discharged from the hospital, they are followed for 30 days in the data. If any readmission to the same or different hospital occurs during this time period, the admission is counted as having a readmission. No more than one readmission is counted within the 30-day period, because the outcome measure assessed is "percentage of admissions that are readmitted." If a patient was transferred to a different hospital on the same day or was transferred within the same hospital, the two events were combined as a single stay and the second event was not counted as a readmission; that is, transfers were not considered a readmission. In the case of admissions for which there was more than one readmission in the 30-day period, the data presented in this Statistical Brief reflect the characteristics and costs of the first readmission. Every qualifying hospital stay is counted as a separate initial (starting point) admission. Thus, a single patient can be counted multiple times during the course of the January through November observation period. In addition, initial admissions do not require a prior "clean period" with no hospitalizations; that is, a hospital stay may be a readmission for a prior stay and the initial admission for a subsequent readmission. Admissions were disqualified from the analysis as initial admissions if they could not be followed for 30 days for one of the following reasons: (1) the patient died in the hospital, (2) information on length of stay was missing, or (3) the patient was discharged in December. Types of hospitals included in the HCUP Nationwide Readmissions Database The Nationwide Readmissions Database (NRD) is based on data from community hospitals, which are defined as short-term, non-Federal, general, and other hospitals, excluding hospital units of other institutions (e.g., prisons). The NRD includes obstetrics and gynecology, otolaryngology, orthopedic, cancer, pediatric, public, and academic medical hospitals. Excluded are long-term care facilities such as rehabilitation, long-term acute care, psychiatric, and alcoholism and chemical dependency hospitals. However, if a patient received long-term care, rehabilitation, or treatment for psychiatric or chemical dependency conditions in a community hospital, the discharge record for that stay will be included in the NRD. Types of hospitals included in HCUP State Inpatient Databases This analysis used State Inpatient Databases (SID) limited to data from community hospitals, which are defined as short-term, non-Federal, general, and other hospitals, excluding hospital units of other institutions (e.g., prisons). Community hospitals include obstetrics and gynecology, otolaryngology, orthopedic, cancer, pediatric, public, and academic medical hospitals. Excluded for this analysis are long-term care facilities such as rehabilitation, psychiatric, and alcoholism and chemical dependency hospitals. However, if a patient received long-term care, rehabilitation, or treatment for psychiatric or chemical dependency conditions in a community hospital, the discharge record for that stay was included in the analysis. Costs and charges Total hospital charges were converted to costs using HCUP Cost-to-Charge Ratios based on hospital accounting reports from CMS.12 Costs reflect the actual expenses incurred in the production of hospital services, such as wages, supplies, and utility costs; charges represent the amount a hospital billed for the case. For each hospital, a hospital-wide cost-to-charge ratio is used. Hospital charges reflect the amount the hospital billed for the entire hospital stay and do not include professional (physician) fees. For the purposes of this Statistical Brief, costs are reported to the nearest hundred thousand. Annual costs were inflation adjusted using the Gross Domestic Product (GDP) Price Index from the U.S. Department of Commerce, Bureau of Economic Analysis (BEA), with 2013 as the index base.13 That is, all costs are expressed in 2013 dollars. How HCUP estimates of costs differ from National Health Expenditure Accounts There are a number of differences between the costs cited in this Statistical Brief and spending as measured in the National Health Expenditure Accounts (NHEA), which are produced annually by CMS.14 The largest source of difference comes from the HCUP coverage of inpatient treatment only in contrast to the NHEA inclusion of outpatient costs associated with emergency departments and other hospital-based outpatient clinics and departments as well. The outpatient portion of hospitals' activities has been growing steadily and may exceed half of all hospital revenue in recent years. On the basis of the American Hospital Association Annual Survey, 2012 outpatient gross revenues (or charges) were about 44 percent of total hospital gross revenues.15 Smaller sources of differences come from the inclusion in the NHEA of hospitals that are excluded from HCUP. These include Federal hospitals (Department of Defense, Veterans Administration, Indian Health Services, and Department of Justice [prison] hospitals) as well as psychiatric, substance abuse, and long-term care hospitals. A third source of difference lies in the HCUP reliance on billed charges from hospitals to payers, adjusted to provide estimates of costs using hospital-wide cost-to-charge ratios, in contrast to the NHEA measurement of spending or revenue. HCUP costs estimate the amount of money required to produce hospital services, including expenses for wages, salaries, and benefits paid to staff as well as utilities, maintenance, and other similar expenses required to run a hospital. NHEA spending or revenue measures the amount of income received by the hospital for treatment and other services provided, including payments by insurers, patients, or government programs. The difference between revenues and costs include profit for for-profit hospitals or surpluses for nonprofit hospitals. Payer Payer is the expected payer for the hospital stay. To make coding uniform across all HCUP data sources, payer combines detailed categories into general groups:
Hospital stays billed to the State Children's Health Insurance Program (SCHIP) may be classified as Medicaid, Private Insurance, or Other, depending on the structure of the State program. Because most State data do not identify SCHIP patients specifically, it is not possible to present this information separately. For this Statistical Brief a hierarchy was used to assign the payer category based on the primary and secondary expected payer:16
For this Statistical Brief, categorization of readmission counts and costs by expected payer was based on the index stay. The concordance between the expected payer coded at the index stay and the expected payer coded at readmission varies by payer: 98 percent for Medicare, 95 percent for Medicaid, 93 percent for private, and 80 percent for uninsured (percentages based on the 2013 NRD). About HCUP The Healthcare Cost and Utilization Project (HCUP, pronounced "H-Cup") is a family of databases and related software tools and products developed through a Federal-State-Industry partnership and sponsored by the Agency for Healthcare Research and Quality (AHRQ). HCUP databases bring together the data collection efforts of State data organizations, hospital associations, and private data organizations (HCUP Partners), and the Federal government to create a national information resource of encounter-level data. HCUP includes the largest collection of longitudinal hospital care data in the United States, with all-payer, encounter-level information beginning in 1988. These databases enable research on a broad range of health policy issues, including cost and quality of health services, medical practice patterns, access to programs, and outcomes of treatments at the national, State, and local market levels. HCUP would not be possible without the contributions of the following data collection Partners from across the United States: Alaska State Hospital and Nursing Home Association Arizona Department of Health Services Arkansas Department of Health California Office of Statewide Health Planning and Development Colorado Hospital Association Connecticut Hospital Association District of Columbia Hospital Association Florida Agency for Health Care Administration Georgia Hospital Association Hawaii Health Information Corporation Illinois Department of Public Health Indiana Hospital Association Iowa Hospital Association Kansas Hospital Association Kentucky Cabinet for Health and Family Services Louisiana Department of Health and Hospitals Maine Health Data Organization Maryland Health Services Cost Review Commission Massachusetts Center for Health Information and Analysis Michigan Health & Hospital Association Minnesota Hospital Association Mississippi Department of Health Missouri Hospital Industry Data Institute Montana MHA - An Association of Montana Health Care Providers Nebraska Hospital Association Nevada Department of Health and Human Services New Hampshire Department of Health & Human Services New Jersey Department of Health New Mexico Department of Health New York State Department of Health North Carolina Department of Health and Human Services North Dakota (data provided by the Minnesota Hospital Association) Ohio Hospital Association Oklahoma State Department of Health Oregon Association of Hospitals and Health Systems Oregon Office of Health Analytics Pennsylvania Health Care Cost Containment Council Rhode Island Department of Health South Carolina Revnue and Fiscal Affairs Office South Dakota Association of Healthcare Organizations Tennessee Hospital Association Texas Department of State Health Services Utah Department of Health Vermont Association of Hospitals and Health Systems Virginia Health Information Washington State Department of Health West Virginia Health Care Authority Wisconsin Department of Health Services Wyoming Hospital Association About Statistical Briefs HCUP Statistical Briefs are descriptive summary reports presenting statistics on hospital inpatient and emergency department use and costs, quality of care, access to care, medical conditions, procedures, patient populations, and other topics. The reports use HCUP administrative data. About the NRD The HCUP Nationwide Readmissions Database (NRD) is a calendar-year, discharge-level database constructed from the HCUP State Inpatient Databases (SID) with verified patient linkage numbers that can be used to track a person across hospitals within a State. The 2013 NRD is available for purchase through the HCUP Central Distributor. The NRD is designed to support various types of analyses of national readmission rates. The database includes discharges for patients with and without repeat hospital visits in a year and those who have died in the hospital. Repeat stays may or may not be related. The criteria to determine the relationship between hospital admissions is left to the analyst using the NRD. The NRD was constructed as a sample of convenience consisting of 100 percent of the eligible discharges. Discharge weights for national estimates are developed using the target universe of community hospitals (excluding rehabilitation and long-term acute care hospitals) in the United States. Over time, the sampling frame for the NRD will change; thus, the number of States contributing to the NRD will vary from year to year. The NRD is intended for national estimates only; no regional, State-, or hospital-specific estimates can be produced. About the SID The HCUP State Inpatient Databases (SID) are hospital inpatient databases from data organizations participating in HCUP. The SID contain the universe of the inpatient discharge abstracts in the participating HCUP States, translated into a uniform format to facilitate multistate comparisons and analyses. Together, the SID encompass more than 95 percent of all U.S. community hospital discharges. The SID can be used to investigate questions unique to one State, to compare data from two or more States, to conduct market-area variation analyses, and to identify State-specific trends in inpatient care utilization, access, charges, and outcomes. About HCUPnet HCUPnet is an online query system that offers instant access to the largest set of all-payer databases that are publicly available. HCUPnet has an easy step-by-step query system that creates tables and graphs of national and regional statistics as well as data trends for community hospitals in the United States. HCUPnet generates statistics using data from HCUP's National (Nationwide) Inpatient Sample (NIS), the Kids' Inpatient Database (KID), the Nationwide Emergency Department Sample (NEDS), the Nationwide Readmissions Database (NRD), the State Inpatient Databases (SID), and the State Emergency Department Databases (SEDD). For More Information For more information about HCUP, visit http://www.hcup-us.ahrq.gov/. For additional HCUP statistics, visit HCUPnet, our interactive query system, at https://datatools.ahrq.gov/hcupnet. For information on other hospitalizations in the United States, refer to the following HCUP Statistical Briefs located at http://www.hcup-us.ahrq.gov/reports/statbriefs/statbriefs.jsp:
Suggested Citation Fingar K (Truven Health Analytics), Washington R (AHRQ). Trends in Hospital Readmissions for Four High-Volume Conditions, 2009-2013. HCUP Statistical Brief #196. November 2015. Agency for Healthcare Research and Quality, Rockville, MD. http://www.hcup-us.ahrq.gov/reports/statbriefs/sb196-Readmissions-Trends-High-Volume-Conditions.pdf. Acknowledgements The authors would like to acknowledge the contributions of Marguerite Barrett of M.L. Barrett, Inc. *** AHRQ welcomes questions and comments from readers of this publication who are interested in obtaining more information about access, cost, use, financing, and quality of in the United States. We also invite you to tell us how you are using this Statistical Brief and other HCUP data and tools, and to share suggestions on how HCUP products might be enhanced to further meet your needs. Please e-mail us at hcup@ahrq.gov or send a letter to the address below:Virginia Mackay-Smith, Acting Director Center for Delivery, Organization, and Markets Agency for Healthcare Research and Quality 5600 Fishers Lane Rockville, MD 20857 1 Hines AL, Barrett ML, Jiang HJ, Steiner CA. Conditions With the Largest Number of Adult Hospital Readmissions by Payer, 2011. HCUP Statistical Brief #172. April 2014. Agency for Healthcare Research and Quality, Rockville, MD. https://www.hcup-us.ahrq.gov/reports/statbriefs/sb172-Conditions-Readmissions-Payer.pdf. Accessed October 22, 2015. 2 Minott J. Reducing Hospital Readmissions. Washington, DC: Academy Health; November 2008. www.btcstechnologies.com/wp-content/uploads/2013/02/ReducingHospitalReadmissions.pdf 3 Ibid. 4 Ibid. 5 Boccuti C, Casillas G. Aiming for Fewer Hospital U-turns: The Medicare Hospital Readmissions Reduction Program. Menlo Park, CA: The Henry J. Kaiser Family Foundation; January 2015. http://kff.org/medicare/issue-brief/aiming-for-fewer-hospital-u-turns-the-medicare-hospital-readmission-reduction-program/. 6 Boccuti C, Casillas G. Aiming for Fewer Hospital U-turns: The Medicare Hospital Readmissions Reduction Program. Menlo Park, CA: The Henry J. Kaiser Family Foundation; January 2015. http://kff.org/medicare/issue-brief/aiming-for-fewer-hospital-u-turns-the-medicare-hospital-readmission-reduction-program/. 7 Thorpe JH, Cascio T. Medicare Hospital Readmissions Reduction Program. Legal Notes. 2011;3(4):1-4. http://www.rwjf.org/content/dam/farm/reports/issue_briefs/2011/rwjf71483. 8 Agency for Healthcare Research and Quality. HCUPnet website. https://datatools.ahrq.gov/hcupnet. Accessed June 29, 2015. 9 HCUP Clinical Classifications Software (CCS). Healthcare Cost and Utilization Project (HCUP). Healthcare Cost and Utilization Project. Rockville, MD: Agency for Healthcare Research and Quality. Updated November 2014. http://www.hcup-us.ahrq.gov/toolssoftware/ccs/ccs.jsp. Accessed January 7, 2015. 10 Centers for Medicare & Medicaid Services. Measure Methodology. https://www.cms.gov/Medicare/Quality-Initiatives-Patient-Assessment-Instruments/HospitalQualityInits/Measure-Methodology.html. Accessed October 1, 2015. 11 Boccuti C, Casillas G. Aiming for Fewer Hospital U-turns: The Medicare Hospital Readmissions Reduction Program. Menlo Park, CA: The Henry J. Kaiser Family Foundation; January 2015. http://kff.org/medicare/issue-brief/aiming-for-fewer-hospital-u-turns-the-medicare-hospital-readmission-reduction-program/. 12 Agency for Healthcare Research and Quality. HCUP Cost-to-Charge Ratio (CCR) Files. Healthcare Cost and Utilization Project (HCUP). 2001-2011. Rockville, MD: Agency for Healthcare Research and Quality, Rockville, MD. Updated December 2014. http://www.hcup-us.ahrq.gov/db/state/costtocharge.jsp. Accessed January 7, 2015. 13 U.S. Bureau of Economic Analysis. National Income and Product Account Tables, Table 1.1.4 Price Indexes for Gross Domestic Product. http://www.bea.gov/iTable/iTable.cfm?ReqID=9&step=1#reqid=9&step=1&isuri=1. Accessed October 13, 2015. 14 For additional information about the NHEA, see Centers for Medicare & Medicaid Services (CMS). National Health Expenditure Data. CMS website May 2014. http://www.cms.gov/Research-Statistics-Data-and-Systems/Statistics-Trends-and-Reports/NationalHealthExpendData/index.html?redirect=/NationalHealthExpendData/. Accessed January 7, 2015. 15 American Hospital Association. TrendWatch Chartbook, 2014. Table 4.2. Distribution of Inpatient vs. Outpatient Revenues, 1992-2012. Original source is no longer available on the Web; for related information refer to TrendWatch Chartbook, 2018. Table 4.2. Distribution of Inpatient vs. Outpatient Revenues, 1995-2016. www.aha.org/system/files/2018-05/2018-chartbook-table-4-2.pdf. 16 The 2013 NRD available for purchase through the HCUP Central Distributor includes the data element for the primary expected payer but not the data element for the secondary expected payer. |