STATISTICAL BRIEF #199 |
December 2015
Marguerite L. Barrett, M.S., Lauren M. Wier, M.P.H., H. Joanna Jiang, Ph.D., and Claudia A. Steiner, M.D., M.P.H. Introduction Hospital readmissions have been used increasingly as an outcome measure for assessing performance of the system. For example, Partnership for Patients, a national initiative sponsored by the Department of Health and Human Services, is tracking changes in all-cause 30-day hospital readmissions.1 Efforts to reduce hospital readmissions range from reengineering discharge practices2 and improving care transition3 to building community-wide partnerships for addressing health and social service needs.4 Developing national benchmarks for hospital readmissions can help identify those patient populations with relatively high readmission rates for targeted improvement efforts. Furthermore, tracking changes in these benchmarks over time allows policymakers to monitor progress made toward reducing readmissions. This Healthcare Cost and Utilization Project (HCUP) Statistical Brief presents data on 30-day all-cause readmissions among patients aged 1 year and older by expected payer and patient age group. Trends in readmissions by payer are provided from 2009 through 2013. Changes in readmission rates from 2009 through 2013 and costs for index admissions (the initial inpatient stays) and readmissions for 2013 also are presented by payer and age group. The expected payer is determined by the index admission, although the expected payer of the readmission may be different. Findings Trends in hospital readmissions by payer, 2009-2013 Figure 1 presents trends in 30-day all-cause readmission rate by expected payer from 2009 through 2013. For each expected payer, all patients aged 1 year and older are included in the readmission rate. |
|
|
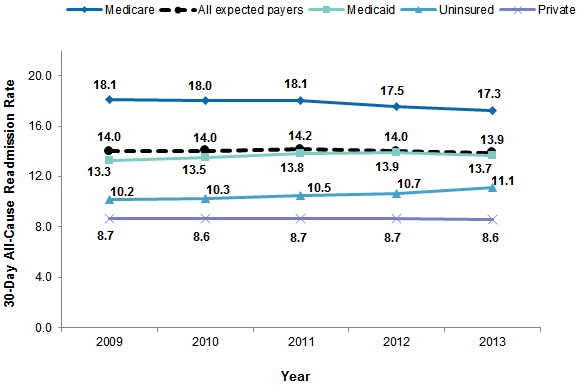
Figure 1. Rate of 30-day all-cause readmissions by expected payer, 2009-2013
Note: The expected payer is determined by the index admission, not the readmission. Rates by expected payer include all patients aged 1 year and older. Figure 1 is a line graph that shows the 30-day all cause readmission rate for readmissions for all expected payers and separately for readmissions covered by Medicare, Medicaid, and private insurance and those that were uninsured for 2009 through 2013. The 30-day all-cause readmission rate for readmissions covered by all expected payers was 14.0 in 2009, 14.0 in 2010, 14.2 in 2011, 14.0 in 2012, and 13.9 in 2013. The 30-day all-cause readmission rate for readmissions covered by Medicare was 18.1 in 2009, 18.0 in 2010, 18.1 in 2011, 17.5 in 2012, and 17.3 in 2013. The 30-day all-cause readmission rate for readmissions covered by Medicaid was 13.3 in 2009, 13.5 in 2010, 13.8 in 2011, 13.9 in 2012, and 13.7 in 2013. The 30-day all-cause readmission rate for readmissions that were uninsured was 10.2 in 2009, 10.3 in 2010, 10.5 in 2011, 10.7 in 2012, and 11.1 in 2013. The 30-day all-cause readmission rate for readmissions covered by private insurance was 8.7 in 2009, 8.6 in 2010, 8.7 in 2011, 8.7 in 2012, and 8.6 in 2013.
|
Table 1 presents the readmission rate and the number of readmissions by expected payer and patient age group for 2009 and 2013. The percentage change in the readmission rate from 2009 to 2013 also is shown. |
| Table 1. Rate of 30-day all-cause readmissions by expected payer and patient age group, 2009 and 2013 | ||||||
| Expected payer and age groupa | Readmission rate | Number of readmissions (thousands) | ||||
|---|---|---|---|---|---|---|
| 2009 | 2013 | Percentage change, 2009-2013 | 2009 | 2013 | Percentage change, 2009-2013 | |
| Medicare | ||||||
| Totalb | 18.1 | 17.3 | -4.8 | 2,581 | 2,427 | -6.0 |
| Aged 21-64 years | 21.5 | 21.2 | -1.4 | 608 | 614 | 1.0 |
| Aged 65 years and above | 17.3 | 16.2 | -6.1 | 1,970 | 1,810 | -8.1 |
| Medicaid | ||||||
| Total | 13.3 | 13.7 | 2.6 | 784 | 769 | -1.9 |
| Nonmaternal pediatric, aged 1-20 years | 11.1 | 11.9 | 8.1 | 111 | 105 | -5.3 |
| Nonmaternal adults, aged 21-44 years | 18.9 | 19.2 | 1.7 | 233 | 232 | -0.4 |
| Nonmaternal adults, aged 45-64 years | 21.8 | 21.6 | -0.9 | 334 | 341 | 2.1 |
| Maternal, any age | 5.0 | 4.6 | -8.5 | 106 | 90 | -15.4 |
| Private | ||||||
| Total | 8.7 | 8.6 | -1.2 | 765 | 643 | -15.9 |
| Nonmaternal pediatric, aged 1-20 years | 9.4 | 10.8 | 14.9 | 68 | 63 | -6.0 |
| Nonmaternal adults, aged 21-44 years | 9.4 | 9.9 | 6.2 | 182 | 151 | -16.8 |
| Nonmaternal adults, aged 45-64 years | 10.9 | 10.8 | -1.0 | 445 | 372 | -16.4 |
| Maternal, any age | 3.5 | 3.0 | -15.3 | 72 | 57 | -20.5 |
| Uninsured | ||||||
| Total | 10.2 | 11.1 | 8.9 | 167 | 185 | 10.6 |
| Nonmaternal pediatric, aged 1-20 years | 6.1 | 7.4 | 22.0 | 6 | 5 | -11.6 |
| Nonmaternal adults, aged 21-44 years | 9.8 | 11.1 | 13.9 | 74 | 83 | 12.9 |
| Nonmaternal adults, aged 45-64 years | 11.9 | 12.2 | 2.1 | 83 | 93 | 11.0 |
| Maternal, any age | 4.7 | 4.2 | -9.3 | 4 | 3 | -9.7 |
| a The expected payer is determined by the index admission, not the readmission. Information is not presented for three types of patients: (1) patients aged 0 years, (2) patients aged 1 year and above with other types of expected payer (e.g., local government programs, TRICARE, worker's compensation), and (3) patients aged 65 years and above for Medicaid, private, and uninsured. b Medicare patients under age 21 years are included in the Medicare total but are not reported separately because of the small number of cases. There is no maternal breakout for Medicare because of the small number of maternal stays in this group. Note: Percentage change was calculated from data that were not rounded. Source: Agency for Healthcare Research and Quality (AHRQ), Center for Delivery, Organization, and Markets, Healthcare Cost and Utilization Project (HCUP), 2013 Nationwide Readmissions Database (NRD), and a readmissions analysis file derived from the 2009 State Inpatient Databases (SID) | ||||||
Table 2 presents the average cost of index admissions, the average cost of readmissions, and the marginal and percentage increase in costs for readmissions, by expected payer and patient age group for 2013. |
| Table 2. Average costs of 30-day admissions and all-cause readmissions by expected payer and age group, 2013 | ||||
| Expected payer and age groupa | 2013 | |||
|---|---|---|---|---|
| Average cost of index admission, $ | Average cost of readmission, $ | Marginal difference in cost of readmission, $ | Change in cost of readmission, % | |
| Medicare | ||||
| Totalb | 13,100 | 13,800 | 700 | 5.3 |
| Aged 21-64 years | 12,900 | 13,600 | 700 | 5.4 |
| Aged 65 years and above | 13,100 | 13,800 | 700 | 5.3 |
| Medicaid | ||||
| Total | 9,500 | 12,300 | 2,800 | 29.5 |
| Nonmaternal pediatric, aged 1-20 years | 11,300 | 15,600 | 4,300 | 38.1 |
| Nonmaternal adults, aged 21-44 years | 11,000 | 11,500 | 500 | 4.5 |
| Nonmaternal adults, aged 45-64 years | 13,400 | 13,300 | -100 | -0.7 |
| Maternal, any age | 4,700 | 6,400 | 1,700 | 36.2 |
| Private | ||||
| Total | 10,800 | 14,200 | 3,400 | 31.5 |
| Nonmaternal pediatric, aged 1-20 years | 10,600 | 14,700 | 4,100 | 38.7 |
| Nonmaternal adults, aged 21-44 years | 11,100 | 13,200 | 2,100 | 18.9 |
| Nonmaternal adults, aged 45-64 years | 14,100 | 15,700 | 1,600 | 11.3 |
| Maternal, any age | 4,700 | 6,900 | 2,200 | 46.8 |
| Uninsured | ||||
| Total | 9,100 | 10,100 | 1,000 | 11.0 |
| Nonmaternal pediatric, aged 1-20 years | 7,500 | 9,200 | 1,700 | 22.7 |
| Nonmaternal adults, aged 21-44 years | 8,100 | 8,600 | 500 | 6.2 |
| Nonmaternal adults, aged 45-64 years | 10,800 | 11,700 | 900 | 8.3 |
| Maternal, any age | 4,200 | 6,100 | 1,900 | 45.2 |
| a The expected payer is determined by the index admission, not the readmission. Information is not presented for three types of patients: (1) patients aged 0 years, (2) patients aged 1 year and above with other types of expected payer (e.g., local government programs, TRICARE, worker's compensation), and (3) patients aged 65 years and above for Medicaid, private, and uninsured. b Medicare patients under age 21 are included in the Medicare total but are not reported separately because of the small number of cases. There is no maternal breakout for Medicare because of the small number of maternal stays in this group. Note: Percentage change was calculated from data that were not rounded. Source: Agency for Healthcare Research and Quality (AHRQ), Center for Delivery, Organization, and Markets, Healthcare Cost and Utilization Project (HCUP), Nationwide Readmissions Database (NRD), 2013 | ||||
The estimates in this Statistical Brief are based upon data from the Healthcare Cost and Utilization Project (HCUP) 2013 Nationwide Readmissions Database (NRD) and the 2009-2012 State Inpatient Databases (SID). The SID were used to create readmissions analysis files consistent with the design of the 2013 NRD and weighted for national estimates. Patients younger than 1 year were excluded from the analysis because the patient linkage numbers for infants are available for less than half of the States. Infants account for about 12 percent of all admissions. Patients aged 1 year and above with an expected payer other than Medicare, Medicaid, private insurance, or uninsured and patients aged 65 years and above with an expected primary payer of Medicaid, private insurance, or uninsured also were excluded because of small sample size. Combined, these patients account for about 5 percent of all admissions. Definitions Index admissions, readmissions, and readmission rates The methodology used in this Statistical Brief for counting index admissions and 30-day readmissions is consistent with the methods used for the all-payer 30-day readmission rate reported by Partnership for Patients.5 An index admission is defined as an inpatient stay discharged alive with a nonmissing length of stay (LOS). LOS is critical to determining the timing between inpatient stays. A patient is allowed to have multiple index admissions, regardless of the time elapsed between events. Consider a patient with four inpatient stays in 2013. If one stay starts on January 10, the next stay begins on January 20, the third stay begins on January 27th, and the fourth starts on March 30th, all four are counted as index admissions. Index admission counts presented in this Statistical Brief include inpatient stays that qualify as an index admission from January through December 2013 (12 months). An index admission also can be a readmission. A readmission is an inpatient stay that begins within 30 days of the discharge date of an index admission and can be to the same or a different hospital. The readmission can be for any cause and may or may not be related to the care received at the index admission. No more than one readmission is counted within the 30-day period. In the case of index admissions for which there was more than one readmission in the 30-day period, the data presented in this Statistical Brief reflect the characteristics and costs of the first readmission. Because the NRD and SID are calendar-year files, readmissions are identified using index admissions discharged in January through November 2013. This allows an equal opportunity to find a readmission within 30 days. In this Statistical Brief, the readmission counts are 12-month counts calculated by multiplying the readmission rate by the 12-month index admission counts. Table 3 demonstrates how index admissions and readmissions are identified for a patient with five inpatient stays in a year. |
Table 3. Example of counting index admissions and readmissions for patient with five inpatient stays in 2013 |
||
| Date in 2013 | Counted as an index admission? | Counted as a 30-day all-cause readmission? |
|---|---|---|
| January 10 | Yes | No, no prior stay |
| January 20 | Yes | Yes, counted as readmission to stay on January 10 |
| January 27 | Yes | Yes, counted as readmission to stay on January 20. Not counted as readmission to stay on January 10 because only 1 readmission is counted per index. |
| March 30 | Yes | No, no index event in prior 30 days |
| December 15 | No, because 30-day follow-up period is not available | No |
| Total | 4 index admissions | 2 readmissions |
If a patient was transferred to a different hospital on the same day or was transferred within the same hospital, the two events were considered a continuation of care and the second stay was not counted as a readmission. In contrast to an index admission, a readmission may result in discharge alive or dead and does not require the LOS to be nonmissing.
The readmission rate is the percentage of index admissions that are readmitted within 30 days. The denominator is the number of index admissions discharged in January through November 2013. The numerator is the number of index admissions in the denominator that had a readmission for any cause within 30 days. Table 3 demonstrates that the readmission rate is 50 percent (2 readmissions / 4 index events) for a patient seen in the hospital five times in the year. Types of hospitals included in the HCUP Nationwide Readmissions Database The NRD is based on data from community hospitals, which are defined as short-term, non-Federal, general, and other hospitals, excluding hospital units of other institutions (e.g., prisons). The NRD includes obstetrics and gynecology, otolaryngology, orthopedic, cancer, pediatric, public, and academic medical hospitals. Excluded are long-term care facilities such as rehabilitation, long-term acute care, psychiatric, and alcoholism and chemical dependency hospitals. However, if a patient received long-term care, rehabilitation, or treatment for psychiatric or chemical dependency conditions in a community hospital, the discharge record for that stay is included in the NRD. Types of hospitals included in HCUP State Inpatient Databases This analysis used SID limited to data from community hospitals, which are defined as short-term, non-Federal, general, and other hospitals, excluding hospital units of other institutions (e.g., prisons). Community hospitals include obstetrics and gynecology, otolaryngology, orthopedic, cancer, pediatric, public, and academic medical hospitals. Excluded for this analysis are long-term care facilities such as rehabilitation, psychiatric, and alcoholism and chemical dependency hospitals. However, if a patient received long-term care, rehabilitation, or treatment for psychiatric or chemical dependency conditions in a community hospital, the discharge record for that stay was included in the analysis. Unit of analysis The unit of analysis is the individual patient identified by the synthetic patient-level identifier. A patient will have multiple records in the NRD or SID if he or she has multiple hospital admissions in the year. Costs and charges Total hospital charges were converted to costs using HCUP Cost-to-Charge Ratios based on hospital accounting reports from the Centers for Medicare & Medicaid Services (CMS).6 Costs reflect the actual expenses incurred in the production of hospital services, such as wages, supplies, and utility costs; charges represent the amount a hospital billed for the case. For each hospital, a hospital-wide cost-to-charge ratio is used. Hospital charges reflect the amount the hospital billed for the entire hospital stay and do not include professional (physician) fees. For the purposes of this Statistical Brief, costs are reported to the nearest hundred. Payer Payer is the expected payer for the hospital stay. To make coding uniform across all HCUP data sources, payer combines detailed categories into general groups:
For this Statistical Brief, a hierarchy was used to assign the payer category based on the primary and secondary expected payer:7
About HCUP The Healthcare Cost and Utilization Project (HCUP, pronounced "H-Cup") is a family of databases and related software tools and products developed through a Federal-State-Industry partnership and sponsored by the Agency for Healthcare Research and Quality (AHRQ). HCUP databases bring together the data collection efforts of State data organizations, hospital associations, and private data organizations (HCUP Partners) and the Federal government to create a national information resource of encounter-level data. HCUP includes the largest collection of longitudinal hospital care data in the United States, with all-payer, encounter-level information beginning in 1988. These databases enable research on a broad range of health policy issues, including cost and quality of health services, medical practice patterns, access to programs, and outcomes of treatments at the national, State, and local market levels. HCUP would not be possible without the contributions of the following data collection Partners from across the United States: Alaska State Hospital and Nursing Home Association Arizona Department of Health Services Arkansas Department of Health California Office of Statewide Health Planning and Development Colorado Hospital Association Connecticut Hospital Association District of Columbia Hospital Association Florida Agency for Health Care Administration Georgia Hospital Association Hawaii Health Information Corporation Illinois Department of Public Health Indiana Hospital Association Iowa Hospital Association Kansas Hospital Association Kentucky Cabinet for Health and Family Services Louisiana Department of Health and Hospitals Maine Health Data Organization Maryland Health Services Cost Review Commission Massachusetts Center for Health Information and Analysis Michigan Health & Hospital Association Minnesota Hospital Association Mississippi Department of Health Missouri Hospital Industry Data Institute Montana MHA - An Association of Montana Health Care Providers Nebraska Hospital Association Nevada Department of Health and Human Services New Hampshire Department of Health & Human Services New Jersey Department of Health New Mexico Department of Health New York State Department of Health North Carolina Department of Health and Human Services North Dakota (data provided by the Minnesota Hospital Association) Ohio Hospital Association Oklahoma State Department of Health Oregon Association of Hospitals and Health Systems Oregon Office of Health Analytics Pennsylvania Health Care Cost Containment Council Rhode Island Department of Health South Carolina Revnue and Fiscal Affairs Office South Dakota Association of Healthcare Organizations Tennessee Hospital Association Texas Department of State Health Services Utah Department of Health Vermont Association of Hospitals and Health Systems Virginia Health Information Washington State Department of Health West Virginia Health Care Authority Wisconsin Department of Health Services Wyoming Hospital Association About Statistical Briefs HCUP Statistical Briefs are descriptive summary reports presenting statistics on hospital inpatient and emergency department use and costs, quality of care, access to care, medical conditions, procedures, patient populations, and other topics. The reports use HCUP administrative data. About the NRD The HCUP NRD is a calendar-year, discharge-level database constructed from the HCUP SID with verified patient linkage numbers that can be used to track a person across hospitals within a State. The 2013 NRD is available for purchase through the HCUP Central Distributor. The NRD is designed to support various types of analyses of national readmission rates. The database includes discharges for patients with and without repeat hospital visits in a year and those who have died in the hospital. Repeat stays may or may not be related. The criteria to determine the relationship between hospital admissions are left to the analyst using the NRD. The NRD was constructed as a sample of convenience consisting of 100 percent of the eligible discharges. Discharge weights for national estimates are developed using the target universe of community hospitals (excluding rehabilitation and long-term acute care hospitals) in the United States. Over time, the sampling frame for the NRD will change; thus, the number of States contributing to the NRD will vary from year to year. The NRD is intended for national estimates only; no regional, State-, or hospital-specific estimates can be produced. About the SID The HCUP SID are hospital inpatient databases from data organizations participating in HCUP. The SID contain the universe of the inpatient discharge abstracts in the participating HCUP States, translated into a uniform format to facilitate multistate comparisons and analyses. Together, the SID encompass more than 95 percent of all U.S. community hospital discharges. The SID can be used to investigate questions unique to one State, to compare data from two or more States, to conduct market-area variation analyses, and to identify State-specific trends in inpatient care utilization, access, charges, and outcomes. For More Information For more information about HCUP, visit http://www.hcup-us.ahrq.gov/. For additional HCUP statistics, visit HCUPnet, our interactive query system, at https://datatools.ahrq.gov/hcupnet. For information on readmissions-related topics in the United States, refer to the following HCUP Statistical Briefs located at http://www.hcup-us.ahrq.gov/reports/statbriefs/statbriefs.jsp:
Barrett ML (M.L. Barrett, Inc.), Wier LM (Truven Health Analytics), Jiang HJ (AHRQ), Steiner CA (AHRQ). All-Cause Readmissions by Payer and Age, 2009-2013. HCUP Statistical Brief #199. December 2015. Agency for Healthcare Research and Quality, Rockville, MD. http://www.hcup-us.ahrq.gov/reports/statbriefs/sb199-Readmissions-Payer-Age.pdf. Acknowledgments The authors would like to acknowledge the contributions of Minya Sheng of Truven Health Analytics. *** AHRQ welcomes questions and comments from readers of this publication who are interested in obtaining more information about access, cost, use, financing, and quality of in the United States. We also invite you to tell us how you are using this Statistical Brief and other HCUP data and tools, and to share suggestions on how HCUP products might be enhanced to further meet your needs. Please e-mail us at hcup@ahrq.gov or send a letter to the address below:Virginia Mackay-Smith, Acting Director Center for Delivery, Organization, and Markets Agency for Healthcare Research and Quality 5600 Fishers Lane Rockville, MD 20857 1 U.S. Department of Health and Human Services, National Quality Strategy. 2013 Annual Progress Report to Congress: National Strategy for Quality Improvement in Health Care. July 2013, Updated July 2014. http://www.ahrq.gov/workingforquality/reports/annual-reports/nqs2013annlrpt.htm#tab1. Accessed November 13, 2015. 2 Agency for Healthcare Research and Quality. Re-Engineered Discharge (RED) Toolkit. June 2015. Rockville, MD: Agency for Healthcare Research and Quality. http://www.ahrq.gov/professionals/systems/hospital/red/toolkit/index.html. Accessed November 13, 2015. 3 Coleman EA, Parry C, Chalmers S, Min SJ. The care transitions intervention: results of a randomized controlled trial. Arch Intern Med. 2006;166(17):1822-8. 4 Agency for Healthcare Research and Quality. Hospital Guide to Reducing Medicaid Readmissions. August 2014. Rockville, MD: Agency for Healthcare Research and Quality. http://www.ahrq.gov/professionals/systems/hospital/medicaidreadmitguide/index.html. Accessed November 13, 2015. 5 U.S. Department of Health and Human Services, National Quality Strategy. 2013 Annual Progress Report to Congress: National Strategy for Quality Improvement in Health Care. July 2013, Updated July 2014. http://www.ahrq.gov/workingforquality/reports/annual-reports/nqs2013annlrpt.htm#tab1. Accessed November 13, 2015. 6 Agency for Healthcare Research and Quality. HCUP Cost-to-Charge Ratio (CCR) Files. Healthcare Cost and Utilization Project (HCUP). 2001-2012. Rockville, MD: Agency for Healthcare Research and Quality. Updated December 2014. http://www.hcup-us.ahrq.gov/db/state/costtocharge.jsp. Accessed January 7, 2015. 7 The 2013 NRD available for purchase through the HCUP Central Distributor includes the data element for the primary expected payer but not the data element for secondary expected payer. |
| Internet Citation: Statistical Brief #199. Healthcare Cost and Utilization Project (HCUP). December 2015. Agency for Healthcare Research and Quality, Rockville, MD. hcup-us.ahrq.gov/reports/statbriefs/sb199-Readmissions-Payer-Age.jsp. |
| Are you having problems viewing or printing pages on this website? |
| If you have comments, suggestions, and/or questions, please contact hcup@ahrq.gov. |
| If you are experiencing issues related to Section 508 accessibility of information on this website, please contact hcup@ahrq.gov. |
| Privacy Notice, Viewers & Players |
| Last modified 12/15/15 |