STATISTICAL BRIEF #207 |
July 2016
Audrey J. Weiss, Ph.D., and Anne Elixhauser, Ph.D. Introduction With most Americans engaging in some type of sports or physical fitness activity each year,1 it is important to understand the types of injuries that are most commonly seen in the hospital and emergency department (ED) and which sports account for those injuries. Prevention of sports-related injuries is part of the current research agenda of the Centers for Disease Control and Prevention.2 Sports and recreation-related injuries are a common type of injury seen in hospital EDs.3 Sports-related ED visits are most common among older children and young adults and among males.4 One recent study reported that, among children aged 5-18 years, the number of sports-related injuries seen in the ED across 21 selected sports increased annually between 2001 and 2013.5 Of the four sports that accounted for three-fourths of these sports-related injuries, football and soccer showed a significant increase in injuries from 2001 to 2013 whereas basketball and baseball showed a significant decrease in injuries.6 Some sports-related injuries are severe enough to require hospitalization.7 Certain types of sports-related injuries, such as concussions and traumatic brain injuries (TBIs), have received increasing national attention. Between 2001 and 2009, there was an estimated 62 percent increase in sports-related TBI visits to the ED among children aged 19 years and under.8 This Healthcare Cost and Utilization Project (HCUP) Statistical Brief presents data on the most common sports activities associated with two types of hospital use in 2013: inpatient stays and ED visits that were discharged. We examine the most common sports-related ED and hospital inpatient use by patient sex and age. Finally, we present the types of injuries most frequently associated with sports-related ED visits and inpatient stays. This Statistical Brief is based upon external cause of injury diagnosis codes ("E codes") from the International Classification of Diseases, Ninth Revision, Clinical Modification (ICD-9-CM) coding system used for hospital inpatient and ED discharge records. E codes provide supplemental information about the nature of the hospital stay or ED visit, but they are not mandatory for reporting in all instances.9 Consequently, the counts in this Statistical Brief are likely lower than the actual volume of sports-related ED visits and inpatient stays. Analysis suggests that E codes are present for over 90 percent of HCUP inpatient and ED visit records with an injury diagnosis, although E codes for sports injuries in particular were not examined.10 Nonetheless, we do not expect that any undercounting of sports E codes generally would affect the patterns reported here for the most common types of sports and injuries. Findings Frequency of sports-related emergency department and hospital inpatient use, 2013 Figure 1 presents sports-related ED and hospital inpatient use categorized by the general type of sports activity in 2013. Activities are sorted by the total number of sports-related ED visits (discharged) and inpatient stays combined. Appendix A lists the specific sports that constitute each general type of sports activity category; details on specific sports are described later in this report. |
|
|
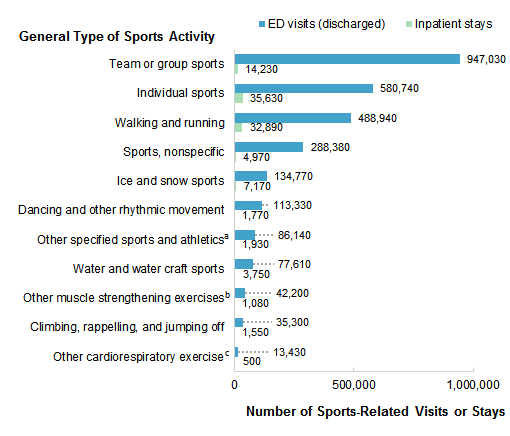
Figure 1. Number of sports-related emergency department visits (discharged) and hospital inpatient stays by general type of sports activity, 2013
Abbreviation: ED, emergency department Figure 1 is a bar chart that shows the number of sports-related ED visits or inpatient stays by type of sports activity. Team or group sports: visits: 947,030; stays: 14,230. Individual sports: visits: 580,740; stays: 35,630. Walking and running: visits: 488,940; stays: 32,890. Sports, nonspecific: visits: 288,380; stays: 4,970. Ice and snow sports: visits: 134,770; stays: 7,170. Dancing and other rhythmic movement: visits: 113,330; stays: 1,770. Other specified sports and athletics: visits: 86,140; stays: 1,930. Water and water craft sports: visits: 77,610; stays: 3,750. Other muscle strengthening exercises: visits: 42,200; stays: 1,080. Climbing, rappelling, and jumping off: visits: 35,300; stays: 1,550. Other cardiorespiratory exercise: visits: 13,430; stays: 500.
|
|
|
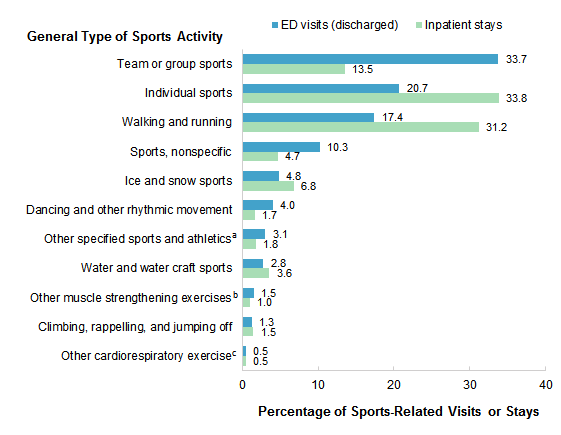
Figure 2. Percentage of sports-related emergency department visits (discharged) and hospital inpatient stays by general type of sports activity, 2013
Abbreviation: ED, emergency department Figure 2 is a bar chart that shows the percentage of sports-related ED visits or inpatient stays by type of sports activity. Team or group sports: visits: 33.7; stays: 13.5. Individual sports: visits: 20.7; stays: 33.8. Walking and running: visits: 17.4; stays 31.2. Sports, nonspecific: visits: 10.3; stays: 4.7. Ice and snow sports: visits: 4.8; stays: 6.8. Dancing and other rhythmic movement: visits: 4.0; stays: 1.7. Other specified sports and athletics: visits: 3.1; stays: 1.8. Water and water craft sports: visits: 2.8; stays: 3.6. Other muscle strengthening exercises: visits: 1.5; stays: 1.0. Climbing, rappelling, and jumping off: visits: 1.3; stays: 1.5. Other cardiorespiratory exercise: visits: 0.5; stays: 0.5.
|
Table 1 presents the 10 most common specific sports activities associated with ED visits (discharged) and hospital inpatient stays in 2013. |
| Table 1. Top 10 specific sports activities associated with emergency department visits (discharged) and hospital inpatient stays, 2013 | ||||||
| Specific sports activity | ED visits (discharged) | Inpatient stays | ||||
|---|---|---|---|---|---|---|
| Rank | n | % of all sports-related visits | Rank | n | % of all sports-related visits | |
| All sports activities | 2,807,880 | 100.0 | 105,490 | 100.0 | ||
| Bicycle riding | 1 | 383,790 | 13.7 | 2 | 26,530 | 25.1 |
| Walking, marching, and hiking | 2 | 340,290 | 12.1 | 1 | 30,650 | 29.1 |
| Other unspecified sports activitya | 3 | 288,380 | 10.3 | 5 | 4,970 | 4.7 |
| Basketball | 4 | 268,580 | 9.6 | 10 | 2,020 | 1.9 |
| American tackle football | 5 | 211,220 | 7.5 | 7 | 2,830 | 2.7 |
| School recess and summer campb | 6 | 150,150 | 5.3 | 4 | 5,140 | 4.9 |
| Running | 7 | 148,650 | 5.3 | 8 | 2,240 | 2.1 |
| Roller skating and skateboarding | 8 | 143,780 | 5.1 | 6 | 4,600 | 4.4 |
| Soccer | 9 | 128,950 | 4.6 | |||
| Baseball | 10 | 113,420 | 4.0 | |||
| Downhill skiing and snowboardingc | 3 | 5,320 | 5.0 | |||
| Horseback riding | 9 | 2,220 | 2.1 | |||
| Abbreviation: ED, emergency department Note: For fewer than 1% of ED visits and inpatient stays, more than one sports activity was identified. In these cases, the visit or stay is counted separately for each identified sports activity. a More specific information about the sports activity is not available in the ICD-9-CM diagnosis codes in this category. b Physical games generally associated with school recess, summer camp, and children. c Snow (alpine) (downhill) skiing, snowboarding, sledding, tobogganing, and snow tubing. Source: Agency for Healthcare Research and Quality (AHRQ), Center for Delivery, Organization, and Markets, Healthcare Cost and Utilization Project (HCUP), National Inpatient Sample (NIS) and Nationwide Emergency Department Sample (NEDS), 2013 | ||||||
Table 2 focuses on ED visits and presents the five most common sports activities associated with ED visits for males and females across age groups in 2013. |
| Table 2. Top five sports activities associated with emergency department visits (discharged), by patient sex and age group, 2013 | ||||||
| Rank | ED visits for males | ED visits for females | ||||
|---|---|---|---|---|---|---|
| Sports activity | n | %a | Sports activity | n | %a | |
| Ages <18 years | 1,018,630 | 100.0 | Ages <18 years | 516,780 | 100.0 | |
| 1 | American tackle football | 167,350 | 16.4 | School recess and summer campc | 66,230 | 12.8 |
| 2 | Other unspecified sports activityb | 138,470 | 13.6 | Bicycle riding | 50,870 | 9.8 |
| 3 | Bicycle riding | 120,170 | 11.8 | Other unspecified sports activityb | 48,330 | 9.4 |
| 4 | Basketball | 118,140 | 11.6 | Running | 40,520 | 7.8 |
| 5 | School recess and summer campc | 76,920 | 7.6 | Soccer | 40,320 | 7.8 |
| Ages 18-44 years | 602,410 | 100.0 | Ages 18-44 years | 255,490 | 100.0 | |
| 1 | Bicycle riding | 96,570 | 16.0 | Walking, marching, and hiking | 65,330 | 25.6 |
| 2 | Basketball | 96,180 | 16.0 | Bicycle riding | 29,310 | 11.5 |
| 3 | Other unspecified sports activityb | 73,220 | 12.2 | Other unspecified sports activityb | 16,200 | 6.3 |
| 4 | Walking, marching, and hiking | 42,920 | 7.1 | Running | 16,180 | 6.3 |
| 5 | Roller skating and skateboarding | 37,780 | 6.3 | Roller skating and skateboarding | 14,480 | 5.7 |
| Ages 45-64 years | 150,850 | 100.0 | Ages 45-64 years | 122,780 | 100.0 | |
| 1 | Bicycle riding | 52,680 | 34.9 | Walking, marching, and hiking | 60,200 | 49.0 |
| 2 | Walking, marching, and hiking | 32,250 | 21.4 | Bicycle riding | 19,360 | 15.8 |
| 3 | Other unspecified sports activityb | 7,740 | 5.1 | Running | 5,140 | 4.2 |
| 4 | Basketball | 6,130 | 4.1 | Downhill skiing and snowboardingd | 4,260 | 3.5 |
| 5 | Downhill skiing and snowboardingd | 5,990 | 4.0 | Roller skating and skateboarding | 3,470 | 2.8 |
| Ages 65+ years | 57,170 | 100.0 | Ages 65+ years | 83,680 | 100.0 | |
| 1 | Walking, marching, and hiking | 31,060 | 54.3 | Walking, marching, and hiking | 66,730 | 79.7 |
| 2 | Bicycle riding | 10,400 | 18.2 | Bicycle riding | 4,400 | 5.3 |
| 3 | Golf | 2,010 | 3.5 | Ice and snow, other activity | 1,200 | 1.4 |
| 4 | Downhill skiing and snowboardingd | 1,580 | 2.8 | Running | 1,090 | 1.3 |
| 5 | Running | 1,270 | 2.2 | Dancing | 1,020 | 1.2 |
| Abbreviation: ED, emergency department Notes: For fewer than 1% of ED visits, more than one sports activity was identified. In these cases, the visit is counted separately for each identified sports activity. a The tabled % value refers to the percentage of all sports-related ED visits for the specified sex-age group. b More specific information about the sports activity is not available in the ICD-9-CM diagnosis codes in this category. c Physical games generally associated with school recess, summer camp, and children. d Snow (alpine) (downhill) skiing, snowboarding, sledding, tobogganing, and snow tubing. Source: Agency for Healthcare Research and Quality (AHRQ), Center for Delivery, Organization, and Markets, Healthcare Cost and Utilization Project (HCUP), Nationwide Emergency Department Sample (NEDS), 2013 | ||||||
|
| Table 3. Top five sports activities associated with hospital inpatient stays, by patient sex and age group, 2013 | ||||||
| Rank | Inpatient stays for males | Inpatient stays for females | ||||
|---|---|---|---|---|---|---|
| Sports activity | n | %a | Sports activity | n | %a | |
| Ages <18 years | 18,860 | 100.0 | Ages <18 years | 6,990 | 100.0 | |
| 1 | Bicycle riding | 3,850 | 20.4 | School recess and summer campb | 2,070 | 29.6 |
| 2 | School recess and summer campb | 2,680 | 14.2 | Bicycle riding | 1,100 | 15.7 |
| 3 | Other unspecified sports activityc | 2,300 | 12.2 | Other unspecified sports activityc | 430 | 6.2 |
| 4 | American tackle football | 2,050 | 10.9 | Downhill skiing and snowboardingd | 350 | 5.0 |
| 5 | Roller skating and skateboarding | 1,570 | 8.3 | Roller skating and skateboarding | 330 | 4.7 |
| Ages 18-44 years | 21,090 | 100.0 | Ages 18-44 years | 6,570 | 100.0 | |
| 1 | Bicycle riding | 6,730 | 31.9 | Bicycle riding | 1,580 | 24.0 |
| 2 | Downhill skiing and snowboardingd | 1,630 | 7.7 | Walking, marching, and hiking | 1,110 | 16.9 |
| 3 | Other unspecified sports activityc | 1,540 | 7.3 | Roller skating and skateboarding | 600 | 9.1 |
| 4 | Roller skating and skateboarding | 1,530 | 7.3 | Downhill skiing and snowboardingd | 500 | 7.6 |
| 5 | Walking, marching, and hiking | 1,510 | 7.2 | Horseback riding | 390 | 5.9 |
| Ages 45-64 years | 14,540 | 100.0 | Ages 45-64 years | 8,550 | 100.0 | |
| 1 | Bicycle riding | 7,510 | 51.7 | Walking, marching, and hiking | 3,380 | 39.5 |
| 2 | Walking, marching, and hiking | 2,620 | 18.0 | Bicycle riding | 2,220 | 26.0 |
| 3 | Downhill skiing and snowboardingd | 920 | 6.3 | Downhill skiing and snowboardingd | 650 | 7.6 |
| 4 | Horseback riding | 420 | 2.9 | Horseback riding | 600 | 7.0 |
| 5 | Other unspecified sports activityb | 260 | 1.8 | Roller skating and skateboarding | 240 | 2.8 |
| Ages 65+ years | 11,510 | 100.0 | Ages 65+ years | 17,330 | 100.0 | |
| 1 | Walking, marching, and hiking | 6,580 | 57.2 | Walking, marching, and hiking | 14,750 | 85.1 |
| 2 | Bicycle riding | 2,800 | 24.3 | Bicycle riding | 710 | 4.1 |
| 3 | Downhill skiing and snowboardingd | 330 | 2.9 | Ice and snow, other activity | 250 | 1.4 |
| 4 | Ice and snow, other activity | 230 | 2.0 | Other muscle strengthening | 190 | 1.1 |
| 5 | Horseback riding | 220 | 1.9 | Horseback riding | 150 | 0.9 |
| Notes: For fewer than 1% of inpatient stays, more than one sports activity was identified. In these cases, the stay is counted separately for each identified sports activity. a The tabled % value refers to the percentage of all sports-related inpatient stays for the specified sex-age group. b Physical games generally associated with school recess, summer camp, and children. c More specific information about the sports activity is not available in the ICD-9-CM diagnosis codes in this category. d Snow (alpine) (downhill) skiing, snowboarding, sledding, tobogganing, and snow tubing. Source: Agency for Healthcare Research and Quality (AHRQ), Center for Delivery, Organization, and Markets, Healthcare Cost and Utilization Project (HCUP), National Inpatient Sample (NIS), 2013 | ||||||
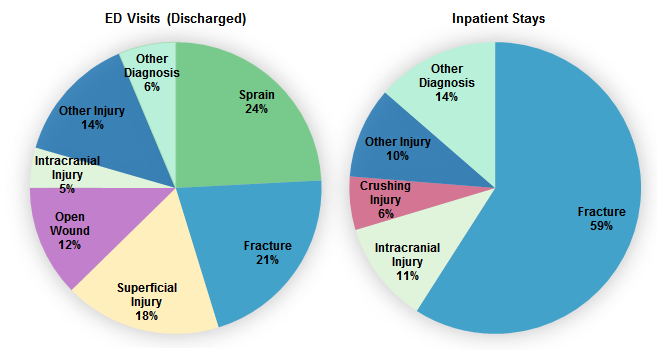
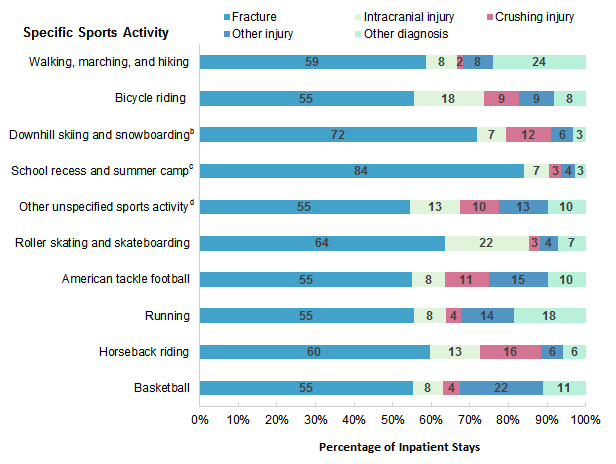
Figure 3 presents information on the types of injuries associated with sports-related ED visits (discharged) and hospital inpatient stays in 2013. |
|
Figure 3. Primary type of injurya associated with sports-related emergency department visits (discharged) and hospital inpatient stays, 2013
Abbreviation: ED, emergency department Figure 3 is a two-part pie chart—one part shows the percentage of discharged ED visits and the other shows the percentage of inpatient stays, both broken out by primary type of injury. Emergency department visits: sprain: 24; fracture: 21; superficial injury: 18; other injury: 14; open wound: 12; other diagnosis: 6; intracranial injury: 5. Inpatient stays: fracture: 59; other diagnosis: 14; intracranial injury: 11; other injury: 10; crushing injury: 6.
|
|
|
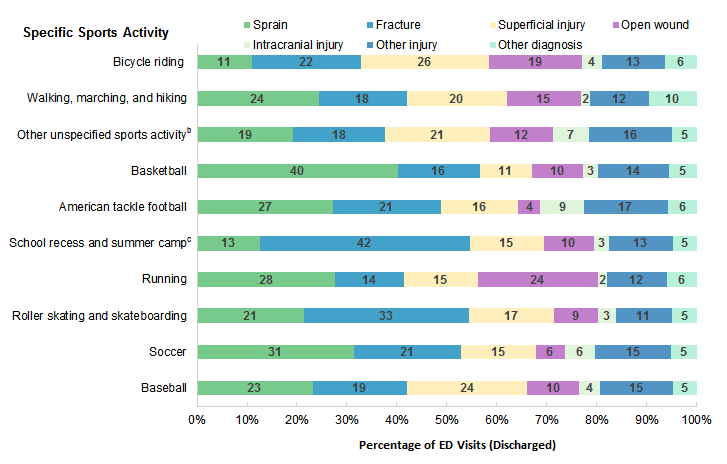
Figure 4. Primary type of injurya among the 10 most common sports activities associated with emergency department visits (discharged), 2013
Abbreviation: ED, emergency department Figure 4 is a stacked bar chart that shows the percentage of discharged ED visits by primary type of injury among the 10 most common sports activities. Bicycle riding: sprain: 11; fracture: 22; superficial injury: 26; open wound: 19; intracranial injury: 4; other injury: 13; other diagnosis: 6. Walking, marching, and hiking: sprain: 24; fracture: 18; superficial injury: 20; open wound: 15; intracranial injury: 2; other injury: 12; other diagnosis: 10. Other unspecified sports activity: sprain: 19; fracture: 18; superficial injury: 21; open wound: 12; intracranial injury: 7; other injury: 16; other diagnosis: 5. Basketball: sprain: 40; fracture: 16; superficial injury: 11; open wound: 10; intracranial injury: 3; other injury: 14; other diagnosis: 5. American tackle football: sprain: 27; fracture: 21; superficial injury: 16; open wound: 4; intracranial injury: 9; other injury: 17; other diagnosis: 6. School recess and summer camp: sprain: 13; fracture: 42; superficial injury: 15; open wound: 10; intracranial injury: 3; other injury: 13; other diagnosis: 5. Running: sprain: 28; fracture: 14; superficial injury: 15; open wound: 24; intracranial injury: 2; other injury: 12; other diagnosis: 6. Roller skating and skateboarding: sprain: 21; fracture: 33; superficial injury: 17; open wound: 9; intracranial injury: 3; other injury: 11; other diagnosis: 5. Soccer: sprain: 31; other injury: 21; superficial injury: 15; open wound: 6; intracranial injury: 6; other injury: 15; other diagnosis: 5. Baseball: sprain: 23; fracture: 19; superficial injury: 24; open wound: 10; intracranial injury: 4; other injury: 15; other diagnosis: 5.
|
|
|
Figure 5. Primary type of injurya among the 10 most common sports activities associated with hospital inpatient stays, 2013
Note: For fewer than 1% of inpatient stays, more than one sports activity was identified. In these cases, the visit or stay is counted separately for each identified sports activity. Figure 5 is a stacked bar chart that shows the percentage of inpatient stays by primary type of injury among the 10 most common sports activities. Walking, marching, and hiking: fracture: 59; intracranial injury: 8; crushing injury: 2; other injury: 8; other diagnosis: 24. Bicycle riding: fracture: 55; intracranial injury: 18; crushing injury: 9; other injury: 9; other diagnosis: 8. Downhill skiing and snowboarding: fracture: 72; intracranial injury: 7; crushing injury: 12; other injury: 6; other diagnosis: 3. School recess and summer camp: fracture: 84; intracranial injury: 7; crushing injury: 3; other injury: 4; other diagnosis: 3. Other unspecified sports activity: fracture: 55; intracranial injury: 13; crushing injury: 10; other injury: 13; other diagnosis: 10. Roller skating and skateboarding: fracture: 64; intracranial injury: 22; crushing injury: 3; other injury: 4; other diagnosis: 7. American tackle football: fracture: 55; intracranial injury: 8; crushing injury: 11; other injury: 15; other diagnosis: 10. Running: fracture: 55; intracranial injury: 8; crushing injury: 4; other injury: 14; other diagnosis: 18. Horseback riding: fracture: 60; intracranial injury: 13; crushing injury: 16; other injury: 6; other diagnosis: 6. Basketball: fracture: 55; intracranial injury: 8; crushing injury: 4; other injury: 22; other diagnosis: 11.
|
|
| Appendix A. Number of emergency department visits (discharged) and hospital inpatient stays associated with sports-related activities, by general type of and specific sports activity, 2013 | ||
| Sports activity | ED visits (discharged), n | Inpatient stays, n |
|---|---|---|
| All activities | 2,807,880 | 105,490 |
| Walking and running | 488,940 | 32,890 |
| Walking, marching, and hiking | 340,290 | 30,650 |
| Running | 148,650 | 2,240 |
| Water and water craft sports | 77,610 | 3,750 |
| Swimming | 26,750 | 770 |
| Springboard and platform diving | 8,340 | 860 |
| Water polo | 1,000 | * |
| Water aerobics and water exercise | 120 | * |
| Underwater diving and snorkeling | 3,100 | 210 |
| Rowing, canoeing, kayaking, rafting, and tubing | 5,340 | 170 |
| Water skiing and wake boarding | 6,080 | 420 |
| Surfing, windsurfing, and boogie boarding | 11,620 | 340 |
| Water sliding | 3,180 | * |
| Water and watercraft | 12,090 | 900 |
| Ice and snow sports | 134,770 | 7,170 |
| Ice skating | 12,530 | 360 |
| Ice hockey | 14,540 | 290 |
| Snow (alpine) (downhill) skiing, snowboarding, sledding, tobogganing, and snow tubing | 91,210 | 5,320 |
| Cross-country skiing | 620 | * |
| Ice and snow, other activity | 15,870 | 1,150 |
| Climbing, rappelling, and jumping off | 35,300 | 1,550 |
| Mountain climbing, rock climbing, and wall climbing | 3,380 | 370 |
| Rappelling | 180 | * |
| BASE jumping | 740 | * |
| Bungee jumping | 100 | * |
| Hang gliding | 130 | * |
| Climbing, rappelling, and jumping off, other activity | 30,760 | 1,050 |
| Dancing and other rhythmic movement | 113,330 | 1,770 |
| Dancing | 22,880 | 480 |
| Yoga | 1,010 | * |
| Gymnastics | 22,310 | 240 |
| Trampoline | 43,050 | 810 |
| Cheerleading | 18,490 | * |
| Dancing and other rhythmic movements, other activity | 5,574 | 150 |
| Other sports and athletics played individually | 580,740 | 35,630 |
| Roller skating (inline) and skateboarding | 143,780 | 4,600 |
| Horseback riding | 18,830 | 2,220 |
| Golf | 8,430 | 510 |
| Bicycle riding (total) | 383,790 | 26,530 |
| - Bicycle riding - Motor vehicle traffic | 49,230 | 6,810 |
| - Bicycle riding - Nontraffic vehicle | 2,370 | 240 |
| - Bicycle riding - Other bicycle accident | 332,190 | 19,470 |
| Jumping rope | 1,490 | * |
| Nonrunning track and field events | 1,070 | * |
| Other sports and athletics played individually, other activity | 18,110 | 1,540 |
| Other sports and athletics played as a team or group | 947,030 | 14,230 |
| American tackle football | 211,220 | 2,830 |
| American flag or touch football | 10,280 | 150 |
| Rugby | 6,640 | 140 |
| Baseball | 113,420 | 1,370 |
| Lacrosse and field hockey | 15,640 | 170 |
| Soccer | 128,950 | 1,820 |
| Basketball | 268,580 | 2,020 |
| Volleyball (beach) (court) | 27,870 | 170 |
| Physical games generally associated with school recess, summer camp, and children | 150,150 | 5,140 |
| Other sports and athletics played as a team or group, other activity | 14,270 | 400 |
| Other specified sports and athletics | 86,140 | 1,930 |
| Boxing | 6,390 | 110 |
| Wrestling | 40,920 | 490 |
| Racquet and hand sports | 9,800 | 150 |
| Frisbee | 2,830 | * |
| Martial arts | 15,450 | 160 |
| Other specified sports and athletics activity | 10,750 | 940 |
| Other cardiorespiratory exercise | 13,430 | 500 |
| Exercise machines primarily for cardiorespiratory conditioning | 4,900 | 230 |
| Calisthenics | 1,420 | * |
| Aerobic and step exercise | 1,800 | * |
| Circuit training | 220 | * |
| Obstacle course | 590 | * |
| Grass drills | 150 | * |
| Cardiorespiratory exercise, other activity | 4,370 | 200 |
| Other muscle strengthening exercises | 42,200 | 1,080 |
| Exercise machines primarily for muscle strengthening | 3,560 | 120 |
| Push-ups, pull-ups, sit-ups | 4,300 | * |
| Free weights | 21,300 | 300 |
| Pilates | 160 | 580 |
| Sports activity, not elsewhere classified | 288,380 | 4,970 |
| Abbreviations: BASE, building, antenna, span, earth; ED, Emergency department Note: For fewer than 1% of ED visits and inpatient stays, more than one sports activity was identified. In these cases, the visit or stay is counted separately for each identified sports activity. * Indicates fewer than 100 discharge records. Source: Agency for Healthcare Research and Quality (AHRQ), Center for Delivery, Organization, and Markets, Healthcare Cost and Utilization Project (HCUP), National Inpatient Sample (NIS) and Nationwide Emergency Department Sample (NEDS), 2013 | ||
Data Source
The estimates in this Statistical Brief are based upon data from the Healthcare Cost and Utilization Project (HCUP) 2013 National Inpatient Sample (NIS) and Nationwide Emergency Department Sample (NEDS). Definitions Diagnoses, ICD-9-CM, and Clinical Classifications Software (CCS) The principal diagnosis is that condition established after study to be chiefly responsible for the patient's admission to the hospital. Secondary diagnoses are concomitant conditions that coexist at the time of admission or develop during the stay. All-listed diagnoses include the principal diagnosis plus these additional secondary conditions. ICD-9-CM is the International Classification of Diseases, Ninth Revision, Clinical Modification, which assigns numeric codes to diagnoses. There are approximately 14,000 ICD-9-CM diagnosis codes. CCS categorizes ICD-9-CM diagnosis codes or procedure codes into a manageable number of clinically meaningful categories.11 This clinical grouper makes it easier to quickly understand patterns of diagnoses or procedure use. CCS categories identified as Other typically are not reported; these categories include miscellaneous, otherwise unclassifiable diagnoses or procedures that may be difficult to interpret as a group. Case definition In this study we focused on identifying sports activities using the ICD-9-CM "activity" external cause of injury codes (E codes), E001-E030, as presented in Table 4. We also searched to identify any other E codes that could indicate that the hospital stay or emergency department (ED) visit was associated with a sports activity. These additional E codes that were included as part of a specific sports activity category also are provided in Table 4. Finally, we included three E codes (E886.0, E917.0, and E917.5) that specified that an injury occurred during sports, but there was no further information provided (i.e., by a more specific E code on the record) to indicate which specific sports activity was involved. These records are coded to the "other unspecified sports" (sports not elsewhere classified) category. |
| Table 4. ICD-9-CM E codes identifying sports activities | |||
| ICD-9-CM activity E code | Sports activity description | ICD-9-CM other E code | Other E code description |
|---|---|---|---|
| Walking and running | |||
| E001.0 | Walking, marching, and hiking | ||
| E001.1 | Running | ||
| Water and water craft sports | |||
| E002.0 | Swimming | E830.5, E831.5, E832.5, E833.5, E834.5, E835.5, E836.5, E837.5, E838.5 | Water transport accidents injuring swimmer |
| E002.1 | Springboard and platform diving | E883.0 | Accident from diving or jumping into water (swimming pool) |
| E002.2 | Water polo | ||
| E002.3 | Water aerobics and water exercise | ||
| E002.4 | Underwater diving and snorkeling | E902.2 | High and low air pressure and changes in air pressure - due to diving |
| E910.1 | Accidental drowning and submersion while engaged in other sport or recreational activity with diving equipment | ||
| E002.5 | Rowing, canoeing, kayaking, rafting, and tubing | ||
| E002.6 | Water skiing and wakeboarding | E830.4, E831.4, E832.4, E833.4, E834.4, E835.4, E836.4, E837.4, E838.4 | Water transport accidents injuring water skier |
| E910.0 | Accidental drowning and submersion while water skiing | ||
| E002.7 | Surfing, windsurfing, and boogie boarding | ||
| E002.8 | Water sliding | ||
| E002.9 | Water and watercraft | E910.2 | Accidental drowning and submersion while engaged in other sport or recreational activity without diving equipment |
| Ice and snow sports | |||
| E003.0 | Ice skating | ||
| E003.1 | Ice hockey | ||
| E003.2 | Snow (alpine) (downhill) skiing, snowboarding, sledding, tobogganing, and snow tubing | E885.3, E885.4 | Fall from skis, snowboard |
| E003.3 | Cross-country skiing | ||
| E003.9 | Ice and snow, other activity | ||
| Climbing, rappelling, and jumping off | |||
| E004.0 | Mountain climbing, rock climbing, and wall climbing | ||
| E004.1 | Rappelling | ||
| E004.2 | BASE jumping | ||
| E004.3 | Bungee jumping | ||
| E004.4 | Hang gliding | ||
| E004.9 | Climbing, rappelling, and jumping off, other activity | ||
| Dancing and other rhythmic movement | |||
| E005.0 | Dancing | ||
| E005.1 | Yoga | ||
| E005.2 | Gymnastics | ||
| E005.3 | Trampoline | ||
| E005.4 | Cheerleading | ||
| E005.9 | Dancing and other rhythmic movements, other activity | ||
| Other sports and athletics played individually | |||
| E006.0 | Roller skating (inline) and skateboarding | E885.1, E885.2 | Fall from roller skates, skateboard |
| E006.1 | Horseback riding | ||
| E006.2 | Golf | ||
| E006.3 | Bowling | ||
| E006.4 | Bicycle riding | E800.3, E801.3, E802.3, E803.3, E804.3, E805.3, E806.3, E807.3 | Railway accidents injuring pedal cyclist |
| E810.6, E811.6, E812.6, E813.6, E814.6, E815.6, E816.6, E817.6, E818.6, E819.6 | Motor vehicle traffic accidents injuring pedal cyclist | ||
| E820.6, E821.6, E822.6, E823.6, E824.6, E825.6 | Motor vehicle nontraffic accidents injuring pedal cyclist | ||
| E826.1 | Pedal cycle accident injuring pedal cyclist | ||
| E006.5 | Jumping rope | ||
| E006.6 | Nonrunning track and field events | ||
| E006.6 | Nonrunning track and field events | ||
| E006.9 | Other sports and athletics played individually, other activity | ||
| Other sports and athletics played as a team or group | |||
| E007.0 | American tackle football | ||
| E007.1 | American flag or touch football | ||
| E007.2 | Rugby | ||
| E007.3 | Baseball | ||
| E007.4 | Lacrosse and field hockey | ||
| E007.5 | Soccer | ||
| E007.6 | Basketball | ||
| E007.7 | Volleyball (beach) (court) | ||
| E007.8 | Physical games generally associated with school recess, summer camp, and children | E884.0 | Fall from playground equipment |
| E007.9 | Other sports and athletics played as a team or group, other activity | ||
| Other specified sports and athletics | |||
| E008.0 | Boxing | ||
| E008.1 | Wrestling | ||
| E008.2 | Racquet and hand sports | ||
| E008.3 | Frisbee | ||
| E008.4 | Martial arts | ||
| E008.9 | Other specified sports and athletics activity | ||
| Other cardiorespiratory exercise | |||
| EE009.0 | Exercise machines primarily for cardiorespiratory conditioning | ||
| EE009.1 | Calisthenics | ||
| EE009.2 | Aerobic and step exercise | ||
| EE009.3 | Circuit training | ||
| EE009.4 | Obstacle course | ||
| EE009.5 | Grass drills | ||
| EE009.9 | Cardiorespiratory exercise, other activity | ||
| Other muscle strengthening exercises | |||
| E010.0 | Exercise machines primarily for muscle strengthening | ||
| E010.1 | Push-ups, pull-ups, sit-ups | ||
| E010.2 | Free weights | ||
| E010.3 | Pilates | ||
| E010.9 | Other muscle strengthening exercises, other activity | ||
| Sports activity, not elsewhere classified | |||
| Other unspecified sports activity | E886.0 | Fall on same level from collision, pushing, or shoving, by or with other person - in sports | |
| E917.0, E917.5 | Striking against or struck accidentally by objects or persons in sports, without or with subsequent fall | ||
| Abbreviation: BASE, building, antenna, span, earth | |||
Each relevant E code was classified into one of three categories:
|
| Table 5. Gun-related ICD-9-CM E codes not included | |
| ICD-9-CM E code | Description |
|---|---|
| E922.2 | Accident caused by hunting rifle |
| E922.4 | Accident caused by air gun |
| E922.5 | Accident caused by paintball gun |
Types of hospitals included in the HCUP National (Nationwide) Inpatient Sample The National (Nationwide) Inpatient Sample (NIS) is based on data from community hospitals, which are defined as short-term, non-Federal, general, and other hospitals, excluding hospital units of other institutions (e.g., prisons). The NIS includes obstetrics and gynecology, otolaryngology, orthopedic, cancer, pediatric, public, and academic medical hospitals. Excluded are long-term care facilities such as rehabilitation, psychiatric, and alcoholism and chemical dependency hospitals. Beginning in 2012, long-term acute care hospitals are also excluded. However, if a patient received long-term care, rehabilitation, or treatment for a psychiatric or chemical dependency condition in a community hospital, the discharge record for that stay will be included in the NIS. Types of hospitals included in the HCUP Nationwide Emergency Department Sample The Nationwide Emergency Department Sample (NEDS) is based on data from community hospitals, which are defined as short-term, non-Federal, general, and other hospitals, excluding hospital units of other institutions (e.g., prisons). The NEDS includes specialty, pediatric, public, and academic medical hospitals. Excluded are long-term care facilities such as rehabilitation, psychiatric, and alcoholism and chemical dependency hospitals. Hospitals included in the NEDS have hospital-owned emergency departments and no more than 90 percent of their ED visits resulting in admission. Unit of analysis The unit of analysis is the hospital discharge (i.e., the hospital stay) or the ED encounter, not a person or patient. This means that a person who is admitted to the hospital or seen in the ED multiple times in 1 year will be counted each time as a separate discharge from the hospital or encounter in the ED. About HCUP The Healthcare Cost and Utilization Project (HCUP, pronounced "H-Cup") is a family of healthcare databases and related software tools and products developed through a Federal-State-Industry partnership and sponsored by the Agency for Healthcare Research and Quality (AHRQ). HCUP databases bring together the data collection efforts of State data organizations, hospital associations, and private data organizations (HCUP Partners) and the Federal government to create a national information resource of encounter-level healthcare data. HCUP includes the largest collection of longitudinal hospital care data in the United States, with all-payer, encounter-level information beginning in 1988. These databases enable research on a broad range of health policy issues, including cost and quality of health services, medical practice patterns, access to healthcare programs, and outcomes of treatments at the national, State, and local market levels. HCUP would not be possible without the contributions of the following data collection Partners from across the United States: Alaska State Hospital and Nursing Home Association Arizona Department of Health Services Arkansas Department of Health California Office of Statewide Health Planning and Development Colorado Hospital Association Connecticut Hospital Association District of Columbia Hospital Association Florida Agency for Health Care Administration Georgia Hospital Association Hawaii Health Information Corporation Illinois Department of Public Health Indiana Hospital Association Iowa Hospital Association Kansas Hospital Association Kentucky Cabinet for Health and Family Services Louisiana Department of Health and Hospitals Maine Health Data Organization Maryland Health Services Cost Review Commission Massachusetts Center for Health Information and Analysis Michigan Health & Hospital Association Minnesota Hospital Association Mississippi Department of Health Missouri Hospital Industry Data Institute Montana MHA - An Association of Montana Health Care Providers Nebraska Hospital Association Nevada Department of Health and Human Services New Hampshire Department of Health & Human Services New Jersey Department of Health New Mexico Department of Health New York State Department of Health North Carolina Department of Health and Human Services North Dakota (data provided by the Minnesota Hospital Association) Ohio Hospital Association Oklahoma State Department of Health Oregon Association of Hospitals and Health Systems Oregon Office of Health Analytics Pennsylvania Health Care Cost Containment Council Rhode Island Department of Health South Carolina Revenue and Fiscal Affairs Office South Dakota Association of Healthcare Organizations Tennessee Hospital Association Texas Department of State Health Services Utah Department of Health Vermont Association of Hospitals and Health Systems Virginia Health Information Washington State Department of Health West Virginia Health Care Authority Wisconsin Department of Health Services Wyoming Hospital Association About Statistical Briefs HCUP Statistical Briefs are descriptive summary reports presenting statistics on hospital inpatient and emergency department use and costs, quality of care, access to care, medical conditions, procedures, patient populations, and other topics. The reports use HCUP administrative healthcare data. About the NIS The HCUP National (Nationwide) Inpatient Sample (NIS) is a national database of hospital inpatient stays. The NIS is nationally representative of all community hospitals (i.e., short-term, non-Federal, nonrehabilitation hospitals). The NIS includes all payers. It is drawn from a sampling frame that contains hospitals comprising more than 95 percent of all discharges in the United States. The vast size of the NIS allows the study of topics at the national and regional levels for specific subgroups of patients. In addition, NIS data are standardized across years to facilitate ease of use. Over time, the sampling frame for the NIS has changed; thus, the number of States contributing to the NIS varies from year to year. The NIS is intended for national estimates only; no State-level estimates can be produced. The 2012 NIS was redesigned to optimize national estimates. The redesign incorporates two critical changes:
About the NEDS The HCUP Nationwide Emergency Department Database (NEDS) is a unique and powerful database that yields national estimates of ED visits. The NEDS was constructed using records from both the HCUP State Emergency Department Databases (SEDD) and the State Inpatient Databases (SID). The SEDD capture information on ED visits that do not result in an admission (i.e., treat-and-release visits and transfers to another hospital); the SID contain information on patients initially seen in the ED and then admitted to the same hospital. The NEDS was created to enable analyses of ED utilization patterns and support public health professionals, administrators, policymakers, and clinicians in their decision making regarding this critical source of care. The NEDS is produced annually beginning in 2006. Over time, the sampling frame for the NEDS has changed; thus, the number of States contributing to the NEDS varies from year to year. The NEDS is intended for national estimates only; no State-level estimates can be produced. For More Information For more information about HCUP, visit http://www.hcup-us.ahrq.gov/. For additional HCUP statistics, visit HCUP Fast Stats at https://datatools.ahrq.gov/hcup-fast-stats for easy access to the latest HCUP-based statistics for health information topics, or visit HCUPnet, our interactive query system, at https://datatools.ahrq.gov/hcupnet. For information on other HIV hospitalizations in the United States, refer to the following HCUP Statistical Brief located at http://www.hcup-us.ahrq.gov/reports/statbriefs/statbriefs.jsp:
For a detailed description of HCUP and more information on the design of the National Inpatient Sample (NIS) and the Nationwide Emergency Department Sample (NEDS), please refer to the following database documentation: Agency for Healthcare Research and Quality. Overview of the National (Nationwide) Inpatient Sample (NIS). Healthcare Cost and Utilization Project (HCUP). Rockville, MD: Agency for Healthcare Research and Quality. Updated November 2016. http://www.hcup-us.ahrq.gov/nisoverview.jsp. Accessed February 17, 2016. Agency for Healthcare Research and Quality. Overview of the Nationwide Emergency Department Sample (NEDS). Healthcare Cost and Utilization Project (HCUP). Rockville, MD: Agency for Healthcare Research and Quality. Updated January 2016. http://www.hcup-us.ahrq.gov/nedsoverview.jsp. Accessed February 17, 2016. Suggested Citation Weiss AJ (Truven Health Analytics), Elixhauser A (AHRQ). Sports-Related Emergency Department Visits and Hospital Inpatient Stays, 2013. HCUP Statistical Brief #207. July 2016. Agency for Healthcare Research and Quality, Rockville, MD. http://www.hcup-us.ahrq.gov/reports/statbriefs/sb207-Sports-Hospital-Emergency-Department-2013.pdf. . Acknowledgments The authors would like to acknowledge the contributions of Minya Sheng and Kim McDermott of Truven Health Analytics. *** AHRQ welcomes questions and comments from readers of this publication who are interested in obtaining more information about access, cost, use, financing, and quality of healthcare in the United States. We also invite you to tell us how you are using this Statistical Brief and other HCUP data and tools, and to share suggestions on how HCUP products might be enhanced to further meet your needs. Please e-mail us at hcup@ahrq.gov or send a letter to the address below:David Knutson, Director Center for Delivery, Organization, and Markets Agency for Healthcare Research and Quality 5600 Fishers Lane Rockville, MD 20857 1 Physical Activity Council. 2016 Participation Report: The Physical Activity Council's Annual Study Tracking Sports, Fitness, and Recreation Participation in the US. s3.documentcloud.org/documents/2992593/Physical-Activity-Council-2016-Participation.pdf. 2 Centers for Disease Control and Prevention. CDC Injury Center Research Priorities. http://www.cdc.gov/injury/pdfs/researchpriorities/cdc-injury-research-priorities.pdf. Accessed March 11, 2016. 3 Centers for Disease Control and Prevention. Nonfatal sports- and recreation-related injuries treated in emergency departments—United States, July 2000-June 2001. MMWR Weekly. 2002;51(33):736-40. 4 Ibid. 5 Bayt DR, Bell TM. Trends in paediatric sports-related injuries presenting to US emergency departments, 2001-2013. Injury Prevention. 23 December 2015. Epub ahead of print. doi:10.1136/injuryprev-2015-041757 6 Ibid. 7 Wier L, Miller A, Steiner C. Sports injuries in children requiring hospital emergency care, 2006. HCUP Statistical Brief #75. June 2009. Agency for Healthcare Research and Quality, Rockville, MD. https://www.hcup-us.ahrq.gov/reports/statbriefs/sb75.pdf. Accessed March 9, 2016. 8 Centers for Disease Control and Prevention. Nonfatal traumatic brain injuries related to sports and recreation activities among persons aged ≤ 19 years—United States 2001-2009. 2011;60(39):1337-42. 9 Practice Management Information Corporation. International Classification of Diseases, 9th Revision, Clinical Modification, 6th ed. (ICD-9-CM), 2013. Hospital Edition, vols. 1, 2, and 3. Los Angeles, CA: Practice Management Information Corporation; 2012. 10 Barrett M, Steiner C. Healthcare Cost and Utilization Project (HCUP) External Cause of Injury Code (E Code) Evaluation Report (Updated with 2012 Data). 2015. HCUP Methods Series Report #2015-03 ONLINE. March 3, 2015. Agency for Healthcare Research and Quality. http://www.hcup-us.ahrq.gov/reports/methods/2015-03.pdf. Accessed April 18, 2016. 11 Agency for Healthcare Research and Quality. HCUP Clinical Classifications Software (CCS). Healthcare Cost and Utilization Project (HCUP). Rockville, MD: Agency for Healthcare Research and Quality. Updated June 2015. http://www.hcup-us.ahrq.gov/toolssoftware/ccs/ccs.jsp. Accessed February 17, 2016. |