STATISTICAL BRIEF #209 |
August 2016
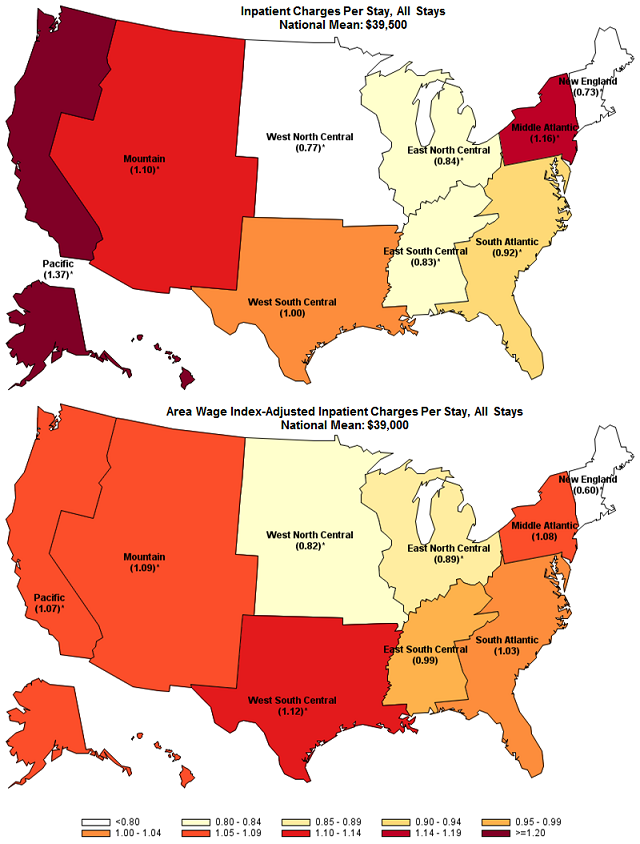
Zeynal Karaca, Ph.D., and Brian Moore, Ph.D. Introduction In the United States, each hospital has a chargemaster that contains the hospital's own list prices for all billable procedures and services performed at the hospital. Chargemasters use codes from the American Medical Association's Current Procedure Terminology system and the International Classification of Diseases, Ninth Revision, Clinical Modification (ICD-9-CM) procedure system.1 Hospital list prices, reported as charges in the Healthcare Cost and Utilization Project (HCUP) databases, reflect the amount the hospital billed for the entire hospital stay, usually excluding professional (physician) fees, and vary across hospitals and markets.2 Hospitals periodically update the list prices in their chargemasters to account for new procedure codes and changes in their operating costs, expected payer mix, expected service mix, and volumes.3 As a result, there might be substantial variation in charges for many individual items within the chargemaster over time and across hospitals and markets.4,5 Major public and private insurance providers negotiate a discount from the list prices with hospitals. Actual payments to hospitals by public and private payers are generally much lower than their reported list prices and are typically adjusted by an area wage index (AWI) to account for geographic variation across regions in labor costs, which represent a component of pricing that is to some degree beyond the hospital's control. Hospitals across different regions might experience sizable differences in reimbursement because of these AWI adjustments. This HCUP Statistical Brief presents variation in charges for inpatient stays in the United States in 2013. The variation in charges adjusted by an AWI6 also is presented to provide potential insight into the extent to which AWI adjustment accounts for geographic variation in hospitals' list prices. Mean charges per inpatient stay (with and without AWI adjustment) are calculated for each of the nine U.S. census divisions for all payers, Medicare, Medicaid, and private insurance. For each payer group, mean charges in each census division then are divided by mean charges nationally, and ratios are presented in maps to estimate the direction and magnitude of the difference in mean charges between each division and the nation as a whole. Ratios with values greater than 1.0 indicate divisions with mean charges that are greater than the national mean; values less than 1.0 indicate divisions with mean charges that are less than the national mean. All differences between estimates noted in the text are statistically significant at the 0.05 level or better. Findings Mean inpatient charges for all payers, by census division, 2013 Figure 1 displays the ratios of U.S. census division-level mean charges relative to the national mean values per inpatient stay for all payers. In the top map charges are unadjusted, and in the bottom map charges are adjusted by the AWI. |
|
|
Figure 1. Ratio of mean inpatient charges per stay relative to the national mean by census division, unadjusted and adjusted by area wage index, 2013
*Statistically significant difference from 1.00 at the 0.05 level or better Figure 1 is made up of two maps, one with unadjusted inpatient charges per stay and the second with those inpatient charges adjusted by the area wage index by census division in 2013. Ratio of charges to national mean of $39,500: Pacific: 1.37; Middle Atlantic: 1.16; Mountain: 1.10; West South Central: 1.00; South Atlantic: 0.92; East North Central: 0.84; East South Central: 0.83; West North Central: 0.77; New England: 0.73. Ratio of area wage index-adjusted charges to national mean of $39,000: West South Central: 1.12; Mountain: 1.09; Middle Atlantic: 1.08; Pacific: 1.07; South Atlantic: 1.03; East South Central: 0.99; East North Central: 0.89; West North Central: 0.82; New England: 0.60.
|
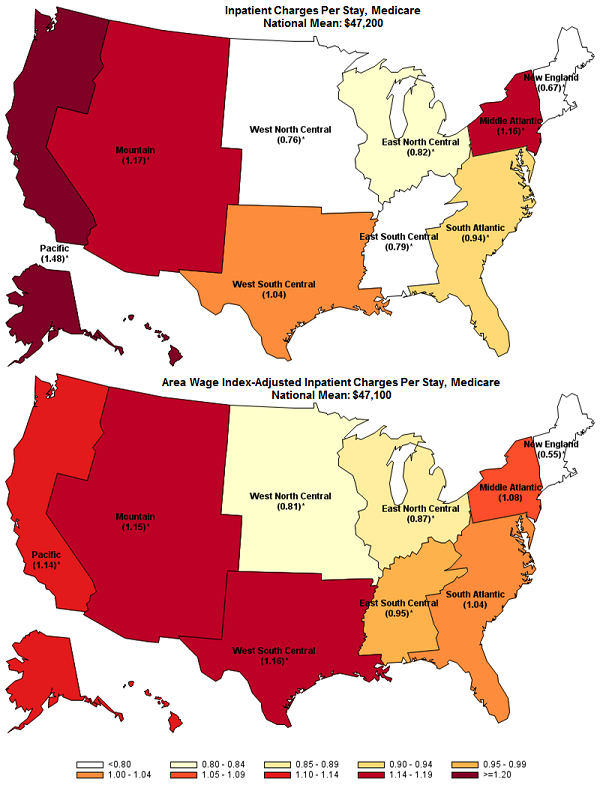
Mean inpatient charges for Medicare stays, by census division, 2013 Figure 2 displays the ratios of U.S. census division-level mean charges relative to the national mean values per hospital inpatient stay for Medicare stays, unadjusted and then adjusted by the AWI. |
|
Figure 2. Ratio of mean inpatient charges per Medicare stay relative to the national Medicare mean by census division, unadjusted and adjusted by area wage index, 2013
*Statistically significant difference from 1.00 at the 0.05 level or better Figure 2 is made up of two maps, one with unadjusted inpatient charges per Medicare stay and the second with those inpatient charges adjusted by the area wage index by census division in 2013. Ratio of unadjusted charges to national mean of $47,200: Pacific: 1.48; Mountain: 1.17; Middle Atlantic: 1.16; West South Central: 1.04; South Atlantic: 0.94; East North Central: 0.82; East South Central: 0.79; West North Central: 0.76; New England: 0.67. Ratio of area wage index-adjusted charges to national mean of $47,100: West South Central: 1.16; Mountain: 1.15; Pacific: 1.14; Middle Atlantic: 1.08; South Atlantic: 1.04; East South Central: 0.95; East North Central: 0.87; West North Central: 0.81; New England: 0.55.
|
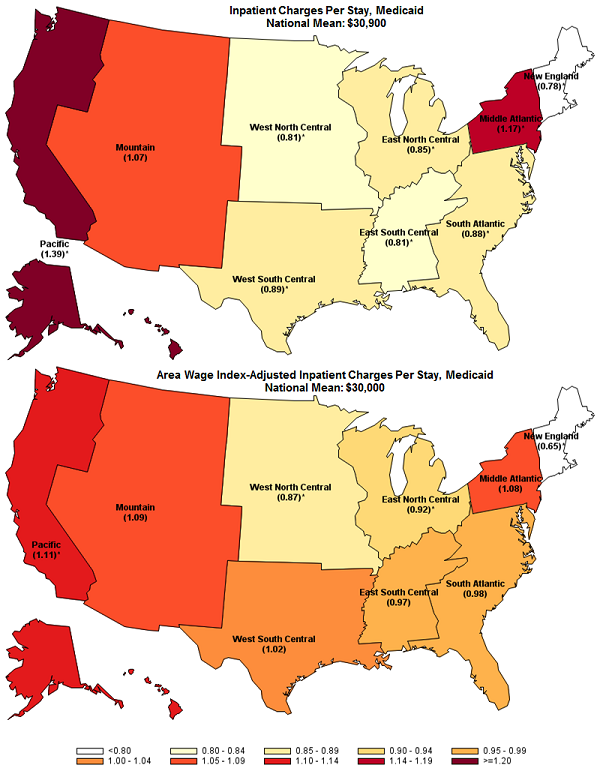
Mean inpatient charges for Medicaid stays, by census division, 2013 Figure 3 displays the ratios of U.S. census division-level mean charges relative to the national mean values per hospital inpatient stay for Medicaid stays, unadjusted and then adjusted by the AWI. |
|
Figure 3. Ratio of mean inpatient charges per Medicaid stay relative to the national Medicaid mean, by census division, unadjusted and adjusted by area wage index, 2013
*Statistically significant difference from 1.00 at the 0.05 level or better Figure 3 is made up of two maps, one with unadjusted inpatient charges per Medicaid stay and the second with those inpatient charges adjusted by the area wage index by census division in 2013. Ratio of unadjusted charges to national mean of $30,900: Pacific: 1.39; Middle Atlantic: 1.17; Mountain: 1.07; West South Central: 0.89; South Atlantic: 0.88; East North Central: 0.85; East South Central: 0.81; West North Central: 0.81; New England: 0.78. Ratio of area wage index-adjusted charges to national mean of stay $30,000: Pacific: 1.11; Mountain: 1.09; Middle Atlantic: 1.08; West South Central: 1.02; South Atlantic: 0.98; East South Central: 0.97; East North Central: 0.92; West North Central: 0.87; New England: 0.65.
|
|
|
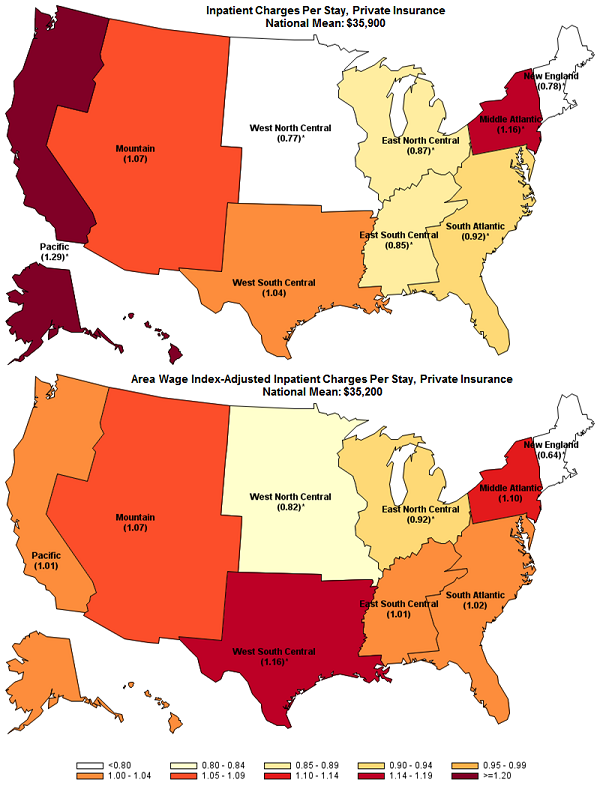
Figure 4. Ratio of mean inpatient charges per privately insured stay relative to the national privately insured mean, by census division, unadjusted and adjusted by area wage index, 2013
*Statistically significant difference from 1.00 at the 0.05 level or better Figure 4 is made up of two maps, one with unadjusted inpatient charges per privately insured stay and the second with those inpatient charges adjusted by the area wage index by census division in 2013. Ratio of unadjusted charges to national mean of $35,900: Pacific: 1.29; Middle Atlantic: 1.16; Mountain: 1.07; West South Central: 1.04; South Atlantic: 0.92; East North Central: 0.87; East South Central: 0.85; New England: 0.78; West North Central: 0.77. Ratio of area wage index-adjusted charges to national mean of $35,200: West South Central: 1.16; Middle Atlantic: 1.10; Mountain: 1.07; South Atlantic: 1.02; Pacific: 1.01; East South Central: 1.01; East North Central: 0.92; West North Central: 0.82; New England: 0.64.
|
Mean inpatient charges for privately insured stays, by census division, 2013 Figure 4 displays the ratios of U.S. census division-level mean charges relative to the national mean values per hospital inpatient stay for privately insured stays, unadjusted and then adjusted by the AWI. Data Source The estimates in this Statistical Brief are based upon data from the Healthcare Cost and Utilization Project (HCUP) 2013 National Inpatient Sample (NIS). All differences between estimates noted in the text are statistically significant at the 0.05 level or better. Definitions Types of hospitals included in the HCUP National Inpatient Sample The National Inpatient Sample (NIS) is based on data from community hospitals, which are defined as short-term, non-Federal, general, and other hospitals, excluding hospital units of other institutions (e.g., prisons). The NIS includes obstetrics and gynecology, otolaryngology, orthopedic, cancer, pediatric, public, and academic medical hospitals. Excluded are long-term care facilities such as rehabilitation, psychiatric, and alcoholism and chemical dependency hospitals. Beginning in 2012, long-term acute care hospitals are also excluded. However, if a patient received long-term care, rehabilitation, or treatment for a psychiatric or chemical dependency condition in a community hospital, the discharge record for that stay will be included in the NIS. Unit of analysis The unit of analysis is the hospital discharge (i.e., the hospital stay), not a person or patient. This means that a person who is admitted to the hospital multiple times in 1 year will be counted each time as a separate discharge from the hospital. Charges Charges represent the amount a hospital billed for the case. Hospital charges reflect the amount the hospital billed for the entire hospital stay and do not include professional (physician) fees. For the purposes of this Statistical Brief, charges are reported to the nearest hundred. Area wage index The area wage index is an index computed by the Centers for Medicare & Medicaid Services (CMS) to measure the relative hospital wage level in a geographic area compared with the national average hospital wage level. It is provided on the HCUP Cost-to-Charge (CCR) file to allow researchers to analyze cost differences geographically or to control for price factors beyond the hospital's control.7 Payer Payer is the expected payer for the hospital stay. To make coding uniform across all HCUP data sources, payer combines detailed categories into general groups:
Hospital stays billed to the State Children's Health Insurance Program (SCHIP) may be classified as Medicaid, Private Insurance, or Other, depending on the structure of the State program. Because most State data do not identify patients in SCHIP specifically, it is not possible to present this information separately. For this Statistical Brief, when more than one payer is listed for a hospital discharge, the first-listed payer is used. Division Division corresponds to the location of the hospital and is one of the nine divisions defined by the U.S. Census Bureau:
About HCUP The Healthcare Cost and Utilization Project (HCUP, pronounced "H-Cup") is a family of healthcare databases and related software tools and products developed through a Federal-State-Industry partnership and sponsored by the Agency for Healthcare Research and Quality (AHRQ). HCUP databases bring together the data collection efforts of State data organizations, hospital associations, and private data organizations (HCUP Partners) and the Federal government to create a national information resource of encounter-level healthcare data. HCUP includes the largest collection of longitudinal hospital care data in the United States, with all-payer, encounter-level information beginning in 1988. These databases enable research on a broad range of health policy issues, including cost and quality of health services, medical practice patterns, access to healthcare programs, and outcomes of treatments at the national, State, and local market levels. HCUP would not be possible without the contributions of the following data collection Partners from across the United States: Alaska State Hospital and Nursing Home Association Arizona Department of Health Services Arkansas Department of Health California Office of Statewide Health Planning and Development Colorado Hospital Association Connecticut Hospital Association District of Columbia Hospital Association Florida Agency for Health Care Administration Georgia Hospital Association Hawaii Health Information Corporation Illinois Department of Public Health Indiana Hospital Association Iowa Hospital Association Kansas Hospital Association Kentucky Cabinet for Health and Family Services Louisiana Department of Health and Hospitals Maine Health Data Organization Maryland Health Services Cost Review Commission Massachusetts Center for Health Information and Analysis Michigan Health & Hospital Association Minnesota Hospital Association Mississippi Department of Health Missouri Hospital Industry Data Institute Montana MHA - An Association of Montana Health Care Providers Nebraska Hospital Association Nevada Department of Health and Human Services New Hampshire Department of Health & Human Services New Jersey Department of Health New Mexico Department of Health New York State Department of Health North Carolina Department of Health and Human Services North Dakota (data provided by the Minnesota Hospital Association) Ohio Hospital Association Oklahoma State Department of Health Oregon Association of Hospitals and Health Systems Oregon Office of Health Analytics Pennsylvania Health Care Cost Containment Council Rhode Island Department of Health South Carolina Revenue and Fiscal Affairs Office South Dakota Association of Healthcare Organizations Tennessee Hospital Association Texas Department of State Health Services Utah Department of Health Vermont Association of Hospitals and Health Systems Virginia Health Information Washington State Department of Health West Virginia Health Care Authority Wisconsin Department of Health Services Wyoming Hospital Association About Statistical Briefs HCUP Statistical Briefs are descriptive summary reports presenting statistics on hospital inpatient and emergency department use and costs, quality of care, access to care, medical conditions, procedures, patient populations, and other topics. The reports use HCUP administrative healthcare data. About the NIS The HCUP National Inpatient Sample (NIS) is a national database of hospital inpatient stays. The NIS is nationally representative of all community hospitals (i.e., short-term, non-Federal, nonrehabilitation hospitals). The NIS includes all payers. It is drawn from a sampling frame that contains hospitals comprising more than 95 percent of all discharges in the United States. The vast size of the NIS allows the study of topics at the national and regional levels for specific subgroups of patients. In addition, NIS data are standardized across years to facilitate ease of use. Over time, the sampling frame for the NIS has changed; thus, the number of States contributing to the NIS varies from year to year. The NIS is intended for national estimates only; no State-level estimates can be produced. The 2012 NIS was redesigned to optimize national estimates. The redesign incorporates two critical changes:
For More Information For more information about HCUP, visit http://www.hcup-us.ahrq.gov/. For additional HCUP statistics, visit HCUP Fast Stats at https://datatools.ahrq.gov/hcup-fast-stats for easy access to the latest HCUP-based statistics for health information topics, or visit HCUPnet, our interactive query system, at https://datatools.ahrq.gov/hcupnet. For information on other hospitalizations in the United States, refer to the following HCUP Statistical Briefs located at http://www.hcup-us.ahrq.gov/reports/statbriefs/statbriefs.jsp:
For a detailed description of HCUP and more information on the design of the National Inpatient Sample (NIS), please refer to the following database documentation: Agency for Healthcare Research and Quality. Overview of the National (Nationwide) Inpatient Sample (NIS). Healthcare Cost and Utilization Project (HCUP). Rockville, MD: Agency for Healthcare Research and Quality. Updated November 2015. http://www.hcup-us.ahrq.gov/nisoverview.jsp. Accessed February 17, 2016. Suggested Citation Karaca Z (AHRQ), Moore B (Truven Health Analytics). Geographic Variation in Hospital Inpatient List Prices in the United States, 2013. HCUP Statistical Brief #209. August 2016. Agency for Healthcare Research and Quality, Rockville, MD. http://www.hcup-us.ahrq.gov/reports/statbriefs/sb209-Geographic-Variation-Hospital-Inpatient-Prices.pdf. Acknowledgments The authors would like to acknowledge the contributions of Minya Sheng of Truven Health Analytics. *** AHRQ welcomes questions and comments from readers of this publication who are interested in obtaining more information about access, cost, use, financing, and quality of healthcare in the United States. We also invite you to tell us how you are using this Statistical Brief and other HCUP data and tools, and to share suggestions on how HCUP products might be enhanced to further meet your needs. Please e-mail us at hcup@ahrq.gov or send a letter to the address below:David Knutson, Director Center for Delivery, Organization, and Markets Agency for Healthcare Research and Quality 5600 Fishers Lane Rockville, MD 20857 This Statistical Brief was posted online on August 30, 2016. 1 Tompkins CP, Altman SH, Eilat E. The precarious pricing system for hospital services. Health Affairs. 2006 Jan 1;25(1):45-56. 2 For more details, see Charges in the Definitions section or the NIS Description of Data Elements entry for TOTCHG at http://hcup-us.ahrq.gov/db/vars/totchg/nisnote.jsp. Accessed August 3, 2016. 3 Tompkins et al., 2006. Op. cit. 4 Reinhardt, UE. The pricing of U.S. hospital services: chaos behind a veil of secrecy. Health Affairs. 2006 Jan 1;25(1):57-69. 5 Sanger-Katz M, Thomas K. Data shows large rise in list prices at hospitals. The New York Times. 2015 Jun 1. http://www.nytimes.com/2015/06/02/business/medicare-payments-billing-hospitals-doctors.html. 6 Agency for Healthcare Research and Quality. HCUP Cost-to-Charge Ratio (CCR) Files. Healthcare Cost and Utilization Project (HCUP). 2013. Rockville, MD: Agency for Healthcare Research and Quality. Updated October 2015. http://www.hcup-us.ahrq.gov/db/state/costtocharge.jsp. Accessed January 25, 2016. 7 Agency for Healthcare Research and Quality. HCUP Cost-to-Charge Ratio (CCR) Files. Healthcare Cost and Utilization Project (HCUP). 2013. Rockville, MD: Agency for Healthcare Research and Quality. Updated November 2015. http://www.hcup-us.ahrq.gov/db/state/costtocharge.jsp. Accessed February 17, 2016. |