STATISTICAL BRIEF #212 |
October 2016
Janet P. Sutton, Ph.D., and Claudia A. Steiner, M.D., M.P.H. Introduction Methicillin-resistant Staphylococcus aureas (MRSA) is a bacterium that is resistant to many of the most commonly prescribed beta-lactam antibiotics, including penicillin, amoxycillin, oxacillin, and methicillin. Severe cases of MRSA may result in endocarditis, osteomyelitis, septicemia, or even death. Each year MRSA accounts for approximately 11,000 deaths in the United States.1 Costs associated with a MRSA infection are high, with an average hospital length of stay of 10 days and average hospital costs of $14,000. The average length of stay and hospital costs associated with MRSA are approximately 2 times higher than those of other hospital stays.2 MRSA typically is classified as hospital acquired; healthcare acquired, community onset; or community acquired, community onset. Hospital-acquired MRSA usually is the result of a nosocomial infection, often acquired following a surgical or invasive medical procedure during a hospital stay. Healthcare-acquired MRSA develops outside the hospital while the patient is in the community and has had recent contact or received treatment in a healthcare facility, such as an inpatient hospital, ambulatory surgical center, dialysis center, or nursing facility.3 Community-acquired MRSA occurs among community-dwelling individuals without recent hospitalization or encounters with the healthcare system. Centers for Disease Control and Prevention data indicate that between 2005 and 2011 the incidence of hospital-acquired MRSA dropped by more than 50 percent. During this same period the incidence of community-acquired MRSA decreased by only 5 percent.4 This HCUP Statistical Brief examines inpatient hospital stays with MRSA in California in 2013. Inpatient stays are categorized by clinical condition associated with MRSA—pneumonia, septicemia, cellulitis or skin ulcers, complications following surgery or medical care, and other clinical conditions. Patients with a MRSA-associated hospital admission who acquired the infection during the course of the hospitalization are then compared with those who acquired the infection following receipt of treatment or care in a healthcare facility in the past 90 days or who acquired the infection in the community. Healthcare facilities include inpatient hospital settings, emergency departments, and ambulatory surgery facilities. Differences greater than 10 percent are noted in the text. Findings Hospital inpatient stays with MRSA, California, 2013 Figure 1 presents data on the percentage of MRSA-related inpatient stays in California hospitals by clinical condition. If a patient had more than one stay in the year, each inpatient stay is counted separately. |
|
|
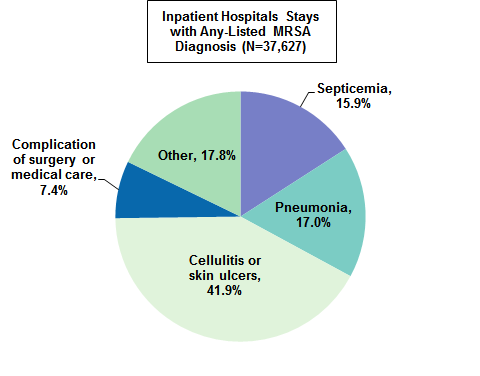
Figure 1. MRSA-associated inpatient stays in California hospitals by clinical condition associated with MRSA, 2013
Abbreviation: MRSA, methicillin-resistant Staphylococcus aureas Figure 1 is a pie chart that shows the percentage of MRSA-associated hospital stays in California in 2013 by clinical condition associated with MRSA. Septicemia: 15.9; pneumonia: 17.0; cellulitis and skin ulcers: 41.9; complications of surgery or medical care: 7.4; other: 17.8.
|
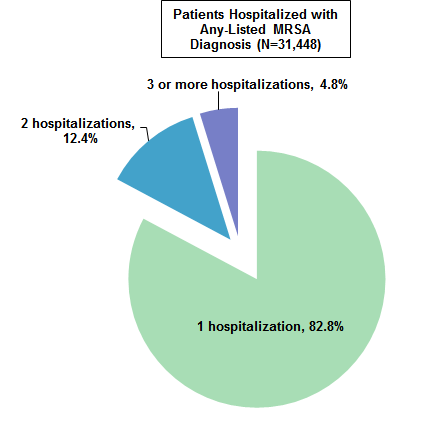
Figure 2 displays the number of single and multiple hospitalizations among patients with a MRSA-associated admission that occurred during 2013. The subsequent analyses track patients across multiple MRSA hospitalizations. Patients are counted once rather than counting each hospital stay. |
|
Figure 2. Percentage distribution of the number of MRSA-associated hospital stays among patients with at least one MRSA admission in California, 2013
Abbreviation: MRSA, methicillin-resistant Staphylococcus aureas Figure 2 is a pie chart that shows the percentage distribution of MRSA-associated hospital stays among patients with at least one MRSA admission in California in 2013. Patients with 1 MRSA hospitalization: 82.8; 2 MRSA hospitalizations: 12.4; 3+ MRSA hospitalizations: 4.8.
|
Table 1 presents data on the demographic characteristics of the 31,448 patients who were hospitalized with a MRSA diagnosis in 2013. |
| Table 1. Characteristics of patients with one or more MRSA hospitalizations by clinical condition associated with MRSA in California, 2013 | |||||
| Patient characteristic | Clinical condition associated with MRSA, % | ||||
|---|---|---|---|---|---|
| Septicemia | Pneumonia | Cellulitis or skin ulcers | Complications of surgery or medical care | Other | |
| Sex | |||||
| Male | 59.8 | 56.7 | 59.3 | 55.3 | 52.7 |
| Female | 40.2 | 43.2 | 40.6 | 44.7 | 47.3 |
| Age, years | |||||
| <18 | 0.8 | 1.1 | 2.3 | 2.3 | 2.8 |
| 18-44 | 12.5 | 7.6 | 22.4 | 13.7 | 17.4 |
| 45-64 | 34.5 | 24.5 | 38.4 | 35.5 | 30.4 |
| 65-84 | 38.5 | 45.1 | 26.9 | 38.1 | 32.4 |
| 85+ | 13.7 | 21.6 | 10.0 | 10.3 | 17.0 |
| Race/Ethnicity | |||||
| White | 56.8 | 59.9 | 59.9 | 61.0 | 59.3 |
| Black | 12.0 | 8.4 | 9.3 | 11.0 | 10.9 |
| Hispanic | 21.9 | 17.6 | 24.3 | 18.9 | 20.5 |
| Other | 9.4 | 14.2 | 6.5 | 9.1 | 9.3 |
| Primary payer | |||||
| Medicare | 64.1 | 71.8 | 48.0 | 58.6 | 56.9 |
| Medicaid | 16.6 | 13.9 | 20.4 | 16.4 | 19.0 |
| Private insurance | 11.7 | 10.0 | 15.4 | 17.4 | 14.0 |
| Self-pay | 2.6 | 1.5 | 6.7 | 1.7 | 3.2 |
| Other | 5.0 | 2.8 | 9.5 | 6.0 | 6.9 |
| Abbreviation: MRSA, methicillin-resistant Staphylococcus aureas Notes: Clinical condition and patient characteristics were defined at the patient's first MRSA hospital stay in 2013. Source: Agency for Healthcare Research and Quality (AHRQ), Center for Delivery, Organization, and Markets, Healthcare Cost and Utilization Project (HCUP), State Inpatient Database (SID), California, 2013 | |||||
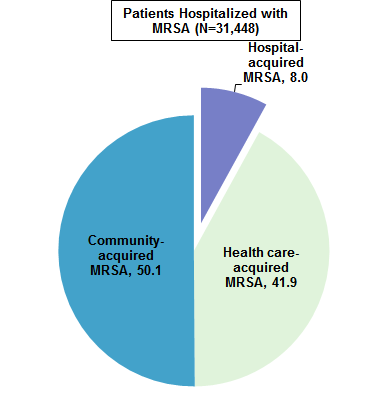
Hospital-acquired, healthcare-acquired, and community-acquired MRSA, California, 2013 Figure 3 displays the percentage of patients who acquired MRSA during the same hospitalization or developed MRSA outside of the hospital. |
|
Figure 3. Percentage of patients with a MRSA-associated hospital stay in California by type of MRSA, 2013
Abbreviation: MRSA, methicillin-resistant Staphylococcus aureas Figure 3 is a pie chart that shows the percentage of patients with a MRSA-associated hospital stay in California in 2013 by type of MRSA. HA-MRSA: 8.0; HCA-MRSA: 41.9; CA-MRSA: 50.1.
|
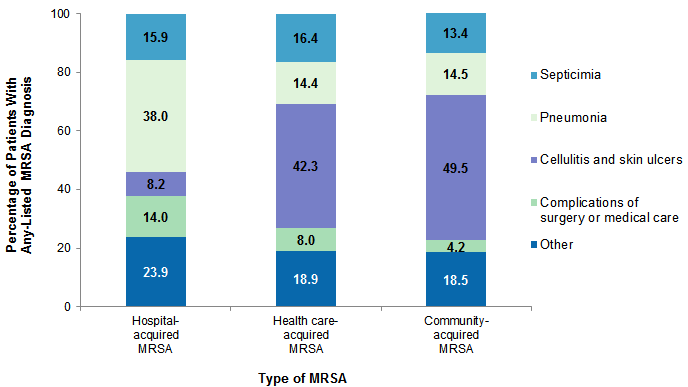
Figure 4 displays the clinical conditions associated with the type of MRSA admission. |
|
Figure 4. Distribution of clinical conditions associated with MRSA in California by type of MRSA, 2013
Abbreviation: MRSA, methicillin-resistant Staphylococcus aureas Figure 4 is a stacked bar chart that shows the percentage of patients with any-listed MRSA diagnosis in California in 2013 by type of MRSA. HA-MRSA: septicemia: 15.9; pneumonia: 38.0; cellulitis & skin ulcers: 8.2; complications of surgery or medical care: 14.0; other: 23.9. HCA-MRSA: septicemia: 16.4; pneumonia: 14.4; cellulitis & skin ulcers: 42.3; complications of surgery or medical care: 8.0; other: 18.9. CA-MRSA: septicemia: 13.4; pneumonia: 14.5; cellulitis & skin ulcers: 49.5; complications of surgery or medical care: 4.2; other: 18.5.
|
Data Source This Statistical Brief reports on hospitalizations for MRSA-related stays using the 2013 California State Inpatient Database (SID). In order to categorize whether a patient had a hospital-acquired, healthcare-acquired, or community-acquired MRSA-associated hospitalization, the 2012-2013 California SID, State Emergency Department Database (SEDD), and State Ambulatory Surgery and Services Database (SASD) were used to assess whether the patient had an inpatient, emergency department, or ambulatory surgery encounter within 90 days prior to the MRSA inpatient admission date. Definitions Diagnoses, ICD-9-CM, and Clinical Classifications Software (CCS) The principal diagnosis is that condition established after study to be chiefly responsible for the patient's admission to the hospital. Secondary diagnoses are concomitant conditions that coexist at the time of admission or that develop during the stay. ICD-9-CM is the International Classification of Diseases, Ninth Revision, Clinical Modification, which assigns numeric codes to diagnoses. There are approximately 14,000 ICD-9-CM diagnosis codes. CCS categorizes ICD-9-CM diagnoses into a manageable number of clinically meaningful categories.5 This clinical grouper makes it easier to quickly understand patterns of diagnoses. The CCS corresponding to the top Other MRSA diagnoses are identified in Table 2. |
| Table 2. CCS categories corresponding to the top Other MRSA diagnoses | |
| CCS | Definition |
|---|---|
| 3 | Bacterial infection, unspecified site |
| 58 | Other nutritional, endocrine, and metabolic disorders |
| 55 | Fluid and electrolyte disorders |
| 59 | Anemia |
| 50 | Diabetes mellitus with complications |
| 98 | Essential hypertension |
| 95 | Other nervous system disorders |
| 257 | Other aftercare |
| 663 | Screening and history of mental health and substance abuse codes |
| 101 | Coronary atherosclerosis |
| Abbreviations: CCS, Clinical Classifications Software; MRSA, methicillin-resistant Staphylococcus aureas | |
Case definition
MRSA admissions were identified with the principal or secondary diagnosis codes listed in Table 3. |
| Table 3. Diagnosis codes associated with MRSA admissions | ||
| MRSA | Principal and Secondary MRSA Diagnosis Codes | |
|---|---|---|
| Septicemia: ICD-9-CM 038.12 or (ICD-9-CM 041.12 and CCS 2) | ICD-9-CM 038.12 | Methicillin-resistant Staphylococcus aureus septicemia |
| ICD-9-CM 041.12 | Methicillin-resistant Staphylococcus aureus in conditions classified elsewhere and of unspecified site | |
| CCS 2 | Septicemia | |
| Pneumonia: ICD-9-CM 482.42 or (ICD-9-CM 041.12 and CCS 122) | ICD-9-CM 482.42 | Methicillin-susceptible pneumonia due to Staphylococcus aureus |
| ICD-9-CM 041.12 | Methicillin-resistant Staphylococcus aureus in conditions classified elsewhere and of unspecified site | |
| CCS 122 | Pneumonia | |
| Cellulitis and skin ulcers: ICD-9-CM 041.12 and (CCS 197 or CCS 199) | ICD-9-CM 041.12 | Methicillin-resistant Staphylococcus aureus in conditions classified elsewhere and of unspecified site |
| CCS 197 | Skin and subcutaneous tissue infections | |
| CCS 199 | Chronic ulcer of the skin | |
| Complications of medical device, surgical procedure or medical care: ICD-9-CM 041.12 and (CCS 237 or CCS 238) | ICD-9-CM 041.12 | Methicillin-resistant Staphylococcus aureus in conditions classified elsewhere and of unspecified site |
| CCS 237 | Complications of device, implant or graft | |
| CCS 238 | Complications of surgical procedures or medical care | |
| Other | ICD-9-CM 041.12 | Methicillin-resistant Staphylococcus aureus in conditions classified elsewhere and of unspecified site |
| Abbreviations: CCS, Clinical Classifications Software; ICD-9-CM, International Classification of Diseases, Ninth Revision, Clinical Modification; MRSA, methicillin-resistant Staphylococcus aureas | ||
For the subgroup of admissions with multiple MRSA diagnosis codes, the following hierarchical assignment was used: septicemia; pneumonia; cellulitis and skin ulcers; complications of medical device, surgical procedure or medical care; other.
Number of MRSA hospitalizations Individuals with multiple MRSA admissions were identified as any patients with a principal or secondary MRSA diagnosis who experienced one or more hospitalizations with a MRSA principal or secondary diagnosis during the calendar year. With the exception that the second admission had to occur during the same calendar year, no restriction was placed on the number of days between the index hospitalization and the following MRSA admission. Types of hospitals included in HCUP State Inpatient Databases This analysis used State Inpatient Databases (SID) limited to data from community hospitals, which are defined as short-term, non-Federal, general, and other hospitals, excluding hospital units of other institutions (e.g., prisons). Community hospitals include obstetrics and gynecology, otolaryngology, orthopedic, cancer, pediatric, public, and academic medical hospitals. Excluded for this analysis are long-term care facilities such as rehabilitation, psychiatric, and alcoholism and chemical dependency hospitals. However, if a patient received long-term care, rehabilitation, or treatment for a psychiatric or chemical dependency condition in a community hospital, the discharge record for that stay was included in the analysis. Unit of analysis For Figure 1 of this Brief, the unit of analysis is the hospital discharge (i.e., the hospital stay), not a person or patient. This means that a person who is admitted to the hospital multiple times in 1 year will be counted each time as a separate admission to a hospital. For subsequent analyses, the unit of analysis is the patient. This Statistical Brief uses an encrypted linkage number provided by California in the State databases to track patients across time. Patients with multiple MRSA admissions were identified as those with two or more hospitalizations occurring at any time within the 2013 calendar year, regardless of the number of days between hospitalizations. For the subgroup of patients with multiple MRSA admissions, data on patient-level characteristics, diagnosis, and prior utilization of health services (which was used to identify patients with healthcare-acquired MRSA) were gathered from records corresponding to the index admission. The index admission was determined as the first admission in the 2013 calendar year with a principal or secondary MRSA diagnosis. Patients represented in these analyses include those aged 1 year or older. Present on admission The present on admission (POA) indicator provides information on whether a condition was present at the time the patient was admitted to the hospital or the condition developed between the time that the patient was admitted and discharged from the hospital. Hospitals included in this analysis were restricted to those with reliable reporting of the POA indicator. Hospitals were dropped from the analysis based on the following edit checks: (1) all diagnoses were listed as POA for all discharges, (2) POA indicator was missing on all non-Medicare discharges, or (3) hospital reported POA as missing on all diagnoses nonexempt from POA reporting for 15 percent or more of discharges. Classification of MRSA Community-acquired MRSA hospitalizations were identified as those with a principal or secondary MRSA diagnosis that was present on admission. Patients with community-acquired MRSA did not have an inpatient hospitalization, a visit to an emergency department, or a visit to a ambulatory surgery center in the 90-day period prior to the MRSA hospitalization Healthcare-acquired MRSA hospitalizations were identified as those with a principal or secondary MRSA diagnosis that was present on admission. These stays had at least one healthcare service—hospitalization, emergency department visit, or ambulatory surgery visit—in the 90-day period prior to the MRSA hospitalization. Hospital-acquired MRSA hospitalizations were those with a principal or secondary MRSA diagnosis that was not present on admission; this indiates that the MRSA condition developed during the hospitalization. About HCUP HCUP is a family of powerful healthcare databases, software tools, and products for advancing research. Sponsored by the Agency for Healthcare Research and Quality (AHRQ), HCUP includes the largest all-payer encounter-level collection of longitudinal healthcare data (inpatient, ambulatory surgery, and emergency department) in the United States, beginning in 1988. HCUP is a Federal-State-Industry Partnership that brings together the data collection efforts of many organizations—such as State data organizations, hospital associations, private data organizations, and the Federal government—to create a national information resource. HCUP would not be possible without the contributions of the following data collection Partners from across the United States: Alaska State Hospital and Nursing Home Association Arizona Department of Health Services Arkansas Department of Health California Office of Statewide Health Planning and Development Colorado Hospital Association Connecticut Hospital Association District of Columbia Hospital Association Florida Agency for Health Care Administration Georgia Hospital Association Hawaii Health Information Corporation Illinois Department of Public Health Indiana Hospital Association Iowa Hospital Association Kansas Hospital Association Kentucky Cabinet for Health and Family Services Louisiana Department of Health and Hospitals Maine Health Data Organization Maryland Health Services Cost Review Commission Massachusetts Center for Health Information and Analysis Michigan Health & Hospital Association Minnesota Hospital Association Mississippi Department of Health Missouri Hospital Industry Data Institute Montana MHA - An Association of Montana Health Care Providers Nebraska Hospital Association Nevada Department of Health and Human Services New Hampshire Department of Health & Human Services New Jersey Department of Health New Mexico Department of Health New York State Department of Health North Carolina Department of Health and Human Services North Dakota (data provided by the Minnesota Hospital Association) Ohio Hospital Association Oklahoma State Department of Health Oregon Association of Hospitals and Health Systems Oregon Office of Health Analytics Pennsylvania Health Care Cost Containment Council Rhode Island Department of Health South Carolina Revenue and Fiscal Affairs Office South Dakota Association of Healthcare Organizations Tennessee Hospital Association Texas Department of State Health Services Utah Department of Health Vermont Association of Hospitals and Health Systems Virginia Health Information Washington State Department of Health West Virginia Health Care Authority Wisconsin Department of Health Services Wyoming Hospital Association About Statistical Briefs HCUP Statistical Briefs are descriptive summary reports presenting statistics on hospital inpatient and emergency department use and costs, quality of care, access to care, medical conditions, procedures, patient populations, and other topics. The reports use HCUP administrative healthcare data. About the SID The HCUP State Inpatient Databases (SID) are hospital inpatient databases from data organizations participating in HCUP. The SID contain the universe of the inpatient discharge abstracts in the participating HCUP States, translated into a uniform format to facilitate multistate comparisons and analyses. Together, the SID encompass more than 95 percent of all U.S. community hospital discharges. The SID can be used to investigate questions unique to one State, to compare data from two or more States, to conduct market area variation analyses, and to identify State-specific trends in inpatient care utilization, access, charges, and outcomes. About the SEDD The HCUP State Emergency Department Databases (SEDD) include information from hospital-owned emergency departments (EDs) from data organizations participating in HCUP, translated into a uniform format to facilitate multistate comparisons and analyses. The SEDD capture information on ED visits that do not result in an admission to the same hospital (i.e., patients who are treated in the ED and then discharged, transferred to another hospital, left against medical advice, or died). The SEDD contain a core set of clinical and nonclinical information on all patients, including individuals covered by Medicare, Medicaid, or private insurance, as well as those who are uninsured. The SEDD can be used to investigate questions unique to one State, to compare data from two or more States, to conduct market-area variation analyses, and to identify State-specific trends in injury surveillance, emerging infections, and other conditions treated in the ED. About the SASD The HCUP State Ambulatory Surgery and Services Databases (SASD) include encounter-level data for ambulatory surgeries and may also include various types of outpatient services such as observation stays, lithotripsy, radiation therapy, imaging, chemotherapy, and labor and delivery. The specific types of ambulatory surgery and outpatient services included in each SASD vary by State and data year. All SASD include data from hospital-owned ambulatory surgery facilities. In addition, some States include data from facilities not owned by a hospital. The designation of a facility as hospital-owned is specific to its financial relationship with a hospital that provides inpatient care and is not related to its physical location. Hospital-owned ambulatory surgery and other outpatient care facilities may be contained within the hospital, physically attached to the hospital, or located in a different geographic area. For More Information For other information on infectious diseases, including MRSA, refer to the HCUP Statistical Briefs located at http://www.hcup-us.ahrq.gov/reports/statbriefs/sb_infectious.jsp. For additional HCUP statistics, visit:
For more information about HCUP, visit http://www.hcup-us.ahrq.gov/. For a detailed description of HCUP and more information on the design of the State Inpatient Databases (SID), State Emergency Department Databases (SEDD), and State Ambulatory Surgery and Services Databases (SASD), please refer to the following database documentation: Agency for Healthcare Research and Quality. Overview of the State Inpatient Databases (SID). Healthcare Cost and Utilization Project (HCUP). Rockville, MD: Agency for Healthcare Research and Quality. Updated January 2016. http://www.hcup-us.ahrq.gov/sidoverview.jsp. Accessed February 17, 2016. Agency for Healthcare Research and Quality. Overview of the State Emergency Department Databases (SEDD). Healthcare Cost and Utilization Project (HCUP). Rockville, MD: Agency for Healthcare Research and Quality. Updated January 2016. http://www.hcup-us.ahrq.gov/seddoverview.jsp. Accessed February 17, 2016. Agency for Healthcare Research and Quality. Overview of the State Ambulatory Surgery and Services Databases (SASD). Healthcare Cost and Utilization Project (HCUP). Rockville, MD: Agency for Healthcare Research and Quality. Updated November 2015. http://www.hcup-us.ahrq.gov/sasdoverview.jsp. Accessed February 17, 2016. Suggested Citation Sutton J (Social & Scientific Systems, Inc.), Steiner CA (AHRQ). Hospital-, Health Care-, and Community-Acquired MRSA: Estimates From California Hospitals, 2013. Statistical Brief #212. October 2016. Agency for Healthcare Research and Quality, Rockville, MD. http://www.hcup-us.ahrq.gov/reports/statbriefs/sb212-MRSA-Hospital-Stays-California-2013.pdf Acknowledgments The authors would like to acknowledge the contributions of Valeriy Bakaushin of Social & Scientific Systems, Inc. *** AHRQ welcomes questions and comments from readers of this publication who are interested in obtaining more information about access, cost, use, financing, and quality of healthcare in the United States. We also invite you to tell us how you are using this Statistical Brief and other HCUP data and tools, and to share suggestions on how HCUP products might be enhanced to further meet your needs. Please e-mail us at hcup@ahrq.gov or send a letter to the address below:David Knutson, Director Center for Delivery, Organization, and Markets Agency for Healthcare Research and Quality 5600 Fishers Lane Rockville, MD 20857 This Statistical Brief was posted online on October 11, 2016. 1 Centers for Disease Control and Prevention. Antibiotic Resistance Threats in the United States, 2013. September 2013. www.cdc.gov/drugresistance/threat-report-2013/. 2 Elixhauser A (AHRQ), Steiner C (AHRQ). Infections With Methicillin-Resistant Staphylococcus Aureus (MRSA) in U.S. Hospitals, 1993-2005. HCUP Statistical Brief #35. July 2007. Agency for Healthcare Research and Quality, Rockville, MD. http://www.hcup-us.ahrq.gov/reports/statbriefs/sb35.pdf. Accessed September 27, 2016. 3 Evans RP. The Silent Epidemic: CA-MRSA and HA-MRSA. AAOS Now. Rosemont, IL: American Association of Orthopedic Surgeons; June 2013. www.pacosm.com/specialtopics/infdisease/AAOS%20NOW%20May%202008%20The%20Silent%20Epidemic%20CA-MRSA%20&%20HA-MRSA%20page%2022.pdf. 4 Dantes R, Mu Y, Belflower R, Aragon D, Dumyati G, Harrison LH, et al. National burden of invasive methicillin-resistant Staphylococcus aureus infections, United States, 2011. JAMA Internal Medicine. 2013;173(21):1970-8. 5 Agency for Healthcare Research and Quality. HCUP Clinical Classifications Software (CCS). Healthcare Cost and Utilization Project (HCUP). Rockville, MD: Agency for Healthcare Research and Quality. Updated June 2015. http://www.hcup-us.ahrq.gov/toolssoftware/ccs/ccs.jsp. Accessed February 17, 2016. |