STATISTICAL BRIEF #213 |
October 2016
Janet Pagon Sutton, Ph.D., Raynard E. Washington, Ph.D., Kathryn R. Fingar, Ph.D., M.P.H., and Anne Elixhauser, Ph.D. Introduction As defined by the Institute of Medicine, the healthcare safety net comprises hospitals and other providers that organize and deliver a significant level of healthcare and other health-related services to patients with no insurance or with Medicaid.1 Often referred to as providers of last resort, safety-net hospitals (SNHs) have historically assumed a major role in the provision of comprehensive services to medically and socially vulnerable populations.2 Provisions of the Affordable Care Act such as State Medicaid expansions and health insurance exchanges, which were implemented in January 2014, have effectively extended healthcare coverage to millions of uninsured individuals in the United States. Despite the reduction in the number of uninsured individuals and additional reductions that may be expected as States continue to consider Medicaid expansion, demand for safety-net providers is expected to remain high. Following passage of healthcare reform in Massachusetts, substantial reductions in the number of uninsured individuals were accompanied by increased utilization of SNH services.3 This Healthcare Cost and Utilization Project (HCUP) Statistical Brief examines the characteristics of SNHs and all inpatient stays at these facilities in 2014 among 40 States that constitute approximately 90 percent of the U.S. population. SNHs are compared with non-safety-net hospitals (non-SNHs). To define safety-net status, the percentage of Medicaid and uninsured inpatient hospitals stays, out of all stays at the hospital, was computed. Hospitals were ranked within States, and SNHs were defined as those with a percentage of Medicaid and uninsured discharges in the top quartile within the State, which is consistent with past research.4,5,6 In 2014, there were 4,103 total community nonrehabilitation hospitals (i.e., acute care hospitals) across these 40 States, of which the top quartile, or 1,040 hospitals, were defined as SNHs—hospitals with the largest percentage of Medicaid and uninsured discharges. Differences between SNHs and non-SNHs of greater than 10 percent are noted in the text. Findings Characteristics of SNHs and non-SNHs, 2014 Table 1 presents institutional hospital characteristics according to safety-net status in 2014. |
|
| Table 1. Institutional characteristics by safety net status in 40 States, 2014 | ||||
| Hospital characteristic | SNH | Non-SNH | ||
|---|---|---|---|---|
| N | % | N | % | |
| Total hospitals | 1,040 | 100.0 | 3,063 | 100.0 |
| Ownership | ||||
| Public | 203 | 19.7 | 574 | 19.1 |
| Private, nonprofit | 625 | 60.7 | 1,780 | 59.3 |
| Private, for-profit | 201 | 19.5 | 649 | 21.6 |
| Teaching status | ||||
| Teaching | 332 | 31.9 | 501 | 16.4 |
| Nonteaching | 708 | 68.1 | 2,562 | 83.6 |
| Bed size | ||||
| Small | 340 | 33.0 | 1,612 | 53.7 |
| Medium | 322 | 31.3 | 700 | 23.3 |
| Large | 367 | 35.7 | 691 | 23.0 |
| Location of hospital | ||||
| Large central metropolitan | 285 | 27.4 | 547 | 17.9 |
| Large fringe metropolitan | 119 | 11.4 | 506 | 16.5 |
| Medium metropolitan | 136 | 13.1 | 502 | 16.4 |
| Small metropolitan | 85 | 8.2 | 332 | 10.8 |
| Micropolitan | 233 | 22.4 | 459 | 15.0 |
| Noncore | 182 | 17.5 | 717 | 23.4 |
| Abbreviation: SNH, safety-net hospital Note: SNHs were defined as those with a percentage of Medicaid and uninsured discharges in the top quartile within the State. Source: Agency for Healthcare Research and Quality (AHRQ), Center for Delivery, Organization, and Markets, Healthcare Cost and Utilization Project (HCUP), State Inpatient Databases (SID), 40 States, 2014 | ||||
Characteristics of discharges at SNHs and non-SNHs, 2014 Table 2 presents demographic characteristics and the service line of inpatient stays among SNHs and non-SNHs in 2014. |
| Table 2. Characteristics of inpatient stays by safety net status in 40 States, 2014 | ||||
| Characteristic | SNH | Non-SNH | ||
|---|---|---|---|---|
| N | % | N | % | |
| Total discharges | 10,008,899 | 100.0 | 20,628,167 | 100.0 |
| Age, years | ||||
| 0-17 | 2,102,097 | 21.0 | 2,749,500 | 13.3 |
| 18-44 | 2,817,232 | 28.2 | 4,748,921 | 23.0 |
| 45-64 | 2,433,125 | 24.3 | 5,100,838 | 24.7 |
| 65-84 | 2,085,871 | 20.9 | 6,117,279 | 29.7 |
| 85+ | 565,642 | 5.7 | 1,903,438 | 9.2 |
| Sex | ||||
| Male | 4,317,598 | 43.1 | 8,778,364 | 42.6 |
| Female | 5,689,422 | 56.9 | 11,845,278 | 57.4 |
| Location of residence | ||||
| Large central metropolitan | 3,937,493 | 39.6 | 5,721,691 | 27.8 |
| Large fringe metropolitan | 1,808,960 | 18.2 | 5,479,722 | 26.7 |
| Medium metropolitan | 1,951,418 | 19.6 | 4,120,416 | 20.0 |
| Small metropolitan | 751,046 | 7.6 | 2,129,362 | 10.4 |
| Micropolitan | 883,613 | 8.9 | 1,736,467 | 8.4 |
| Rural (noncore) | 614,042 | 6.2 | 1,363,819 | 6.6 |
| Median income in ZIP Code of residence | ||||
| Quartile 1 (lowest) | 3,991,602 | 41.2 | 4,836,286 | 23.9 |
| Quartile 2 | 2,490,430 | 25.7 | 5,410,291 | 26.7 |
| Quartile 3 | 1,915,464 | 19.8 | 5,224,512 | 25.8 |
| Quartile 4 (highest) | 1,287,954 | 13.3 | 4,798,717 | 23.7 |
| Expected payer | ||||
| Medicare | 3,130,458 | 31.3 | 8,763,895 | 42.6 |
| Medicaid | 3,470,519 | 34.7 | 3,466,433 | 16.8 |
| Private | 2,407,460 | 24.1 | 6,963,270 | 33.8 |
| Uninsured | 673,009 | 6.7 | 810,699 | 3.9 |
| Other | 315,276 | 3.2 | 582,513 | 2.8 |
| Service line | ||||
| Maternal and neonatal | 2,584,490 | 25.8 | 4,424,911 | 21.5 |
| Mental health | 767,521 | 7.7 | 1,013,510 | 4.9 |
| Injury | 523,764 | 5.2 | 918,130 | 4.5 |
| Surgical | 1,644,195 | 16.4 | 4,389,899 | 21.3 |
| Medical | 4,488,929 | 44.8 | 9,881,717 | 47.9 |
| Abbreviation: SNH, safety-net hospital Note: SNHs were defined as those with a percentage of Medicaid and uninsured discharges in the top quartile within the State. Source: Agency for Healthcare Research and Quality (AHRQ), Center for Delivery, Organization, and Markets, Healthcare Cost and Utilization Project (HCUP), State Inpatient Databases (SID), 40 States, 2014 | ||||
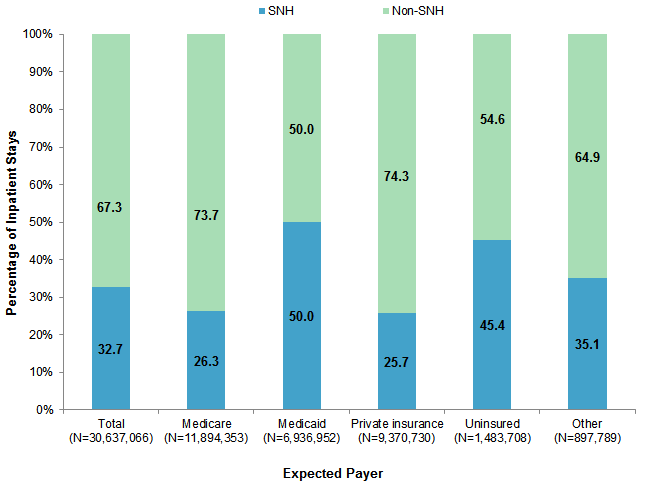
Share of inpatient hospital stays across SNHs and non-SNHs, 2014 Figure 1 presents the proportion of inpatient hospital stays overall and among each expected payer category that occurred at SNHs and non-SNHs in 2014. Note that these percentages use a denominator of all stays in each payer category. In contrast, Table 2 displays the percentage of discharges in each payer category, using a denominator of all discharges at SNHs or at non-SNHs. |
|
Figure 1. Percentage of inpatient hospital stays at SNHs and non-SNHs overall and by expected payer in 40 States, 2014
Abbreviation: SNH, safety-net hospital Stacked bar chart showing the percentage of inpatient hospital stays at safety-net hospitals and non-safety-net hospitals by payer. Total (N = 30,637,066): 67.3% non-SNH, 32.7% SNH. Medicare (N = 11,894,353): 73.7% non-SNH, 26.3% SNH. Medicaid (N = 6,936,952): 50.0% non-SNH, 50.0% SNH. Private insurance (N = 9,370,730): 74.3% non-SNH, 25.7% SNH. Uninsured (N = 1,483,708): 54.6% non-SNH, 45.4% SNH. Other (N = 897,789): 64.9% non-SNH, 35.1% SNH.
|
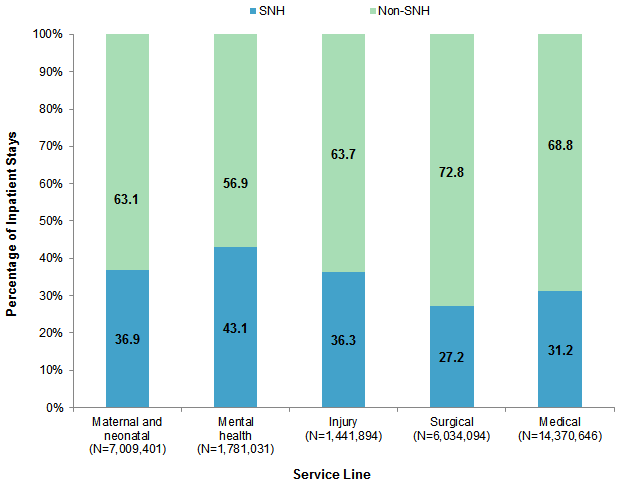
Figure 2 presents the proportion of inpatient hospital stays in each service line—maternal and neonatal, mental health, injury, surgical, and medical—that occurred at SNHs and non-SNHs in 2014. Note that these percentages use a denominator of all stays in a service line, whereas Table 2 displays the percentage of discharges in each service line, using a denominator of all discharges at SNHs or at non-SNHs. |
|
Figure 2. Percentage of inpatient hospital stays that occurred at SNHs and non-SNHs by service line in 40 States, 2014
Abbreviation: SNH, safety-net hospital Stacked bar chart showing the percentage of inpatient hospital stays at safety-net hospitals and non-safety net hospitals by service line. Maternal and neonatal (N = 7,009,401): 63.1% non-SNH; 36.9% SNH. Mental health (N = 1,781,031): 56.9% non-SNH; 43.1% SNH. Injury (N = 1,441,894): 63.7% non-SNH; 36.3% SNH. Surgical (N = 6,034,094): 72.8% non-SNH; 27.2% SNH. Medical (N = 14,370,646): 68.8% non-SNH; 31.2% SNH.
|
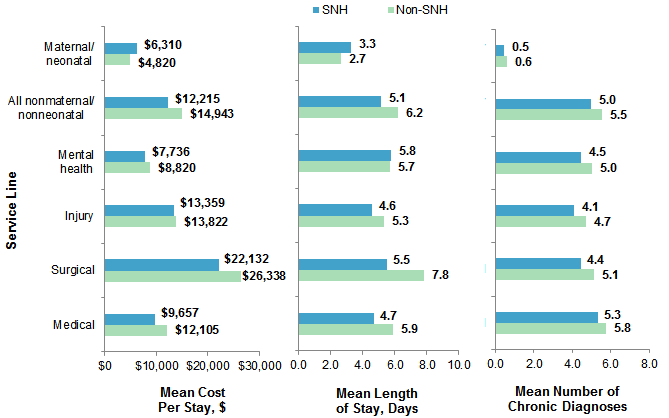
Inpatient hospital utilization according to safety-net status, 2014 Figure 3 presents measures of hospital utilization among SNHs and non-SNHs overall and by service line. The cost per stay, length of stay, and number of chronic condition diagnoses were averaged across inpatient stays at each hospital and then averaged across all hospitals, separately for SNHs and non-SNHs. |
|
Figure 3. Hospital utilization by safety-net status and service line in 40 States, 2014
Abbreviations: SNH, safety-net hospital Three-part bar chart showing cost, length of stay, and number of chronic diagnoses by safety-net status and service line. Mean cost per stay in dollars: maternal/neonatal: 6,310 SNH, 4,820 non-SNH; all nonmaternal/nonneonatal: 12,215 SNH, 14,943 non-SNH; mental health: 7,736 SNH, 8,820 non-SNH; injury: 13,359 SNH, 13,822 non-SNH; surgical: 22,132 SNH, 26,338 non-SNH; medical: 9,657 SNH, 12,105 non-SNH. Mean length of stay in days: maternal/neonatal: 3.3 SNH, 2.7 non-SNH; all nonmaternal/nonneonatal: 5.1 SNH, 6.2 non-SNH; mental health: 5.8 SNH, 5.7 non-SNH; injury: 4.6 SNH, 5.3 non-SNH; surgical: 5.5 SNH, 7.8 non-SNH; medical: 4.7 SNH, 5.9 non-SNH. Mean number of chronic diagnoses: maternal/neonatal: 0.5 SNH, 0.6 non-SNH; all nonmaternal/nonneonatal: 5.0 SNH, 5.5 non-SNH; mental health: 4.5 SNH, 5.0 non-SNH; injury: 4.1 SNH, 4.7 non-SNH; surgical: 4.4 SNH, 5.1 non-SNH; medical: 5.3 SNH, 5.8 non-SNH.
|
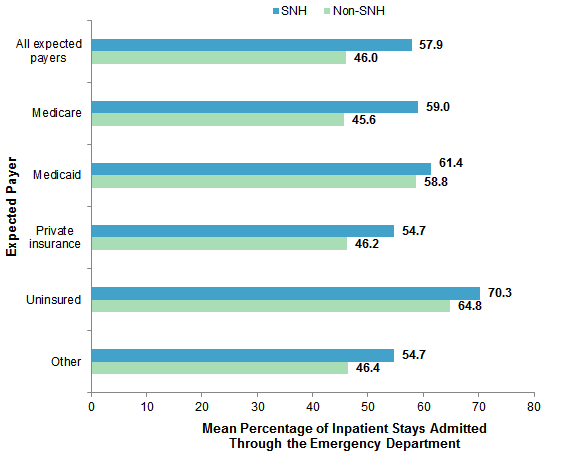
Figure 4 displays the mean percentage of inpatient stays that were admitted through the emergency department (ED) across SNHs and non-SNHs, by expected payer. The percentage of inpatient stays admitted through the ED was calculated for each hospital and then averaged across all hospitals, separately for SNHs and non-SNHs. |
|
Figure 4. Mean percentage of nonmaternal and nonneonatal inpatient stays with emergency department services by safety-net status and expected payer in 40 States, 2014
Abbreviations: SNH, safety-net hospital Bar chart showing mean percentage of inpatient stays admitted through the emergency department by safety-net status and expected payer. All expected payers: 57.9% SNH, 46.0% non-SNH. Medicare: 59.0% SNH, 45.6% non-SNH. Medicaid: 61.4% SNH, 58.8% non-SNH. Private insurance: 54.7% SNH, 46.2% non-SNH. Uninsured: 70.3% SNH, 64.8% non-SNH. Other: 54.7% SNH, 46.4% non-SNH.
|
Leading reasons for inpatient hospital stays at SNHs and non-SNHs, 2014 Table 3 presents the leading reasons for nonmaternal and nonneonatal inpatient stays at SNH and non-SNHs in 2014. |
| Table 3. Top 10 nonmaternal and nonneonatal principal diagnoses by safety-net status in 40 States, 2014 | ||||||
| Principal diagnosis | SNH | Non-SNH | ||||
|---|---|---|---|---|---|---|
| Rank | Number of Stays | Stays % | Rank | Number of Stays | Stays % | |
| Septicemia (except in labor) | 1 | 385,529 | 3.9 | 1 | 946,887 | 4.6 |
| Mood disorders | 2 | 308,630 | 3.1 | 6 | 416,011 | 2.0 |
| Pneumonia | 3 | 223,389 | 2.2 | 4 | 525,443 | 2.5 |
| Congestive heart failure | 4 | 220,589 | 2.2 | 3 | 550,746 | 2.7 |
| Schizophrenia, other psychotic disorders | 5 | 182,581 | 1.8 | |||
| Diabetes mellitus with complications | 6 | 167,954 | 1.7 | |||
| Osteoarthritis | 7 | 167,491 | 1.7 | 2 | 732,715 | 3.6 |
| Skin and subcutaneous tissue infections | 8 | 162,644 | 1.6 | |||
| Complication of device; implant or graft | 9 | 159,791 | 1.6 | 7 | 388,731 | 1.9 |
| Acute cerebrovascular disease | 10 | 152,549 | 1.5 | 9 | 366,750 | 1.8 |
| Cardiac dysrhythmias | 5 | 425,076 | 2.1 | |||
| Acute myocardial infarction | 8 | 382,329 | 1.9 | |||
| Spondylosis; intervertebral disc disorders; other back problems | 10 | 364,659 | 1.8 | |||
| Abbreviation: SNH, safety-net hospital Notes: SNHs were defined as those with a percentage of Medicaid and uninsured discharges in the top quartile within the State. Principal diagnoses were identified using the Agency for Healthcare Research and Quality (AHRQ) Clinical Classifications Software (CCS) diagnosis categories. Source: AHRQ, Center for Delivery, Organization, and Markets, Healthcare Cost and Utilization Project (HCUP), State Inpatient Databases (SID), 40 States, 2014 | ||||||
Table 4 presents the leading all-listed operating room procedures performed among nonmaternal and nonneonatal inpatient stays at SNHs and non-SNHs in 2014. |
| Table 4. Top 10 nonmaternal and nonneonatal operating room procedures by safety-net status in 40 States, 2014 | ||||||
| All-listed procedures | SNH | Non-SNH | ||||
|---|---|---|---|---|---|---|
| Rank | Number of Stays | Stays % | Rank | Number of Stays | Stays % | |
| Arthroplasty knee | 1 | 122,952 | 1.2 | 1 | 509,030 | 2.5 |
| Percutaneous transluminal coronary angioplasty | 2 | 106,286 | 1.1 | 5 | 296,491 | 1.4 |
| Cholecystectomy and common duct exploration | 3 | 96,518 | 1.0 | 7 | 227,479 | 1.1 |
| Spinal fusion | 4 | 91,775 | 0.9 | 3 | 307,336 | 1.5 |
| Hip replacement; total and partial | 5 | 86,754 | 0.9 | 2 | 357,003 | 1.7 |
| Partial excision bone | 6 | 83,544 | 0.8 | 6 | 228,634 | 1.1 |
| Laminectomy; excision intervertebral disc | 7 | 81,610 | 0.8 | 4 | 297,199 | 1.4 |
| Excision; lysis peritoneal adhesions | 8 | 73,351 | 0.7 | 10 | 175,419 | 0.9 |
| Appendectomy | 9 | 72,874 | 0.7 | |||
| Treatment; fracture or dislocation of hip and femur | 10 | 71,704 | 0.7 | 9 | 177,057 | 0.9 |
| Colorectal resection | 8 | 194,256 | 0.9 | |||
| Abbreviation: SNH, safety-net hospital Notes: SNHs were defined as those with a percentage of Medicaid and uninsured discharges in the top quartile within the State. Principal operating room procedures were identified using the Agency for Healthcare Research and Quality (AHRQ) Clinical Classifications Software (CCS) procedure categories. Procedures designated as Other are not reported. Source: AHRQ, Center for Delivery, Organization, and Markets, Healthcare Cost and Utilization Project (HCUP), State Inpatient Databases (SID), 40 States, 2014 | ||||||
Data Source The estimates in this Statistical Brief are based upon data from the Healthcare Cost and Utilization Project (HCUP) State Inpatient Databases (SID) from 40 States in 2014: Arkansas, Arizona, California, Colorado, Connecticut, Florida, Georgia, Hawaii, Iowa, Illinois, Indiana, Kansas, Kentucky, Louisiana, Maryland, Michigan, Minnesota, Missouri, Montana, North Carolina, North Dakota, Nebraska, New Jersey, New Mexico, Nevada, New York, Oklahoma, Oregon, Pennsylvania, Rhode Island, South Carolina, South Dakota, Tennessee, Texas, Virginia, Vermont, Washington, Wisconsin, West Virginia, Wyoming. Definitions Diagnoses, procedures, ICD-9-CM, and Clinical Classifications Software (CCS) The principal diagnosis is that condition established after study to be chiefly responsible for the patient's admission to the hospital. All-listed procedures include all procedures performed during the hospital stay, whether for definitive treatment or for diagnostic or exploratory purposes. ICD-9-CM is the International Classification of Diseases, Ninth Revision, Clinical Modification, which assigns numeric codes to diagnoses and procedures. There are approximately 14,000 ICD-9-CM diagnosis codes. There are approximately 4,000 ICD-9-CM procedure codes. CCS categorizes ICD-9-CM diagnosis codes and procedure codes into a manageable number of clinically meaningful categories.7 This clinical grouper makes it easier to quickly understand patterns of diagnoses and procedure use. CCS categories identified as Other typically are not reported; these categories include miscellaneous, otherwise unclassifiable diagnoses and procedures that may be difficult to interpret as a group. Operating room procedures are defined as major diagnostic and therapeutic procedures, which include all procedures considered valid operating room procedures by the Diagnosis Related Group (DRG) grouper and that are performed for diagnostic or therapeutic reasons. Safety-net hospitals (SNH) The percentage of Medicaid and uninsured discharges was calculated out of all discharges at the hospital. Hospitals were ranked within States. Then SNHs were defined as those in which the percentage of Medicaid and uninsured discharges fell in the top quartile for that State. Although SNH definitions have varied,8 the definition used in this Statistical Brief is consistent with prior research.9,10 Types of hospitals included in HCUP State Inpatient Databases This analysis used State Inpatient Databases (SID) limited to data from community hospitals, which are defined as short-term, non-Federal, general, and other hospitals, excluding hospital units of other institutions (e.g., prisons). Community hospitals include obstetrics and gynecology, otolaryngology, orthopedic, cancer, pediatric, public, and academic medical hospitals. Excluded for this analysis are long-term care facilities such as rehabilitation, psychiatric, and alcoholism and chemical dependency hospitals. However, if a patient received long-term care, rehabilitation, or treatment for a psychiatric or chemical dependency condition in a community hospital, the discharge record for that stay was included in the analysis. Unit of analysis The unit of analysis is the hospital discharge (i.e., the hospital stay), not a person or patient. This means that a person who is admitted to the hospital multiple times in 1 year will be counted each time as a separate discharge from the hospital. Costs and charges Total hospital charges were converted to costs using HCUP Cost-to-Charge Ratios based on hospital accounting reports from the Centers for Medicare & Medicaid Services (CMS).11 Costs reflect the actual expenses incurred in the production of hospital services, such as wages, supplies, and utility costs; charges represent the amount a hospital billed for the case. For each hospital, a hospital-wide cost-to-charge ratio is used. Hospital charges reflect the amount the hospital billed for the entire hospital stay and do not include professional (physician) fees. Location of hospital and patients' residence Place of residence is based on the urban-rural classification scheme for U.S. counties developed by the National Center for Health Statistics (NCHS):
Median community-level income Median community-level income is the median household income of the patient's ZIP Code of residence. Income levels are separated into population-based quartiles with cut-offs determined using ZIP Code demographic data obtained from the Nielsen Company. The income quartile is missing for patients who are homeless or foreign. Payer Payer is the expected payer for the hospital stay. To make coding uniform across all HCUP data sources, payer combines detailed categories into general groups:
Hospital stays billed to the State Children's Health Insurance Program (SCHIP) may be classified as Medicaid, Private Insurance, or Other, depending on the structure of the State program. Because most State data do not identify patients in SCHIP specifically, it is not possible to present this information separately. For this Statistical Brief, when more than one payer is listed for a hospital discharge, the first-listed payer is used. Admission source or point of origin Admission source (now known as the patient's point of origin) indicates where the patient was located prior to admission to the hospital. Emergency admission indicates that the patient was admitted to the hospital through the emergency department. Mean number of chronic conditions per patient: All diagnoses on all records were determined to be either chronic or nonchronic. The definition of chronic conditions was based on the Chronic Condition Indicator, which can be found at http://www.hcup-us.ahrq.gov/toolssoftware/chronic/chronic.jsp. Hospital service lines Discharges were categorized into five service lines as defined in Table 5 and based on the following hierarchical order: maternal and neonatal, mental health, injury, surgical, and medical. |
| Table 5. Coding criteria for the five hospital service lines analyzed in this research |
| Maternal and neonatal service line |
| Maternal and neonatal stays are defined using the following CCS principal diagnosis categories:
Maternal 176: Contraceptive and procreative management 177: Spontaneous abortion 178: Induced abortion 179: Postabortion complications 180: Ectopic pregnancy 181: Other complications of pregnancy 182: Hemorrhage during pregnancy; abruptio placenta; placenta previa 183: Hypertension complicating pregnancy; childbirth and the puerperium 184: Early or threatened labor 185: Prolonged pregnancy 186: Diabetes or abnormal glucose tolerance complicating pregnancy; childbirth; or the puerperium 187: Malposition; malpresentation 188: Fetopelvic disproportion; obstruction 189: Previous C-section 190: Fetal distress and abnormal forces of labor 191: Polyhydramnios and other problems of amniotic cavity 192: Umbilical cord complication 193: OB-related trauma to perineum and vulva 194: Forceps delivery 195: Other complications of birth; puerperium affecting management of mother 196: Normal pregnancy and/or delivre Neonatal 218: Liveborn 219: Short gestation; low birth weight; and fetal growth retardation 220: Intrauterine hypoxia and birth asphyxia 221: Respiratory distress syndrome 222: Hemolytic jaundice and perinatal jaundice 223: Birth trauma 224: Other perinatal conditions |
| Mental health service line |
|
Mental health visits are defined using the following CCS principal diagnosis categories:
650: Adjustment disorders 651: Anxiety disorders 652: Attention-deficit, conduct, and disruptive behavior disorders 653: Delirium, dementia, and amnestic and other cognitive disorders 654: Developmental disorders 655: Disorders usually diagnoses in infancy, childhood, or adolescence 656: Impulse control disorders, NEC 657: Mood disorders 658: Personality disorders 659: Schizophrenia and other psychotic disorders 660: Alcohol-related disorders 661: Substance-related disorders 662: Suicide and intentional self-inflicted injury 663: Screening and history of mental health and substance abuse codes 670: Miscellaneous disorders |
| Injury service line |
| Injuries are identified using the principal diagnosis and a scheme recommended by Safe States Alliance, which was previously known as the State and Territorial Injury Prevention Directors Association (STIPDA). The diagnosis codes in the range 800-999 used to identify injuries are listed below.
Included
It should be noted that the above definition of injury includes five diagnosis codes that are also included under two CCS diagnosis categories used for the definition of the mental health service line:
Because of the hierarchical ordering used to assign discharges to service lines, discharges with one of these five principal diagnosis codes were assigned to the mental health service line and not the injury service line. |
| Surgical service line |
| Surgical stays are identified by a surgical Diagnosis Related Group (DRG). The DRG grouper first assigns the discharge to a major diagnostic category (MDC) based on the principal diagnosis. For each MDC, there is a list of procedure codes that qualify as operating room procedures. If the discharge involves an operating room procedure, it is assigned to one of the surgical DRGs within the MDC category; otherwise, it is assigned to a medical DRG. |
| Medical service line |
| Medical stays are identified by a medical DRG. The DRG grouper first assigns the discharge to an MDC, based on the principal diagnosis. For each MDC, there is a list of procedure codes that qualify as operating room procedures. If the discharge involves an operating room procedure, it is assigned to one of the surgical DRGs within the MDC category; otherwise, it is assigned to a medical DRG. |
About HCUP
The Healthcare Cost and Utilization Project (HCUP, pronounced "H-Cup") is a family of healthcare databases and related software tools and products developed through a Federal-State-Industry partnership and sponsored by the Agency for Healthcare Research and Quality (AHRQ). HCUP databases bring together the data collection efforts of State data organizations, hospital associations, and private data organizations (HCUP Partners) and the Federal government to create a national information resource of encounter-level healthcare data. HCUP includes the largest collection of longitudinal hospital care data in the United States, with all-payer, encounter-level information beginning in 1988. These databases enable research on a broad range of health policy issues, including cost and quality of health services, medical practice patterns, access to healthcare programs, and outcomes of treatments at the national, State, and local market levels. HCUP would not be possible without the contributions of the following data collection Partners from across the United States: Alaska State Hospital and Nursing Home Association Arizona Department of Health Services Arkansas Department of Health California Office of Statewide Health Planning and Development Colorado Hospital Association Connecticut Hospital Association District of Columbia Hospital Association Florida Agency for Health Care Administration Georgia Hospital Association Hawaii Health Information Corporation Illinois Department of Public Health Indiana Hospital Association Iowa Hospital Association Kansas Hospital Association Kentucky Cabinet for Health and Family Services Louisiana Department of Health and Hospitals Maine Health Data Organization Maryland Health Services Cost Review Commission Massachusetts Center for Health Information and Analysis Michigan Health & Hospital Association Minnesota Hospital Association Mississippi Department of Health Missouri Hospital Industry Data Institute Montana MHA - An Association of Montana Health Care Providers Nebraska Hospital Association Nevada Department of Health and Human Services New Hampshire Department of Health & Human Services New Jersey Department of Health New Mexico Department of Health New York State Department of Health North Carolina Department of Health and Human Services North Dakota (data provided by the Minnesota Hospital Association) Ohio Hospital Association Oklahoma State Department of Health Oregon Association of Hospitals and Health Systems Oregon Office of Health Analytics Pennsylvania Health Care Cost Containment Council Rhode Island Department of Health South Carolina Revenue and Fiscal Affairs Office South Dakota Association of Healthcare Organizations Tennessee Hospital Association Texas Department of State Health Services Utah Department of Health Vermont Association of Hospitals and Health Systems Virginia Health Information Washington State Department of Health West Virginia Health Care Authority Wisconsin Department of Health Services Wyoming Hospital Association About Statistical Briefs HCUP Statistical Briefs are descriptive summary reports presenting statistics on hospital inpatient and emergency department use and costs, quality of care, access to care, medical conditions, procedures, patient populations, and other topics. The reports use HCUP administrative healthcare data. About the SID The HCUP State Inpatient Databases (SID) are hospital inpatient databases from data organizations participating in HCUP. The SID contain the universe of the inpatient discharge abstracts in the participating HCUP States, translated into a uniform format to facilitate multistate comparisons and analyses. Together, the SID encompass more than 95 percent of all U.S. community hospital discharges. The SID can be used to investigate questions unique to one State, to compare data from two or more States, to conduct market-area variation analyses, and to identify State-specific trends in inpatient care utilization, access, charges, and outcomes. For More Information For other information on hospital characteristics, refer to the HCUP Statistical Briefs located at http://www.hcup-us.ahrq.gov/reports/statbriefs/sb_hospcharacteristics.jsp. For additional HCUP statistics, visit:
For more information about HCUP, visit http://www.hcup-us.ahrq.gov/. For a detailed description of HCUP and more information on the design of the State Inpatient Databases (SID), please refer to the following database documentation: Agency for Healthcare Research and Quality. Overview of the State Inpatient Databases (SID). Healthcare Cost and Utilization Project (HCUP). Rockville, MD: Agency for Healthcare Research and Quality. Updated January 2016. http://www.hcup-us.ahrq.gov/sidoverview.jsp. Accessed February 17, 2016. Suggested Citation Sutton JP (Social and Scientific Systems), Washington RE (Council for Affordable Quality Healthcare), Fingar KR (Truven Health Analytics), Elixhauser A (AHRQ). Characteristics of Safety-Net Hospitals, 2014. HCUP Statistical Brief #213. October 2016. Agency for Healthcare Research and Quality, Rockville, MD. http://www.hcup-us.ahrq.gov/reports/statbriefs/sb213-Safety-Net-Hospitals-2014.pdf. Acknowledgments The authors would like to acknowledge the contributions of Tim Kenney of Kenney IS Consulting, Inc. and Minya Sheng of Truven Health Analytics. *** AHRQ welcomes questions and comments from readers of this publication who are interested in obtaining more information about access, cost, use, financing, and quality of healthcare in the United States. We also invite you to tell us how you are using this Statistical Brief and other HCUP data and tools, and to share suggestions on how HCUP products might be enhanced to further meet your needs. Please e-mail us at hcup@ahrq.gov or send a letter to the address below:David Knutson, Director Center for Delivery, Organization, and Markets Agency for Healthcare Research and Quality 5600 Fishers Lane Rockville, MD 20857 This Statistical Brief was posted online on October 25, 2016. 1 Lewin ME, Altman S, eds. America's Health Care Safety Net: Intact but Endangered. Institute of Medicine Committee on the Changing Market, Managed Care, and the Future Viability of Safety Net Providers. Washington, DC: National Academies Press; 2000. 2 Lukas C, Holmes S, Harrison M. Can safety net hospital systems redesign themselves to achieve financial viability? Health Affairs Blog. March 16, 2015. http://healthaffairs.org/blog/2015/03/16/can-safety-net-hospital-systems-redesign-themselves-to-achieve-financial-viability/. 3 Ku L, Jones E, Shin P, Byer F, Long S. Safety net providers after healthcare reform: lessons from Massachusetts. Archives of Internal Medicine. 2011;171(15):1379-84. 4 Reiter KL, Jiang HJ, Wang J. Facing the recession: how did safety-net hospitals fare financially compared with their peers? Health Services Research. 2014;49(6):1747-66. 5 Andrews RM, Stull DE, Fraser I, Friedman B, Houchens RL. Serving the Uninsured: Safety-Net Hospitals, 2003. HCUP Fact Book No. 8, AHRQ Publication No. 07-0006. Rockville, MD: Agency for Healthcare Research and Quality; 2007. http://archive.ahrq.gov/data/hcup/factbk8/factbk8.pdf. Accessed August 29, 2016. 6 Cunningham P, Felland L. Environmental Scan to Identify the Major Research Questions and Metrics for Monitoring the Effects of the Affordable Care Act on Safety Net Hospitals. Center for Studying Health System Change, prepared for the U.S. Department of Health and Human Services. June 2013. https://aspe.hhs.gov/sites/default/files/pdf/33811/rpt_ACA_and_Safety_Net_%20EnvScan.pdf. Accessed August 29, 2016. 7 Agency for Healthcare Research and Quality. HCUP Clinical Classifications Software (CCS). Healthcare Cost and Utilization Project (HCUP). Rockville, MD: Agency for Healthcare Research and Quality. Updated June 2015. http://www.hcup-us.ahrq.gov/toolssoftware/ccs/ccs.jsp. Accessed February 17, 2016. 8 Cunningham P, Felland L. Environmental Scan to Identify the Major Research Questions and Metrics for Monitoring the Effects of the Affordable Care Act on Safety Net Hospitals. U.S. Department of Health and Human Services. June 2013. https://aspe.hhs.gov/sites/default/files/pdf/33811/rpt_ACA_and_Safety_Net_%20EnvScan.pdf. Accessed August 29, 2016. 9 Reiter KL, Jiang HJ, Wang J. Facing the recession: how did safety-net hospitals fare financially compared with their peers? Health Services Research. 2014;49(6):1747-66. 10 Andrews RM, Stull DE, Fraser I, Friedman B, Houchens RL. Serving the Uninsured: Safety-Net Hospitals, 2003. HCUP Fact Book No. 8, AHRQ Publication No. 07-0006. Rockville, MD: Agency for Healthcare Research and Quality; 2007. http://archive.ahrq.gov/data/hcup/factbk8/factbk8.pdf. Accessed August 29, 2016. 11 Agency for Healthcare Research and Quality. HCUP Cost-to-Charge Ratio (CCR) Files. Healthcare Cost and Utilization Project (HCUP). 2001-2013. Rockville, MD: Agency for Healthcare Research and Quality. Updated November 2015. http://www.hcup-us.ahrq.gov/db/state/costtocharge.jsp. Accessed February 17, 2016. |