STATISTICAL BRIEF #234 |
January 2018
Audrey J. Weiss, Ph.D., William J. Freeman, M.P.H., Kevin C. Heslin, Ph.D., and Marguerite L. Barrett, M.S. Introduction An adverse drug event (ADE) involves harms to patients caused by medication use. ADEs are the leading type of nonsurgical adverse event occurring in hospitals in the United States, with an estimated 1.6 million events in 2010.1 Some ADEs are the result of medication errors that may occur when a drug is prescribed or administered improperly, but ADEs also may occur when medications are taken correctly. Overall, patients hospitalized with an ADE have an increased length of stay, higher costs, and increased risk of in-hospital death compared with those not experiencing an ADE.2 ADEs are increasingly common,3 in part because of the substantial increase in prescription drug use. Between 2011 and 2014, 91 percent of U.S. adults aged 65 years and older reported use of a prescription drug in the past 30 days, compared with 74 percent reporting prescription drug use between 1988 and 1994.4 The percentage of Americans aged 65 years and older who reported taking five or more drugs increased from 14 to 41 percent over the same time period.5 Preventing ADEs is a top priority in healthcare in the U.S.6 This Healthcare Cost and Utilization Project (HCUP) Statistical Brief presents characteristics of hospital inpatient stays involving an ADE from 28 States in 2010 and 2014. ADE-related stays are reported by the origin of the ADE: those that originated during the inpatient stay versus those that were present on admission to the hospital. The most common causes of ADEs are presented overall and based on origin of the ADE. Differences between 2010 and 2014 are provided for the rate, average cost, and average length of stay involving ADEs by the cause and origin of the ADE. Findings Characteristics of inpatient stays involving adverse drug events, 2010 and 2014 Table 1 presents utilization and patient characteristics of inpatient stays involving an ADE based on whether the ADE originated during the stay or was present on admission to the hospital, in 2010 and 2014. |
|
| Table 1. Characteristics of inpatient stays involving an adverse drug event, 28 States, 2010 and 2014 | ||||||
| Characteristic | Originated during stay | Present on admission | ||||
|---|---|---|---|---|---|---|
| 2010 | 2014 | Percentage change | 2010 | 2014 | Percentage change | |
| Utilization characteristics | ||||||
| Number of stays | 638,937 | 465,456 | -27.2 | 997,892 | 1,110,725 | 11.3 |
| Rate per 10,000 stays | 282.0 | 214.9 | -23.8 | 440.5 | 512.7 | 16.4 |
| Cost per stay, mean $ | 22,115 | 28,089 | 27.0 | 11,577 | 13,308 | 14.9 |
| Length of stay, mean days | 8.6 | 10.2 | 19.1 | 5.6 | 5.9 | 4.2 |
| In-hospital mortality, mean % | 3.5 | 3.9 | 11.5 | 3.2 | 3.2 | 2.3 |
| Patient characteristics, rate per 10,000 stays | ||||||
| Age group, years | ||||||
| 0-17 | 64.3 | 61.7 | -4.1 | 91.9 | 126.9 | 38.2 |
| 18-44 | 174.9 | 137.2 | -21.5 | 313.5 | 339.0 | 8.1 |
| 45-64 | 348.4 | 267.8 | -23.1 | 542.6 | 645.7 | 19.0 |
| 65+ | 409.8 | 300.1 | -26.8 | 616.3 | 712.7 | 15.6 |
| Sex | ||||||
| Male | 289.1 | 223.3 | -22.8 | 446.8 | 520.8 | 16.5 |
| Female | 276.9 | 208.6 | -24.7 | 435.9 | 506.7 | 16.3 |
| Primary expected payer | ||||||
| Medicare | 405.4 | 297.3 | -26.7 | 638.9 | 735.7 | 15.2 |
| Medicaid | 178.0 | 142.4 | -20.0 | 274.8 | 346.7 | 26.1 |
| Private insurance | 220.3 | 173.5 | -21.2 | 319.7 | 372.6 | 16.5 |
| Uninsured | 195.9 | 148.5 | -24.2 | 464.1 | 429.3 | -7.5 |
| Community-level income | ||||||
| Quartile 1 (poorest) | 258.0 | 202.6 | -21.5 | 422.1 | 491.4 | 16.4 |
| Quartile 2 | 283.6 | 214.6 | -24.3 | 450.3 | 519.3 | 15.3 |
| Quartile 3 | 292.2 | 219.9 | -24.7 | 450.5 | 525.2 | 16.6 |
| Quartile 4 (wealthiest) | 304.2 | 226.2 | -25.6 | 444.5 | 524.4 | 18.0 |
| Hospital region | ||||||
| Northeast | 170.5 | 184.3 | 8.1 | 451.0 | 488.2 | 8.3 |
| Midwest | 221.1 | 197.1 | -10.9 | 508.9 | 521.9 | 2.6 |
| South | 275.8 | 265.1 | -3.9 | 503.0 | 521.8 | 3.7 |
| West | 420.8 | 195.2 | -53.6 | 310.5 | 513.4 | 65.3 |
| Notes: The table reports values rounded to the nearest tenth. Percentage change is calculated using unrounded data input values. Other payers are not reported. Source: Agency for Healthcare Research and Quality (AHRQ), Center for Delivery, Organization, and Markets, Healthcare Cost and Utilization Project (HCUP), State Inpatient Databases (SID) for 28 States, 2010 and 2014 | ||||||
Table 2 shows the percentage and rate of inpatient stays involving ADEs (of any origin) by the cause of ADE in 2010 and 2014, sorted by the most common ADEs in 2014. The percentage change in the rate of stays for the 2 years also is presented. |
| Table 2. Percentage and rate of inpatient stays involving an ADE, 28 States, 2010 and 2014 | |||||
| ADE cause | All ADE stays, %a | Rate per 10,000 stays | Percentage change in rate | ||
|---|---|---|---|---|---|
| 2010 | 2014 | 2010 | 2014 | ||
| Any ADE | 100.0 | 100.0 | 675.9 | 702.0 | 3.9 |
| Antibiotics and anti-infectives | 20.3 | 21.6 | 137.2 | 151.5 | 10.5 |
| Nonspecific ADE causes (drug type not specified) | 14.1 | 14.4 | 95.4 | 101.3 | 6.1 |
| Systemic agents | 11.5 | 13.5 | 78.0 | 94.6 | 21.3 |
| Hormones | 14.0 | 13.3 | 94.9 | 93.3 | -1.7 |
| Analgesics | 13.5 | 13.1 | 91.4 | 91.9 | 0.6 |
| Agents affecting blood constituents | 10.4 | 10.0 | 70.4 | 69.9 | -0.7 |
| Psychotropic agents | 8.6 | 8.1 | 58.4 | 57.2 | -2.1 |
| Cardiovascular drugs | 8.3 | 6.6 | 56.1 | 46.2 | -17.7 |
| Water, mineral, and uric acid metabolism drugs | 5.0 | 4.9 | 33.6 | 34.6 | 3.0 |
| Sedatives or hypnotics | 3.6 | 3.6 | 24.2 | 25.0 | 3.1 |
| Anticonvulsants and anti-Parkinson drugs | 2.8 | 2.5 | 18.9 | 17.7 | -6.4 |
| CNS depressants and anesthetics | 2.0 | 1.9 | 13.6 | 13.0 | -4.4 |
| Smooth muscle and respiratory drugs | 1.1 | 1.3 | 7.2 | 8.9 | 24.1 |
| Central nervous system drugs | 1.1 | 1.0 | 7.6 | 7.2 | -5.3 |
| Autonomic nervous system drugs | 0.7 | 0.7 | 4.9 | 4.6 | -6.1 |
| GI system drugs | 0.4 | 0.4 | 2.8 | 2.8 | -0.4 |
| Skin, eye, and mucous membrane drugs | 0.3 | 0.3 | 2.2 | 1.9 | -11.1 |
| Vaccines | 0.1 | 0.1 | 0.6 | 0.6 | -12.8 |
| Other specific drugs | 0.1 | 0.0 | 0.3 | 0.3 | -16.1 |
| Abbreviations: ADE, adverse drug event; CNS, central nervous system; GI, gastrointestinal Note: Hormones include steroids, insulin, and other hormones. Analgesics include opiates/narcotics and nonsteroidal anti-inflammatory drugs (NSAIDS). Systemic agents include antineoplastic drugs, antiallergy and antiemetic drugs, and other systemic agents. a Percentages across all ADEs sum to greater than 100 percent because some inpatient stays involved more than one ADE cause. Source: Agency for Healthcare Research and Quality (AHRQ), Center for Delivery, Organization, and Markets, Healthcare Cost and Utilization Project (HCUP), State Inpatient Databases (SID) for 28 States, 2010 and 2014 | |||||
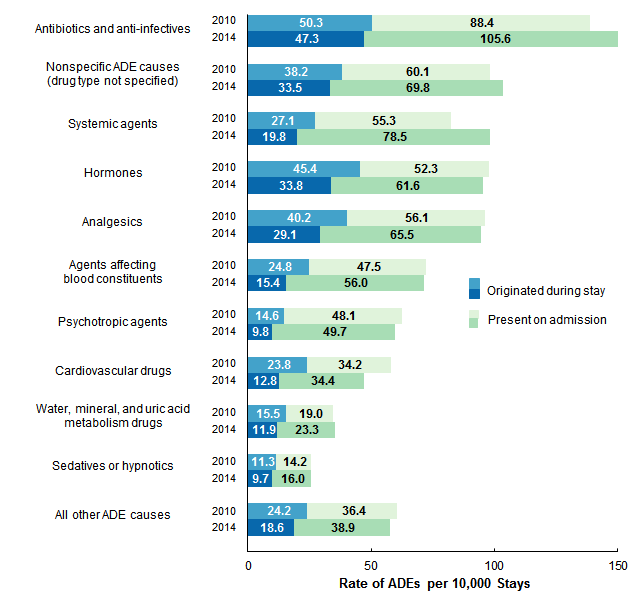
Figures 1-4 present information about the 10 most common causes of ADEs identified in Table 1. Less common ADE causes are combined into a single "all other ADE causes" category in these figures. Figure 1 presents the rate of inpatient stays for the most common causes of ADEs in 2010 and 2014. Results are presented separately for ADEs that originated during the inpatient stay and those present on admission to the hospital. |
|
Figure 1. Rate of inpatient stays involving ADEs by cause and origin of ADE, 28 States, 2010 and 2014
Abbreviation: ADE, adverse drug event Bar chart that shows the rate of inpatient stays involving ADEs per 10,000 stays in 28 States in 2010 and 2014 by cause and origin of ADE. Antibiotics and anti-infectives: 2010: 50.3 originated during stay, 88.4 present on admission; 2014: 47.3 originated during stay, 105.6 present on admission. Nonspecific ADE causes (drug type not specified): 2010: 38.2 originated during stay, 60.1 present on admission; 2014: 33.5 originated during stay, 69.8 present on admission. Systemic agents: 2010: 27.1 originated during stay, 55.3 present on admission; 2014: 19.8 originated during stay, 78.5 present on admission. Hormones: 2010: 45.4 originated during stay, 52.3 present on admission; 2014: 33.8 originated during stay, 61.6 present on admission. Analgesics: 2010: 40.2 originated during stay, 56.1 present on admission; 2014: 29.1 originated during stay, 65.5 present on admission. Agents affecting blood constituents: 2010: 24.8 originated during stay, 47.5 present on admission; 2014: 15.4 originated during stay, 56.0 present on admission. Psychotropic agents: 2010: 14.6 originated during stay, 48.1 present on admission; 2014: 9.8 originated during stay, 49.7 present on admission. Cardiovascular drugs: 2010: 23.8 originated during stay, 34.2 present on admission; 2014: 12.8 originated during stay, 34.4 present on admission. Water, mineral, and uric acid metabolism drugs: 2010: 15.5 originated during stay, 19.0 present on admission; 2014: 11.9 originated during stay, 23.3 present on admission. Sedatives or hypnotics: 2010: 11.3 originated during stay, 14.2 present on admission; 2014: 9.7 originated during stay, 16.0 present on admission. All other ADE causes: 2010: 24.2 originated during stay, 36.4 present on admission; 2014: 18.6 originated during stay, 38.9 present on admission. |
|
|
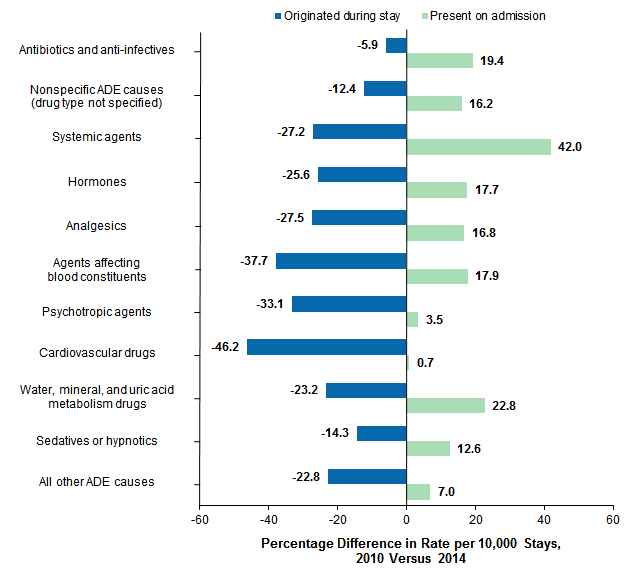
Figure 2. Percentage difference in rate of inpatient stays involving an ADE by cause and origin of ADE, 28 States, 2010 versus 2014
Abbreviation: ADE, adverse drug event Bar chart that shows the percentage difference in rate of inpatient stays involving an ADE per 10,000 stays in 2010 and 2014 by cause and origin of ADE. Antibiotics and anti-infectives: -5.9% originated during stay, 19.4% present on admission. Nonspecific ADE causes (drug type not specified): -12.4% originated during stay, 16.2% present on admission. Systemic agents: -27.2% originated during stay, 42.0% present on admission. Hormones: -25.6% originated during stay, 17.7% present on admission. Analgesics: -27.5% originated during stay, 16.8% present on admission. Agents affecting blood constituents: -37.7% originated during stay, 17.9% present on admission. Psychotropic agents: -33.1% originated during stay, 3.5% present on admission. Cardiovascular drugs: -46.2% originated during stay, 0.7% present on admission. Water, mineral, and uric acid metabolism drugs: -23.2% originated during stay, 22.8% present on admission. Sedatives or hypnotics: -14.3% originated during stay, 12.6% present on admission. All other ADE causes: -22.8% originated during stay, 7.0% present on admission. |
|
|
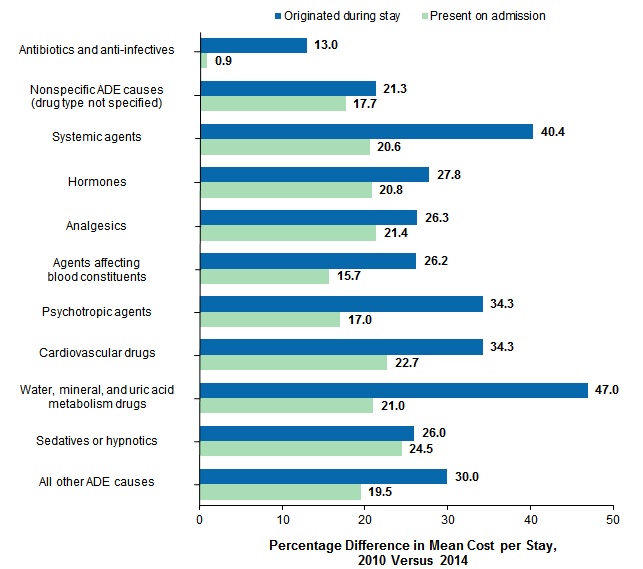
Figure 3. Percentage difference in mean inflation-adjusted costa of stays involving an ADE by cause and origin of ADE, 28 States, 2010 versus 2014
Abbreviation: ADE, adverse drug event Bar chart that shows the percentage difference in mean cost per stay involving an ADE between 2010 and 2014 by cause and origin of ADE. Antibiotics and anti-infectives: 13.0% originated during stay, 0.9% present on admission. Nonspecific ADE causes (drug type not specified): 21.3% originated during stay, 17.7% present on admission. Systemic agents: 40.4% originated during stay, 20.6% present on admission. Hormones: 27.8% originated during stay, 20.8% present on admission. Analgesics: 26.3% originated during stay, 21.4% present on admission. Agents affecting blood constituents: 26.2% originated during stay, 15.7% present on admission. Psychotropic agents: 34.3% originated during stay, 17.0% present on admission. Cardiovascular drugs: 34.3% originated during stay, 22.7% present on admission. Water, mineral, and uric acid metabolism drugs: 47.0% originated during stay, 21.0% present on admission. Sedatives or hypnotics: 26.0% originated during stay, 24.5% present on admission. All other ADE causes: 30.0% originated during stay, 19.5% present on admission. |
|
|
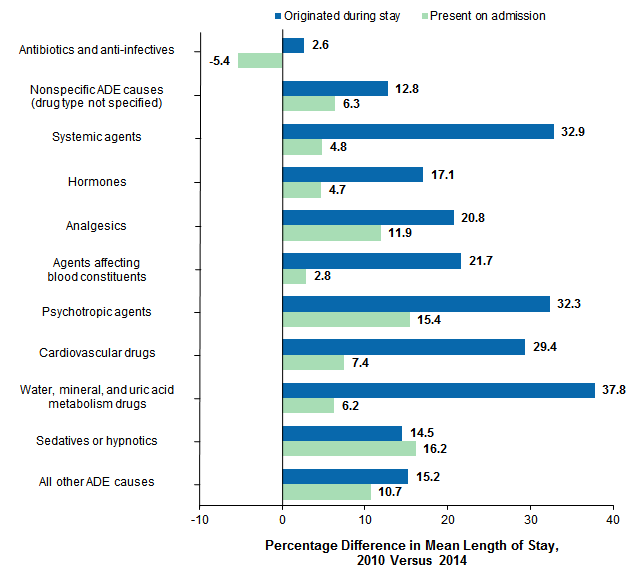
Figure 4. Percentage difference in mean length of stay involving an ADE by cause and origin of ADE, 28 States, 2010 versus 2014
Abbreviation: ADE, adverse drug event Bar chart that shows the percentage difference in mean length of stay involving an ADE between 2010 and 2014 by cause and origin of ADE. Antibiotics and anti-infectives: 2.6% originated during stay, -5.4% present on admission. Nonspecific ADE causes (drug type not specified): 12.8% originated during stay, 6.3% present on admission. Systemic agents: 32.9% originated during stay, 4.8% present on admission. Hormones: 17.1% originated during stay, 4.7% present on admission. Analgesics: 20.8% originated during stay, 11.9% present on admission. Agents affecting blood constituents: 21.7% originated during stay, 2.8% present on admission. Psychotropic agents: 32.3% originated during stay, 15.4% present on admission. Cardiovascular drugs: 29.4% originated during stay, 7.4% present on admission. Water, mineral, and uric acid metabolism drugs: 37.8% originated during stay, 6.2% present on admission. Sedatives or hypnotics: 14.5% originated during stay, 16.2% present on admission. All other ADE causes: 15.2% originated during stay, 10.7% present on admission. |
About Statistical Briefs HCUP Statistical Briefs provide basic descriptive statistics on a variety of topics using HCUP administrative healthcare data. Topics include hospital inpatient, ambulatory surgery, and emergency department use and costs, quality of care, access to care, medical conditions, procedures, and patient populations, among other topics. The reports are intended to generate hypotheses that can be further explored in other research; the reports are not designed to answer in-depth research questions using multivariate methods. Data Source The estimates in this Statistical Brief are based upon data from the Healthcare Cost and Utilization Project (HCUP) 2010 and 2014 State Inpatient Databases (SID) from 28 States that include data elements designating whether adverse drug event (ADE) diagnoses were present on admission or originated during the stay. The States are Arizona, Arkansas, California, Florida, Hawaii, Illinois, Indiana, Iowa, Kansas, Kentucky, Maine, Maryland, Massachusetts, Michigan, Minnesota, Montana, Nebraska, Nevada, New Jersey, New Mexico, New York, Oklahoma, Oregon, Rhode Island, South Carolina, Tennessee, Virginia, and Washington. All numbers noted in the text and included in the tables are actual values, not estimates, because the data include a census of discharges rather than a sample of discharges. In other words, we count the actual number of hospital stays with an ADE in the 28 States. Because we analyze numbers for the actual population rather than a sample, there is no need to estimate how well the sample represents an underlying population. As a result, there is no sampling error associated with the calculated values presented, and significance testing is not necessary. Differences over time are reported by comparing values in 2010 with values in 2014. Definitions Case definition The specific causes of adverse drug events presented in this Statistical Brief were based on a review of International Classification of Diseases, Ninth Revision, Clinical Modification (ICD-9-CM) diagnosis codes and external cause of injury codes (E codes). The specific ICD-9-CM diagnosis codes used for each ADE cause are provided in the separate appendix associated with this Statistical Brief on the HCUP-US website at www.hcup-us.ahrq.gov/reports/statbriefs/sb234-appendix.pdf. This code list is adapted from a list that was previously used to report on ADE causes in 2011 in a prior Statistical Brief.7 Because the current Statistical Brief covers two different years (2010 and 2014), there were a few clinical code changes that required an adaptation of the earlier code list. These changes are as follows:
|
| Table 3. Specific ADE causes included in ADE cause categories | |
| ADE cause category | Specific ADE causes included |
|---|---|
| Antibiotics and anti-infectives | Antibiotics, clostridium difficile infection, other anti-infectives |
| Nonspecific ADE causes (drug type not specified) | N/A |
| Systemic agents | Antineoplastic drugs, antiallergy and antiemetic drugs, other systemic agents |
| Hormones | Steroids, insulin and hypoglycemic, and other hormones |
| Analgesics | Opiates/narcotics and NSAIDS |
| Agents affecting blood constituents | Anticoagulants and other agents that affect blood constituents |
| Psychotropic agents | Antidepressants, antipsychotics, benzodiazepine, and other psychotropic drugs |
| Cardiovascular drugs | Digoxin, antiadrenergics, and other cardiovascular drugs |
| Water, mineral, and uric acid metabolism drugs | Saluretics, other diuretics, and other drugs affecting mineral and uric acid metabolism |
| Sedatives or hypnotics | N/A |
| Anticonvulsants and anti-Parkinson drugs | Hydantoin, other anticonvulsants, and anti-Parkinson drugs |
| CNS depressants and anesthetics | N/A |
| Smooth muscle and respiratory drugs | N/A |
| Central nervous system drugs | N/A |
| Autonomic nervous system drugs | N/A |
| GI system drugs | N/A |
| Skin, eye, and mucous membrane drugs | N/A |
| Vaccines | N/A |
| Other specific drugs | N/A |
| Abbreviations: ADE, adverse drug event; CNS, central nervous system; GI, gastrointestinal; N/A, not applicable; NSAIDS, nonsteroidal anti-inflammatory drug Note: Refer to the separate appendix available on the HCUP-US website for the detailed list of all ICD-9-CM diagnosis codes included for each ADE cause. | |
Present on admission was determined for each discharge diagnosis based on two types of present-on-admission indicator flags in the SID: (1) a diagnosis-specific flag that indicates whether each diagnosis was present on admission and (2) an E code flag that indicates whether each external cause of injury was present on admission.
After discharges that did not meet standard present-on-admission edit checking were excluded,8 the final analysis file for this Statistical Brief included 44,316,684 discharges (95.8 percent of all discharges across the 28 States in 2010 and 2014). Types of hospitals included in HCUP State Inpatient Databases This analysis used State Inpatient Databases (SID) limited to data from community hospitals, which are defined as short-term, non-Federal, general, and other hospitals, excluding hospital units of other institutions (e.g., prisons). Community hospitals include obstetrics and gynecology, otolaryngology, orthopedic, cancer, pediatric, public, and academic medical hospitals. Excluded for this analysis are long-term care facilities such as rehabilitation, psychiatric, and alcoholism and chemical dependency hospitals. However, if a patient received long-term care, rehabilitation, or treatment for a psychiatric or chemical dependency condition in a community hospital, the discharge record for that stay was included in the analysis. Unit of analysis The unit of analysis is the hospital discharge (i.e., the hospital stay), not a person or patient. This means that a person who is admitted to the hospital multiple times in 1 year will be counted each time as a separate discharge from the hospital. Payer Payer is the expected payer for the hospital stay. To make coding uniform across all HCUP data sources, payer combines detailed categories into general groups:
For this Statistical Brief, when more than one payer is listed for a hospital discharge, the first-listed payer is used. Other payers were not reported. Community-level income Community-level income is based on the median household income of the patient's ZIP Code of residence. Quartiles are defined so that each State's population is evenly distributed. Cut-offs for the quartiles are determined annually using ZIP Code demographic data obtained from Claritas, a vendor that adds value to data from the U.S. Census Bureau.9 The value ranges for the income quartiles vary by year. The income quartile is missing for patients who are homeless or foreign. Region Region is one of the four regions defined by the U.S. Census Bureau. The following States used for this analysis fell into these regions:
About HCUP The Healthcare Cost and Utilization Project (HCUP, pronounced "H-Cup") is a family of healthcare databases and related software tools and products developed through a Federal-State-Industry partnership and sponsored by the Agency for Healthcare Research and Quality (AHRQ). HCUP databases bring together the data collection efforts of State data organizations, hospital associations, and private data organizations (HCUP Partners) and the Federal government to create a national information resource of encounter-level healthcare data. HCUP includes the largest collection of longitudinal hospital care data in the United States, with all-payer, encounter-level information beginning in 1988. These databases enable research on a broad range of health policy issues, including cost and quality of health services, medical practice patterns, access to healthcare programs, and outcomes of treatments at the national, State, and local market levels. HCUP would not be possible without the contributions of the following data collection Partners from across the United States: Alaska Department of Health and Social Services Alaska State Hospital and Nursing Home Association Arizona Department of Health Services Arkansas Department of Health California Office of Statewide Health Planning and Development Colorado Hospital Association Connecticut Hospital Association District of Columbia Hospital Association Florida Agency for Health Care Administration Georgia Hospital Association Hawaii Health Information Corporation Illinois Department of Public Health Indiana Hospital Association Iowa Hospital Association Kansas Hospital Association Kentucky Cabinet for Health and Family Services Louisiana Department of Health Maine Health Data Organization Maryland Health Services Cost Review Commission Massachusetts Center for Health Information and Analysis Michigan Health & Hospital Association Minnesota Hospital Association Mississippi State Department of Health Missouri Hospital Industry Data Institute Montana Hospital Association Nebraska Hospital Association Nevada Department of Health and Human Services New Hampshire Department of Health & Human Services New Jersey Department of Health New Mexico Department of Health New York State Department of Health North Carolina Department of Health and Human Services North Dakota (data provided by the Minnesota Hospital Association) Ohio Hospital Association Oklahoma State Department of Health Oregon Association of Hospitals and Health Systems Oregon Office of Health Analytics Pennsylvania Health Care Cost Containment Council Rhode Island Department of Health South Carolina Revenue and Fiscal Affairs Office South Dakota Association of Healthcare Organizations Tennessee Hospital Association Texas Department of State Health Services Utah Department of Health Vermont Association of Hospitals and Health Systems Virginia Health Information Washington State Department of Health West Virginia Department of Health and Human Resources, West Virginia Health Care Authority Wisconsin Department of Health Services Wyoming Hospital Association About the SID The HCUP State Inpatient Databases (SID) are hospital inpatient databases from data organizations participating in HCUP. The SID contain the universe of the inpatient discharge abstracts in the participating HCUP States, translated into a uniform format to facilitate multistate comparisons and analyses. Together, the SID encompass more than 95 percent of all U.S. community hospital discharges. The SID can be used to investigate questions unique to one State, to compare data from two or more States, to conduct market-area variation analyses, and to identify State-specific trends in inpatient care utilization, access, charges, and outcomes. For More Information For other information on adverse events and patient safety in U.S. hospitals, including adverse drug events, refer to the HCUP Statistical Briefs located at www.hcup-us.ahrq.gov/reports/statbriefs/sb_adverse.jsp. For additional HCUP statistics, visit:
For a detailed description of HCUP and more information on the design of the State Inpatient Databases (SID), please refer to the following database documentation: Agency for Healthcare Research and Quality. Overview of the State Inpatient Databases (SID). Healthcare Cost and Utilization Project (HCUP). Rockville, MD: Agency for Healthcare Research and Quality. Updated June 2016. www.hcup-us.ahrq.gov/sidoverview.jsp. Accessed January 31, 2017. Suggested Citation Weiss AJ (IBM Watson Health), Freeman WJ (AHRQ), Heslin KC (AHRQ), Barrett ML (M.L. Barrett, Inc.). Adverse Drug Events in U.S. Hospitals, 2010 Versus 2014. HCUP Statistical Brief #234. January 2018. Agency for Healthcare Research and Quality, Rockville, MD. www.hcup-us.ahrq.gov/reports/statbriefs/sb234-Adverse-Drug-Events.pdf. Acknowledgments The authors would like to acknowledge the contributions of Minya Sheng of IBM Watson Health. *** AHRQ welcomes questions and comments from readers of this publication who are interested in obtaining more information about access, cost, use, financing, and quality of healthcare in the United States. We also invite you to tell us how you are using this Statistical Brief and other HCUP data and tools, and to share suggestions on how HCUP products might be enhanced to further meet your needs. Please e-mail us at hcup@ahrq.gov or send a letter to the address below:Sharon B. Arnold, Ph.D., Acting Director Center for Delivery, Organization, and Markets Agency for Healthcare Research and Quality 5600 Fishers Lane Rockville, MD 20857 This Statistical Brief was posted online on January 9, 2018 1 Agency for Healthcare Research and Quality. Saving Lives and Saving Money: Hospital-Acquired Conditions Update. Interim Data From National Efforts to Make Care Safer, 2010-2014. Agency for Healthcare Research and Quality. www.ahrq.gov/sites/default/files/publications/files/interimhacrate2014_2.pdf. Accessed January 4, 2018 2 Poudel DR, Acharya P, Ghimire S, Shital R, Bharati R. Burden of hospitalizations related to adverse drug events in the USA: a retrospective analysis from large inpatient database. Pharmacoepidemiology and Drug Safety. 2017;26(6):635-41. 3 Ibid. 4 National Center for Health Statistics. Health, United States, 2016: With Chartbook on Long-Term Trends in Health. Hyattsville, MD: National Center for Health Statistics; 2017. 5 Ibid. 6 U.S. Department of Health and Human Services. National Action Plan for Adverse Drug Event Prevention. U.S. Department of Health and Human Services. 2014. health.gov/hcq/pdfs/ade-action-plan-508c.pdf. Accessed September 29, 2017. 7 Weiss AJ, Elixhauser A, Bae J, Encinosa W. Origin of Adverse Drug Events in U.S. Hospitals, 2011. HCUP Statistical Brief #158. July 2013. Agency for Healthcare Research and Quality, Rockville, MD. www.hcup-us.ahrq.gov/reports/statbriefs/sb158.pdf. Accessed November 30, 2017. 8 Barrett ML, Owens PL, Bolhack J, Sheng M. Examination of the Coding of Present-on-Admission Indicators in Healthcare Cost and Utilization Project (HCUP) State Inpatient Databases (SID). 2015. HCUP Methods Series Report #2015-06. September 1, 2015. U.S. Agency for Healthcare Research and Quality. www.hcup-us.ahrq.gov/reports/methods/2015-06.pdf. Accessed September 27, 2017. 9 Claritas. Claritas Demographic Profile. www.claritas.com. |