STATISTICAL BRIEF #238 |
March 2018
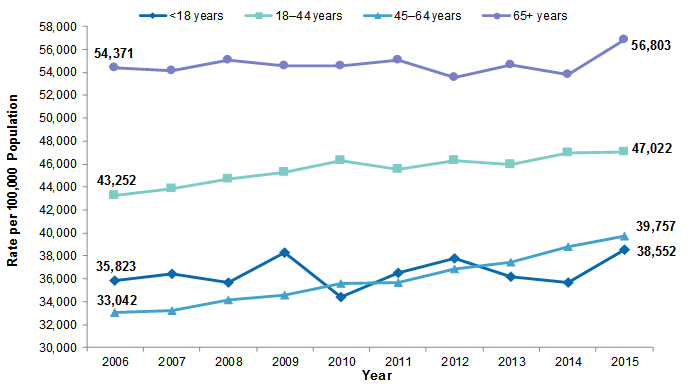
Ruirui Sun, Ph.D., Zeynal Karaca, Ph.D., and Herbert S. Wong, Ph.D. Introduction The emergency department (ED) provides services to all who seek ED care, regardless of ability to pay,1 and the ED has become an important source of admissions for hospitals.2 Since the 1990s, the number of ED visits has been steadily increasing,3,4 and has varied across age groups and payers. Prior studies have shown that patients aged 18-44 years and 45-64 years accounted for the greatest increase in ED visits from 1997 to 2007, and the population ED visit rate increased significantly among adults with Medicaid.5 In 2011, one in five people reported visiting the ED at least once during the past year, and those with Medicaid coverage were more likely to visit the ED than those without insurance or those with private insurance.6 More recent studies have shown that policies that aim to reduce the number of patients without insurance can shift payer mix in the ED.7,8 This Healthcare Cost and Utilization Project (HCUP) Statistical Brief presents trends in hospital-affiliated ED utilization by examining the population rate of ED visits and the number of ED visits across primary payers by age groups. The Nationwide Emergency Department Sample (NEDS) from 2006 to 2015 was used to generate national estimates of ED visits and patient characteristics. Trends of hospital-affiliated ED visits are presented by age group, first overall and by expected primary payer. Findings National rates of ED visits overall and those resulting in hospital admission, 2006-2015 Figure 1 presents the national rate of hospital-affiliated ED visits, per 100,000 population by age group, from 2006 to 2015. Information presented here includes all types of ED visits. |
|
|
Figure 1. Rate of ED visits, per 100,000 population by age group, 2006-2015
Abbreviation: ED, emergency department Line graph that shows the rate of emergency department visits per 100,000 population from 2006 to 2015 by age. 65+ years: fluctuated between 54,371 and 55,092 between 2006 and 2011; dropped to 53,537 in 2012; rose to 54,619 in 2013; dropped to 53,833 in 2014; rose to 56,803 in 2015. 18-44 years: increased steadily from 43,252 in 2006 to 46,301 in 2010; fluctuated between 45,518 in 2011 and 47,022 in 2015. <18 years: 2006: 35,823; 2007: 36,413; 2008: 35,656; 2009: 38,325; 2010: 34,419; 2011: 36,549; 2012: 37,822; 2013: 36,143; 2014: 35,704; 2015: 38,552. 45-64 years: rose steadily from 33,042 in 2006 to 39,757 in 2015. |
|
|
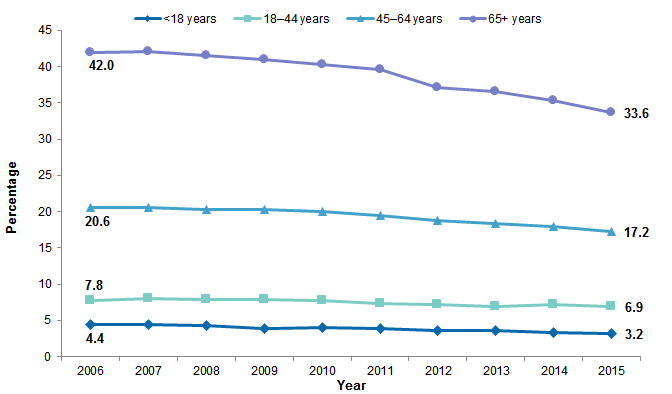
Figure 2. Percentage of ED visits that resulted in hospital admission by age group, 2006-2015
Abbreviation: ED, emergency department Line graph that shows the percentage of emergency department visits from 2006 to 2015 that resulted in hospital admission by age. 65+ years: increased from 42.0 in 2006 to 42.1 in 2007; decreased steadily to 33.6 in 2015. 45-64 years: 20.6 in 2006 and 2007; then decreased steadily to 17.2 in 2015. 18-44 years: rose from 7.8 in 2006 to 8.0 in 2007; decreased steadily to 7.0 in 2013; rose to 7.3 in 2014; dropped to 6.9 in 2015. <18 years: 2006: 4.4; 2007: 4.5; 2008: 4.4; 2009: 3.8; 2010: 4.0; decreased steadily to 3.2 in 2015. |
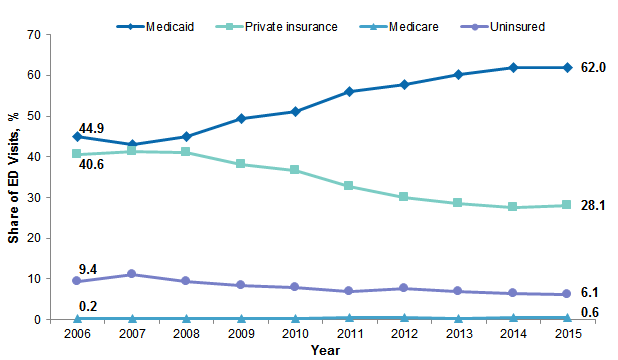
In this section, changes in ED visits within each age group are examined. Specifically, Figures 3 to 6 present trends in primary payer for each age group from 2006 to 2015. |
|
Figure 3. Trends in primary payer among all ED visits for patients under age 18 years, 2006-2015
Abbreviation: ED, emergency department Line graph that shows the share of emergency department visits by patients <18 years between 2006 and 2015 by primary payer. Medicaid: dropped from 44.9 in 2006 to 43.1 in 2007; then increased steadily to 62.0 in 2014 and 2015. Private insurance: increased from 40.6 in 2006 to 41.2 in 2007; decreased steadily to 27.6 in 2014; increased to 28.1 in 2015. Uninsured: increased from 9.4 in 2006 to 11.2 in 2007; decreased steadily to 6.9 in 2011; increased to 7.8 in 2012; decreased steadily to 6.1 in 2016. Medicare: 2006: 0.2; 2007: 0.4; 2008: 0.3; 2009: 0.2; 2010: 0.3; 2011: 0.5; 2012: 0.5; 2013: 0.3; 2014: 0.4; 2015: 0.6. |
|
|
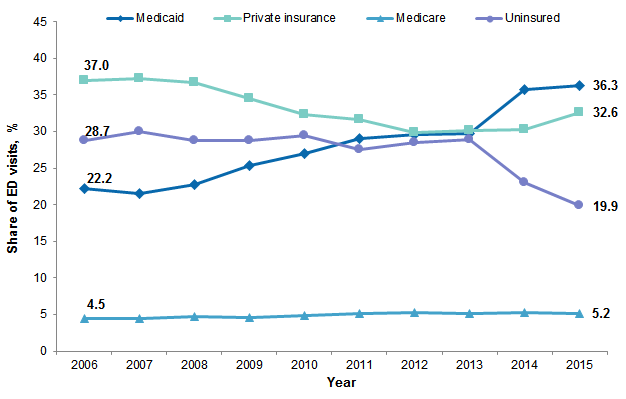
Figure 4. Trends in primary payer among all ED visits for patients aged 18-44 years, 2006-2015
Abbreviation: ED, emergency department Line graph that shows the share of emergency department visits by patients 18-44 years between 2006 and 2015 by primary payer. Private insurance: rose from 37.0 in 2006 to 37.2 in 2007; decreased steadily to 29.9 in 2012; increased steadily to 32.6 in 2015. Uninsured: 2006: 28.7; 2007: 30.0; 2008: 28.8; 2009: 28.7; 2010: 29.4; 2011: 27.6; 2012: 28.5; 2013: 28.9; 2014: 23.0; 2015: 19.9. Medicaid: dropped from 22.2 in 2006 to 21.6 in 2007; increased steadily to 36.3 in 2015. Medicare: increased from 4.5 in 2006 and 2007 to 4.7 in 2008; dropped to 4.6 in 2009; increased to 4.8 in 2010; fluctuated between 5.2 and 5.3 from 2011 to 2015. |
|
|
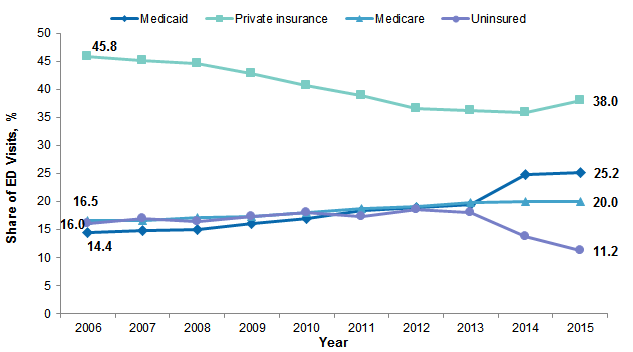
Figure 5. Trends in primary payer among all ED visits for patients aged 45-64 years, 2006-2015
Abbreviation: ED, emergency department Line graph that shows the share of emergency department visits by patients 45-64 years between 2006 and 2015 by primary payer. Private insurance: decreased steadily from 45.8 in 2006 to 35.8 in 2014; increased to 38.0 in 2015. Medicare: increased steadily from 16.5 in 2006 to 20.0 in 2014 and 2015. Uninsured: 2006: 16.0; 2007: 17.0; 2008: 16.5; 2009: 17.3; 2010: 18.0; 2011: 17.3; 2012: 18.5; 2013: 18.1; 2014: 13.7; 2015: 11.2. Medicaid: increased steadily from 14.4 in 2006 to 25.2 in 2015. |
|
|
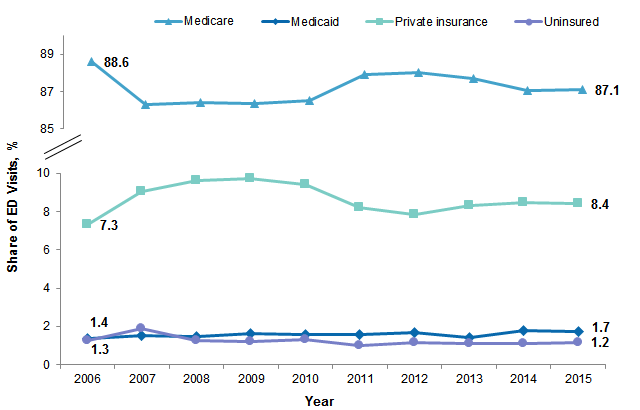
Figure 6. Trends in primary payer among all ED visits for patients aged 65 years and above, 2006-2015
Abbreviation: ED, emergency department Line graph that shows the share of emergency department visits by patients 65+ years between 2006 and 2015 by primary payer. Medicare: dropped from 88.6 in 2006 to 86.3 in 2007; increased steadily to 88.0 in 2012; decreased steadily to 87.1 in 2015. Private insurance: increased steadily from 7.3 in 2006 to 9.7 in 2009; decreased steadily to 7.9 in 2012; increased steadily to 8.5 in 2014; decreased to 8.4 in 2015. Medicaid: increased steadily from 1.4 in 2006 to 1.7 in 2012; decreased to 1.4 in 2013; increased to 1.8 in 2014; decreased to 1.7 in 2015. Uninsured: increased from 1.3 in 2006 to 1.9 in 2007; decreased to 1.2 in 2008 and 2009; increased to 1.3 in 2010; decreased to 1.0 in 2011; dropped to 1.1 in 2012, 2013, and 2014; increased to 1.2 in 2015. |
About Statistical Briefs HCUP Statistical Briefs provide basic descriptive statistics on a variety of topics using HCUP administrative healthcare data. Topics include hospital inpatient, ambulatory surgery, and emergency department use and costs, quality of care, access to care, medical conditions, procedures, and patient populations, among other topics. The reports are intended to generate hypotheses that can be further explored in other research; the reports are not designed to answer in-depth research questions using multivariate methods. Data Source The estimates in this Statistical Brief are based upon data from the Healthcare Cost and Utilization Project (HCUP) 2006-2015 Nationwide Emergency Department Sample (NEDS). Supplemental sources included population denominator data for use with HCUP databases, derived from information available from the Bureau of the Census.9 Definitions Types of hospitals included in the HCUP Nationwide Emergency Department Sample The Nationwide Emergency Department Sample (NEDS) is based on data from community hospitals, which are defined as short-term, non-Federal, general, and other hospitals, excluding hospital units of other institutions (e.g., prisons). The NEDS includes specialty, pediatric, public, and academic medical hospitals. Excluded are long-term care facilities such as rehabilitation, psychiatric, and alcoholism and chemical dependency hospitals. Hospitals included in the NEDS have hospital-owned emergency departments and no more than 90 percent of their ED visits resulting in admission. Unit of analysis The unit of analysis is the emergency department (ED) encounter, not a person or patient. This means that a person who is seen in the ED multiple times in 1 year will be counted each time as a separate encounter in the ED. Average annual percentage change Average annual percentage change was calculated using the following formula:
Average annual percentage change equals open parenthesis, open parenthesis, end value divided by beginning value, close parenthesis, to the power of 1 divided by change in years, minus 1, close parenthesis, multiplied by 100.
Payer Payer is the expected payer for the hospital stay. To make coding uniform across all HCUP data sources, payer combines detailed categories into general groups:
For this Statistical Brief, when more than one payer is listed for an ED visit, the first-listed payer is used. About HCUP The Healthcare Cost and Utilization Project (HCUP, pronounced "H-Cup") is a family of healthcare databases and related software tools and products developed through a Federal-State-Industry partnership and sponsored by the Agency for Healthcare Research and Quality (AHRQ). HCUP databases bring together the data collection efforts of State data organizations, hospital associations, and private data organizations (HCUP Partners) and the Federal government to create a national information resource of encounter-level healthcare data. HCUP includes the largest collection of longitudinal hospital care data in the United States, with all-payer, encounter-level information beginning in 1988. These databases enable research on a broad range of health policy issues, including cost and quality of health services, medical practice patterns, access to healthcare programs, and outcomes of treatments at the national, State, and local market levels. HCUP would not be possible without the contributions of the following data collection Partners from across the United States: Alaska Department of Health and Social Services Alaska State Hospital and Nursing Home Association Arizona Department of Health Services Arkansas Department of Health California Office of Statewide Health Planning and Development Colorado Hospital Association Connecticut Hospital Association District of Columbia Hospital Association Florida Agency for Health Care Administration Georgia Hospital Association Hawaii Health Information Corporation Illinois Department of Public Health Indiana Hospital Association Iowa Hospital Association Kansas Hospital Association Kentucky Cabinet for Health and Family Services Louisiana Department of Health Maine Health Data Organization Maryland Health Services Cost Review Commission Massachusetts Center for Health Information and Analysis Michigan Health & Hospital Association Minnesota Hospital Association Mississippi State Department of Health Missouri Hospital Industry Data Institute Montana Hospital Association Nebraska Hospital Association Nevada Department of Health and Human Services New Hampshire Department of Health & Human Services New Jersey Department of Health New Mexico Department of Health New York State Department of Health North Carolina Department of Health and Human Services North Dakota (data provided by the Minnesota Hospital Association) Ohio Hospital Association Oklahoma State Department of Health Oregon Association of Hospitals and Health Systems Oregon Office of Health Analytics Pennsylvania Health Care Cost Containment Council Rhode Island Department of Health South Carolina Revenue and Fiscal Affairs Office South Dakota Association of Healthcare Organizations Tennessee Hospital Association Texas Department of State Health Services Utah Department of Health Vermont Association of Hospitals and Health Systems Virginia Health Information Washington State Department of Health West Virginia Department of Health and Human Resources, West Virginia Health Care Authority Wisconsin Department of Health Services Wyoming Hospital Association About the NEDS The HCUP Nationwide Emergency Department Sample (NEDS) is a unique and powerful database that yields national estimates of emergency department (ED) visits. The NEDS was constructed using records from both the HCUP State Emergency Department Databases (SEDD) and the State Inpatient Databases (SID). The SEDD capture information on ED visits that do not result in an admission (i.e., patients who were treated in the ED and then released from the ED, or patients who were transferred to another hospital); the SID contain information on patients initially seen in the ED and then admitted to the same hospital. The NEDS was created to enable analyses of ED utilization patterns and support public health professionals, administrators, policymakers, and clinicians in their decision making regarding this critical source of care. The NEDS is produced annually beginning in 2006. Over time, the sampling frame for the NEDS has changed; thus, the number of States contributing to the NEDS varies from year to year. The NEDS is intended for national estimates only; no State-level estimates can be produced. For More Information For other information on ED visits in the United States, refer to the HCUP Statistical Briefs located at www.hcup-us.ahrq.gov/reports/statbriefs/sb_ed.jsp. For additional HCUP statistics, visit:
For a detailed description of HCUP and more information on the design of the Nationwide Emergency Department Sample (NEDS), please refer to the following database documentation: Agency for Healthcare Research and Quality. Overview of the Nationwide Emergency Department Sample (NEDS). Healthcare Cost and Utilization Project (HCUP). Rockville, MD: Agency for Healthcare Research and Quality. Updated December 2016. www.hcup-us.ahrq.gov/nedsdoverview.jsp. Accessed January 31, 2017. Suggested Citation Sun R (AHRQ), Karaca Z (AHRQ), Wong HS (AHRQ). Trends in Hospital Emergency Department Visits by Age and Payer, 2006–2015. HCUP Statistical Brief #238. March 2018. Agency for Healthcare Research and Quality, Rockville, MD. www.hcup-us.ahrq.gov/reports/statbriefs/sb238-Emergency-Department-Age-Payer-2006-2015.pdf. *** AHRQ welcomes questions and comments from readers of this publication who are interested in obtaining more information about access, cost, use, financing, and quality of healthcare in the United States. We also invite you to tell us how you are using this Statistical Brief and other HCUP data and tools, and to share suggestions on how HCUP products might be enhanced to further meet your needs. Please e-mail us at hcup@ahrq.gov or send a letter to the address below:Sharon B. Arnold, Ph.D., Acting Director Center for Delivery, Organization, and Markets Agency for Healthcare Research and Quality 5600 Fishers Lane Rockville, MD 20857 This Statistical Brief was posted online on March 27, 2018. 1 Fields WW, Asplin BR, Larkin GL, Marco CA, Johnson LA, Yeh C, et al. The Emergency Medical Treatment and Labor Act as a federal healthcare safety net program. Academic Emergency Medicine. 2001;8(11):1064-9. 2 Morganti KG, Bauhoff S, Blanchard JC, Abir M, Iyer N, Smith AC, et al. The evolving role of emergency departments in the United States. Rand Health Quarterly. 2013;3(2):3. 3 Burt CW, McCaig LF. Trends in hospital emergency department utilization: United States, 1992-99. Vital and Health Statistics. 2001;13(150):1-34 4 Bernstein AB, Hing E, Moss AJ, Allen KF, Siller AB, Tiggle RB. Health care in America: Trends in utilization. Hyattsville, MD: National Center for Health Statistics. 2003. www.cdc.gov/nchs/data/misc/healthcare.pdf. Accessed January 30, 2018. 5 Tang N, Stein J, Hsia RY, Maselli JH, Gonzales R. Trends and characteristics of US emergency department visits, 1997-2007. JAMA. 2010;304(6):664-70. 6 Centers for Disease Control and Prevention, National Center for Health Statistics. Health, United States, 2012: With Special Feature on Emergency Care. Hyattsville, MD: National Center for Health Statistics; 2013. 7 Pines JM, Zocchi M, Moghtaderi A, Black B, Farmer S, Hufstetler G, et al. Medicaid Expansion in 2014 did not increase emergency department use but did change insurance payer mix. Health Affairs. 2016;35(8):1480-6. 8 Sabik LM, Cunningham PJ, Tehrani AB. Changes in emergency department utilization after early Medicaid expansion in California. Medical Care. 2017;55(6):576-82. 9 Barrett M, Coffey R, Levit K. Population Denominator Data for Use With the HCUP Databases (Updated With 2016 Population Data) HCUP Methods Series Report # 2017-04 ONLINE. October 17, 2017. U.S. Agency for Healthcare Research and Quality. www.hcup-us.ahrq.gov/reports/methods/2017-04.pdf. Accessed November 22, 2017. |