STATISTICAL BRIEF #242 |
August 2018
Kimberly W. McDermott, Ph.D., Carol Stocks, Ph.D., R.N., and William J. Freeman, M.P.H. Introduction Pediatric emergency department (ED) visits constitute roughly 20 percent of all ED visits.1 In 2015 alone, 17 percent of all children in the United States sought emergency care at least once.2 Although reasons for pediatric ED visits vary by age, conditions such as wounds, sprains and strains, and viral and respiratory infections are common, as well as symptoms such as fever, cough, nausea, vomiting, and abdominal pain.3 Of note, some of the most common pediatric diseases and symptoms, including asthma and abdominal pain, have been shown to exhibit seasonal variation.4,5 Although some ill and injured children are treated at children's hospitals or large pediatric units of medical centers, the vast majority are brought to community hospital EDs.6 In recent years, national experts have raised concerns about pediatric emergency preparedness in community hospitals and have released guidelines to promote greater equity in pediatric emergency care.7,8 Updated information on patient characteristics and common conditions associated with pediatric ED visits may provide additional insight into the unique needs of the pediatric population and assist community EDs in improving their pediatric care resources. This Healthcare Cost and Utilization Project (HCUP) Statistical Brief presents data on pediatric ED visits (excluding births), with children defined as patients aged 18 years or younger.9 The time frame of focus is fiscal year (FY) 2015 (from quarter 4 [Q4] of 2014 through Q3 2015), with comparison data provided for FY 2007 through FY 2014.10 In this Statistical Brief, FY 2015 will hereinafter be referred to as 2015, FY 2014 will be referred to as 2014, and so forth. The number and rate of pediatric ED visits are compared with adult ED visits in 2015 for three visit types: all ED visits, treat-and-release ED visits, and ED visits resulting in admission to the same hospital. Patient characteristics are presented for pediatric ED visits across these same categories. Trends in pediatric ED visits from 2007 through 2015 are provided by expected primary payer. The most common reasons for pediatric ED visits by body system in 2015 are presented, along with the most common respiratory conditions by age group. Finally, seasonal variation in pediatric ED visits involving respiratory conditions and injuries for 2011 through 2015 are provided. Differences greater than 10 percent between estimates are noted in the text. Findings Emergency department visits among children compared with adults, 2015 Table 1 compares pediatric ED visits with adult ED visits in 2015. Visit totals and population rates are presented for all ED visits, treat-and-release ED visits, and ED visits resulting in hospital admission, among patients aged 18 years or younger, patients aged 19–64 years, and patients aged 65 years and older. Corresponding U.S. population totals are presented for comparison. |
|
| Table 1. Pediatric ED visits compared with adult ED visits, FY 2015 | |||
| Variable | 0–18 years | 19–64 years | 65+ years |
|---|---|---|---|
| U.S. populationa | 78,473,200 | 171,311,200 | 46,447,200 |
| All ED visits | |||
| Number of visits | 30,047,000 | 86,102,900 | 26,775,600 |
| Rate per 1,000 population | 382.9 | 502.6 | 576.5 |
| Treat-and-release ED visitsb | |||
| Number of visits | 29,066,900 | 76,635,500 | 17,653,500 |
| Rate per 1,000 population | 370.4 | 447.3 | 380.1 |
| ED visits, % | 96.7 | 89.0 | 65.9 |
| ED visits resulting in hospital admission | |||
| Number of visits | 980,100 | 9,467,500 | 9,122,200 |
| Rate per 1,000 population | 12.5 | 55.3 | 196.4 |
| ED visits, % | 3.3 | 11.0 | 34.1 |
| Abbreviation: ED, emergency department; FY, fiscal year Notes: Pediatric ED visits exclude births. Totals are rounded to the nearest hundred. a To adjust for use of fiscal year data, U.S. population estimates were calculated as the sum of one-quarter of the 2014 population and three-quarters of the 2015 population. b Among treat-and-release pediatric ED visits, the majority resulted in routine discharge (88.3%). Others resulted in transfer to a short-term hospital (1.4%), transfer to another type of facility (0.7%), discharge against medical advice (0.7%), or discharge to an unknown destination (8.8%). Death in the ED and discharge to home healthcare each accounted for less than 0.1% of discharges. Source: Agency for Healthcare Research and Quality (AHRQ), Center for Delivery, Organization, and Markets, Healthcare Cost and Utilization Project (HCUP), Nationwide Emergency Department Sample (NEDS), Q4 2014–Q3 2015 | |||
Table 2 presents patient characteristics for all pediatric ED visits, treat-and-release pediatric ED visits, and pediatric ED visits resulting in hospital admission in 2015. Corresponding U.S. population totals are presented as a means of comparison. |
| Table 2. Patient characteristics for ED visits in the pediatric population, FY 2015 | ||||
| Variable | All pediatric ED visits | Treat-and-release pediatric ED visits | Pediatric ED visits resulting in admission | U.S. population, 0–18 yearsa |
|---|---|---|---|---|
| Number of visits or population | 30,047,000 | 29,066,900 | 980,100 | 78,473,200 |
| Visits or population, % | 100.0 | 96.7 | 3.3 | 100.0 |
| Age group, years, % | ||||
| <1 | 11.3 | 11.0 | 21.3 | 5.1 |
| 1-4 | 29.3 | 29.5 | 23.1 | 20.4 |
| 5-9 | 21.6 | 21.8 | 15.8 | 25.9 |
| 10-14 | 17.9 | 18.0 | 16.1 | 26.4 |
| 15-18 | 19.9 | 19.7 | 23.7 | 22.1 |
| Sex, % | ||||
| Female | 48.9 | 49.0 | 47.2 | 51.1 |
| Male | 51.1 | 51.0 | 52.8 | 48.9 |
| Community-level income, quartile, % | ||||
| 1 (lowest) | 36.4 | 36.5 | 34.3 | 26.6 |
| 2 | 25.5 | 25.6 | 23.8 | 23.7 |
| 3 | 21.5 | 21.5 | 22.0 | 24.8 |
| 4 (highest) | 15.3 | 15.2 | 18.4 | 24.9 |
| Patient residence, % | ||||
| Large central metropolitan | 30.1 | 29.9 | 34.6 | 31.0 |
| Large fringe metropolitan | 21.1 | 21.0 | 23.4 | 24.8 |
| Medium and small metropolitan | 31.9 | 31.9 | 30.8 | 30.2 |
| Micropolitan and noncore | 16.7 | 16.9 | 10.9 | 14.0 |
| Geographic region, % | ||||
| Northeast | 17.9 | 17.7 | 22.7 | 16.3 |
| Midwest | 21.2 | 21.4 | 17.6 | 21.3 |
| South | 40.7 | 40.7 | 42.0 | 38.1 |
| West | 20.2 | 20.2 | 17.7 | 24.4 |
| Payer,b % | ||||
| Medicaid | 61.6 | 61.6 | 59.0 | — |
| Private insurance | 28.2 | 28.0 | 34.8 | — |
| Uninsured | 6.3 | 6.4 | 2.7 | — |
| Other (including Medicare) | 3.8 | 3.8 | 3.5 | — |
| Abbreviation: ED, emergency department; FY, fiscal year Notes: Pediatric ED visits exclude births. Totals are rounded to the nearest hundred. The "other" payer category does not include missing values. a To adjust for use of fiscal year data, U.S. population estimates were calculated as the sum of one-quarter of the 2014 population and three-quarters of the 2015 population. b Population data are not available for primary expected payer categories. Source: Agency for Healthcare Research and Quality (AHRQ), Center for Delivery, Organization, and Markets, Healthcare Cost and Utilization Project (HCUP), Nationwide Emergency Department Sample (NEDS), Q4 2014–Q3 2015 | ||||
|
|
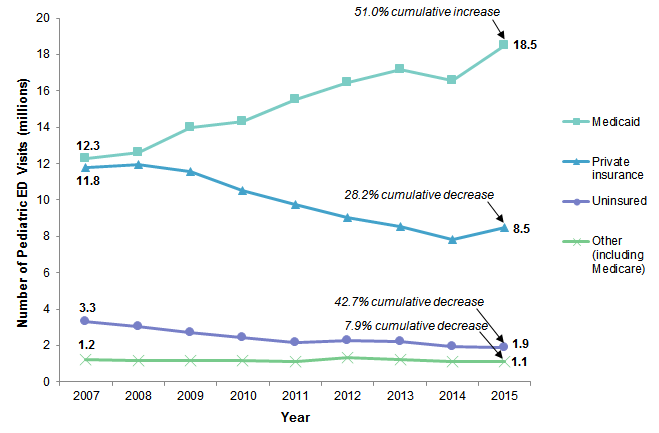
Figure 1. Trends in the number of pediatric ED visits by expected primary payer, FY 2007–FY 2015
Abbreviation: ED, emergency department; FY, fiscal year Line graph that shows the number of pediatric ED visits in millions by expected primary payer for FY 2007 to FY 2015. Medicaid: increased steadily from 12.3 in 2007 to 17.2 in 2013, declined to 16.6 in 2014, and increased to 18.5 in 2015, for a cumulative increase of 51.0%. Private insurance: increased from 11.8 in 2007 to 12.0 in 2008, decreased steadily to 7.8 in 2014, and increased to 8.5 in 2015, for a cumulative decrease of 28.2%. Uninsured: decreased steadily from 3.3 in 2007 to 2.2 in 2011, increased to 2.3 in 2012, decreased steadily to 1.9 in 2014 and 2015, for a 42.7% cumulative decrease. Other (including Medicare): held steady at 1.2 from 2007 to 2010, decreased to 1.1 in 2011, increased to 1.3 in 2012, decreased steadily to 1.1 in 2014 and 2015, for a cumulative decrease of 7.9%. |
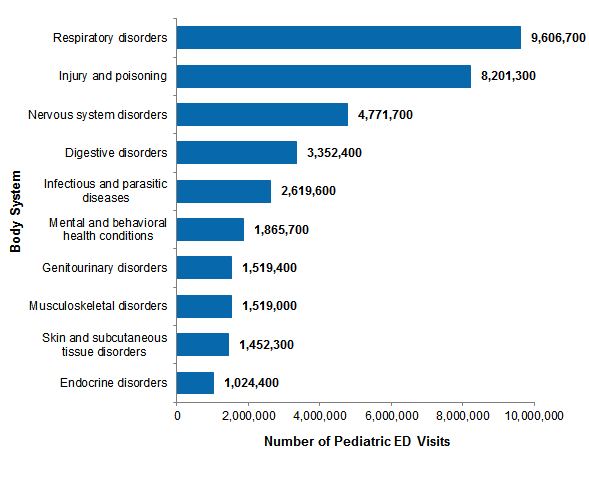
Figure 2 shows the most common reasons for all pediatric ED visits by body system, based on all-listed diagnoses in 2015. |
|
Figure 2. Ten most common all-listed reasons for pediatric ED visits by body system, FY 2015
Abbreviation: ED, emergency department; FY, fiscal year Bar chart shows the number of pediatric ED visits for the 10 most common reasons in FY 2015. Respiratory disorders: 9,606,700. Injury and poisoning: 8,201,300. Nervous system disorders: 4,771,700. Digestive disorders: 3,352,400. Infectious and parasitic diseases: 2,619,600. Mental and behavioral health conditions: 1,865,700. Genitourinary disorders: 1,519,400. Musculoskeletal disorders: 1,519,000. Skin and subcutaneous tissue disorders: 1,452,300. Endocrine disorders: 1,024,400.
|
|
|
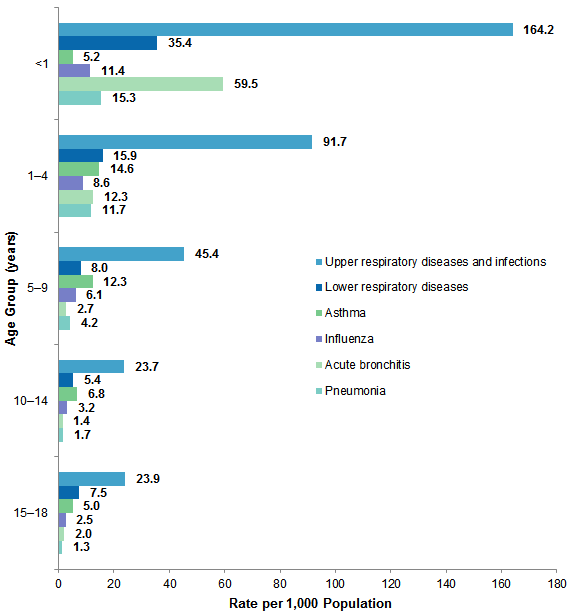
Figure 3. Six categories of first-listed respiratory conditions among pediatric ED visits by age group, FY 2015
Abbreviation: ED, emergency department; FY, fiscal year Bar chart that shows the rate per 1,000 population of pediatric ED visits for six categories of first-listed respiratory conditions by age in FY 2015. 15–18 years: Upper respiratory diseases and infections, 23.9; lower respiratory diseases, 7.5; asthma, 5.0; influenza, 2.5; acute bronchitis, 2.0; pneumonia, 1.3. 10–14 years: Upper respiratory diseases and infections, 23.7; lower respiratory diseases, 5.4; asthma, 6.8; influenza, 3.2; acute bronchitis, 1.4; pneumonia, 1.7. 5–9 years: Upper respiratory diseases and infections, 45.4; lower respiratory diseases, 8.0; asthma, 12.3; influenza, 6.1; acute bronchitis, 2.7; pneumonia, 4.2. 1–4 years: Upper respiratory diseases and infections, 91.7; lower respiratory diseases, 15.9; asthma, 14.6; influenza, 8.6; acute bronchitis, 12.3; pneumonia, 11.7. <1 year: Upper respiratory diseases and infections, 164.2; lower respiratory diseases, 35.4; asthma, 5.2; influenza, 11.4; acute bronchitis, 59.5; pneumonia, 15.3.
|
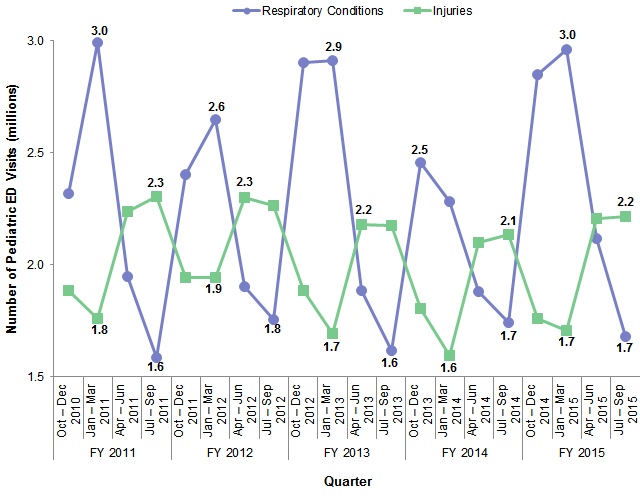
Figure 4 presents quarterly trends for two common reasons for pediatric ED visits—respiratory conditions and injuries—from 2011 through 2015. Although the condition category reported in Figure 2 includes both injuries and poisonings, this figure is limited to injury diagnoses to highlight the seasonal variation associated with these conditions. Totals are based on all-listed diagnoses. |
|
Figure 4. Comparison of seasonal variation for two common reasons for pediatric ED visits, FY 2011–FY 2015
Abbreviations: ED, emergency department; FY, fiscal year Line graph that shows the number of ED visits in millions for respiratory conditions and injuries by quarter for FY 2011 to FY 2015. Respiratory conditions: FY 2011: Q32010, 2.3; Q12011, 3.0; Q22011, 1.9; Q32011, 1.6; FY 2012: Q42011, 2.4; Q12012, 2.6; Q22012, 1.9; Q32012, 1.8; FY 2013: Q42012, 2.9; Q12013, 2.9; Q22013, 1.9; Q32013, 1.6; FY 2014: Q42013, 2.5; Q12014, 2.3; Q22014, 1.9; Q32014, 1.7; FY 2015: Q42014, 2.8; Q12015, 3.0; Q22015, 2.1; Q32015, 1.7. Injuries: FY 2011: Q32010, 1.9; Q12011, 1.8; Q22011, 2.2; Q32011, 2.3; FY 2012: Q42011, 1.9; Q12012, 1.9; Q22012, 2.3; Q32012, 2.3; FY 2013: Q42012, 1.9; Q12013, 1.7; Q22013, 2.2; Q32013, 2.2; FY 2014: Q42013, 1.8; Q12014, 1.6; Q22014, 2.1; Q32014, 2.1; FY 2015: Q42014, 1.8; Q12015, 1.7; Q22015, 2.2; Q32015, 2.2.
|
About Statistical Briefs Healthcare Cost and Utilization Project (HCUP) Statistical Briefs provide basic descriptive statistics on a variety of topics using HCUP administrative healthcare data. Topics include hospital inpatient, ambulatory surgery, and emergency department (ED) use and costs, quality of care, access to care, medical conditions, procedures, and patient populations, among other topics. The reports are intended to generate hypotheses that can be further explored in other research; the reports are not designed to answer in-depth research questions using multivariate methods. Data Source The estimates in this Statistical Brief are based upon data from the HCUP Q4 2014–Q3 2015 Nationwide Emergency Department Sample (NEDS). Historical data were drawn from the Q4 2006–Q3 2014 NEDS. Supplemental sources included population denominator data for use with HCUP databases, derived from information available from the U.S. Census Bureau11 and Claritas, a vendor that compiles and adds value to data from the U.S. Census Bureau.12 For this Statistical Brief, fiscal year (FY) was used. FY includes October through December of one year and January through September of the following year, thereby including all four seasons, as does calendar year. Beginning FY 2016, on October 1, 2015, the United States transitioned from the International Classification of Diseases, Ninth Revision, Clinical Modification (ICD-9-CM) clinical coding system to the International Classification of Diseases, Tenth Revision, Clinical Modification/Procedure Coding System (ICD-10-CM/PCS) clinical coding system. Although the impact of the change in coding systems on pediatric ED diagnoses has not been studied directly, the change has been observed to result in substantial shifts in the overall number of ED visits for some of the most frequent diagnoses.13 Although the coding change did not affect calendar years prior to 2015, FYs for all data reported in this Statistical Brief (2007–2015) were used to allow for comparability across years. Definitions Diagnoses, ICD-9-CM, Clinical Classifications Software (CCS), and body systems The first-listed diagnosis is the condition, symptom, or problem identified in the medical record to be chiefly responsible for the emergency department (ED) services provided. For ED visits that result in an inpatient admission to the same hospital, the first-listed diagnosis is the principal diagnosis, the condition established after study to be chiefly responsible for the patient's admission to the hospital. All-listed diagnoses include the first-listed diagnosis plus concomitant conditions that coexist at the time of the visit. ICD-9-CM is the International Classification of Diseases, Ninth Revision, Clinical Modification, which assigns numeric codes to diagnoses. There are approximately 14,000 ICD-9-CM diagnosis codes. CCS categorizes ICD-9-CM diagnosis codes into a manageable number of clinically meaningful categories.14 This clinical grouper makes it easier to quickly understand patterns of diagnoses. CCS categories identified as Other typically are not reported; these categories include miscellaneous, otherwise unclassifiable diagnoses that may be difficult to interpret as a group. The single-level CCS aggregates illnesses and conditions into 285 mutually exclusive diagnosis categories. The multilevel CCS expands the single-level CCS into a hierarchical system that groups single-level CCS categories into broader body systems or condition categories (e.g., Diseases of the Respiratory System and Injury and Poisoning). Case definition For this report, pediatric ED visits were defined as ED visits involving patients aged 18 years or younger. ED visits for births were excluded. Births were identified as having an ICD-9-CM diagnosis code of V3000 through V3901, with the last two digits being 00 or 01 in any diagnosis field. For FY 2015, rates per 1,000 population were calculated as follows:
The Nationwide Emergency Department Sample (NEDS) is based on data from community hospitals, which are defined as short-term, non-Federal, general, and other hospitals, excluding hospital units of other institutions (e.g., prisons). The NEDS includes specialty, pediatric, public, and academic medical hospitals. Excluded are long-term care facilities such as rehabilitation, psychiatric, and alcoholism and chemical dependency hospitals. Hospitals included in the NEDS have hospital-owned EDs and no more than 90 percent of their ED visits resulting in admission. ED visits ED visits include information on all visits to hospital-owned EDs regardless of whether the patient was treated and released from that ED or admitted to the same hospital from the ED. Treat-and-release ED visits were defined as those ED visits in which patients were treated and then released from the ED; that is, patients were not admitted to the specific hospital associated with the ED. ED visits resulting in admission to the same hospital included those patients initially seen in the ED who were then admitted to the specific hospital associated with that ED. Unit of analysis The unit of analysis is the ED visit, not a person or patient. This means that a person who is seen in the ED multiple times in 1 year will be counted each time as a separate visit in the ED. Location of patients' residence Place of residence is based on the urban-rural classification scheme for U.S. counties developed by the National Center for Health Statistics (NCHS) and based on the Office of Management and Budget (OMB) definition of a metropolitan service area as including a city and a population of at least 50,000 residents.
Community-level income is based on the median household income of the patient's ZIP Code of residence. Quartiles are defined so that the total U.S. population is evenly distributed. Cut-offs for the quartiles are determined annually using ZIP Code demographic data obtained from Claritas, a vendor that adds value to data from the U.S. Census Bureau.15 The value ranges for the income quartiles vary by year. The income quartile is missing for patients who are homeless or foreign. Payer Payer is the expected payer for the hospital stay. To make coding uniform across all HCUP data sources, payer combines detailed categories into general groups:
For this Statistical Brief, when more than one payer is listed for a hospital discharge, the first-listed payer is used. Region Region is one of the four regions defined by the U.S. Census Bureau:
Discharge status reflects the disposition of the patient at discharge from the ED and includes the following seven categories: routine (to home); transfer to a different short-term hospital; other transfers (including skilled nursing facility, intermediate care, and another type of facility such as a nursing home); home healthcare; against medical advice (AMA); died in the hospital; or destination unknown. About HCUP The Healthcare Cost and Utilization Project (HCUP, pronounced "H-Cup") is a family of healthcare databases and related software tools and products developed through a Federal-State-Industry partnership and sponsored by the Agency for Healthcare Research and Quality (AHRQ). HCUP databases bring together the data collection efforts of State data organizations, hospital associations, and private data organizations (HCUP Partners) and the Federal government to create a national information resource of encounter-level healthcare data. HCUP includes the largest collection of longitudinal hospital care data in the United States, with all-payer, encounter-level information beginning in 1988. These databases enable research on a broad range of health policy issues, including cost and quality of health services, medical practice patterns, access to healthcare programs, and outcomes of treatments at the national, State, and local market levels. HCUP would not be possible without the contributions of the following data collection Partners from across the United States: Alaska Department of Health and Social Services Alaska State Hospital and Nursing Home Association Arizona Department of Health Services Arkansas Department of Health California Office of Statewide Health Planning and Development Colorado Hospital Association Connecticut Hospital Association District of Columbia Hospital Association Florida Agency for Health Care Administration Georgia Hospital Association Hawaii Health Information Corporation Illinois Department of Public Health Indiana Hospital Association Iowa Hospital Association Kansas Hospital Association Kentucky Cabinet for Health and Family Services Louisiana Department of Health Maine Health Data Organization Maryland Health Services Cost Review Commission Massachusetts Center for Health Information and Analysis Michigan Health & Hospital Association Minnesota Hospital Association Mississippi State Department of Health Missouri Hospital Industry Data Institute Montana Hospital Association Nebraska Hospital Association Nevada Department of Health and Human Services New Hampshire Department of Health & Human Services New Jersey Department of Health New Mexico Department of Health New York State Department of Health North Carolina Department of Health and Human Services North Dakota (data provided by the Minnesota Hospital Association) Ohio Hospital Association Oklahoma State Department of Health Oregon Association of Hospitals and Health Systems Oregon Office of Health Analytics Pennsylvania Health Care Cost Containment Council Rhode Island Department of Health South Carolina Revenue and Fiscal Affairs Office South Dakota Association of Healthcare Organizations Tennessee Hospital Association Texas Department of State Health Services Utah Department of Health Vermont Association of Hospitals and Health Systems Virginia Health Information Washington State Department of Health West Virginia Department of Health and Human Resources, West Virginia Health Care Authority Wisconsin Department of Health Services Wyoming Hospital Association About the NEDS The HCUP Nationwide Emergency Department Database (NEDS) is a unique and powerful database that yields national estimates of emergency department (ED) visits. The NEDS was constructed using records from both the HCUP State Emergency Department Databases (SEDD) and the State Inpatient Databases (SID). The SEDD capture information on ED visits that do not result in an admission (i.e., patients who were treated in the ED and then released from the ED, or patients who were transferred to another hospital); the SID contain information on patients initially seen in the ED and then admitted to the same hospital. The NEDS was created to enable analyses of ED utilization patterns and support public health professionals, administrators, policymakers, and clinicians in their decision making regarding this critical source of care. The NEDS is produced annually beginning in 2006. Over time, the sampling frame for the NEDS has changed; thus, the number of States contributing to the NEDS varies from year to year. The NEDS is intended for national estimates only; no State-level estimates can be produced. For More Information For other information on pediatric emergency department (ED) visits and hospital stays, refer to the HCUP Statistical Briefs located at www.hcup-us.ahrq.gov/reports/statbriefs/sb_pediatric.jsp. For additional HCUP statistics, visit:
For a detailed description of HCUP and more information on the design of the Nationwide Emergency Department Sample (NEDS), please refer to the following database documentation: Agency for Healthcare Research and Quality. Overview of the Nationwide Emergency Department Sample (NEDS). Healthcare Cost and Utilization Project (HCUP). Rockville, MD: Agency for Healthcare Research and Quality. Updated December 2017. www.hcup-us.ahrq.gov/nedsoverview.jsp. Accessed January 18, 2018. Suggested Citation McDermott KW (IBM Watson Health), Stocks C (AHRQ), Freeman WJ (AHRQ). Overview of Pediatric Emergency Department Visits, 2015. HCUP Statistical Brief #242. August 2018. Agency for Healthcare Research and Quality, Rockville, MD. www.hcup-us.ahrq.gov/reports/statbriefs/sb242-Pediatric-ED-Visits-2015.pdf. Acknowledgments The authors would like to acknowledge the contributions of Minya Sheng of IBM Watson Health. *** AHRQ welcomes questions and comments from readers of this publication who are interested in obtaining more information about access, cost, use, financing, and quality of healthcare in the United States. We also invite you to tell us how you are using this Statistical Brief and other HCUP data and tools, and to share suggestions on how HCUP products might be enhanced to further meet your needs. Please e-mail us at hcup@ahrq.gov or send a letter to the address below:Virginia Mackay-Smith, Acting Director Center for Delivery, Organization, and Markets Agency for Healthcare Research and Quality 5600 Fishers Lane Rockville, MD 20857 This Statistical Brief was posted online on August 7, 2018. 1 Moore BJ, Stocks C, Owens PL. Trends in Emergency Department Visits, 2006–2014. HCUP Statistical Brief #227. September 2017. Agency for Healthcare Research and Quality, Rockville, MD. www.hcup-us.ahrq.gov/reports/statbriefs/sb227-Emergency-Department-Visit-Trends.pdf 2 National Center for Health Statistics. Health, United States, 2016: With Chartbook on Long-Term Trends in Health. Table 73. Emergency Department Visits Within the Past 12 Months Among Children Under Age 18, by Selected Characteristics: United States, Selected Years 1997–2015. Centers for Disease Control and Prevention, National Center for Health Statistics. www.cdc.gov/nchs/data/hus/hus16.pdf#073. Accessed April 4, 2018. 3 Wier LM, Yu H, Owens PL, Washington R. Overview of Children in the Emergency Department, 2010. HCUP Statistical Brief #157. June 2013. Agency for Healthcare Research and Quality, Rockville, MD. www.hcup-us.ahrq.gov/reports/statbriefs/sb157.pdf. 4 Cohen HA, Blau H, Hoshen M, Batat E, Balicer RD. Seasonality of asthma: a retrospective population study. Pediatrics. 2014;133(4):e923–32. 5 Saps M, Blank C, Khan S, Seshadri R, Marshall BM, Bass LM, et al. Seasonal variation in the presentation of abdominal pain. Journal of Pediatric Gastroentrology and Nutrition. 2008;46(3):279–84. 6 American Academy of Pediatrics, Committee on Pediatric Emergency Medicine; American College of Emergency Physicians, Pediatric Committee; Emergency Nurses Association, Pediatric Committee. Joint policy statement: guidelines for care of children in the emergency department. Journal of Emergency Nursing. 2013;39(2):116–31. 7 American Academy of Pediatrics, Committee on Pediatric Emergency Medicine; American College of Emergency Physicians, Pediatric Committee; Emergency Nurses Association, Pediatric Committee. Joint policy statement: guidelines for care of children in the emergency department. Journal of Emergency Nursing. 2013;39(2):116–31. 8 Institute of Medicine, Committee of the Future of Emergency Care in the US Health System. Emergency Care for Children: Growing Pains. Washington, DC: National Academy Press; 2006. 9 This definition aligns with the definition of child used by the Children's Health Insurance Program (CHIP) to determine eligibility. 10 FYs were used in this Statistical Brief because beginning FY 2016, on October 1, 2015, the United States transitioned from the International Classification of Diseases, Ninth Revision, Clinical Modification (ICD-9-CM) clinical coding system to the International Classification of Diseases, Tenth Revision, Clinical Modification/Procedure Coding System (ICD-10-CM/PCS) clinical coding system. Although the impact of the change in coding systems on pediatric ED diagnoses has not been studied directly, the change has been observed to result in substantial shifts in the overall number of ED visits for some of the most frequent diagnoses (ref. Moore BJ, McDermott KW, Elixhauser A. ICD-10-CM Diagnosis Coding in HCUP Data: Comparisons With ICD-9-CM and Precautions for Trend Analyses. November 28, 2017. Rockville, MD: U.S. Agency for Healthcare Research and Quality. www.hcup-us.ahrq.gov/datainnovations/ICD-10_DXCCS_Trends112817.pdf). Although the coding change did not affect calendar years prior to 2015, FYs for all data reported in this Statistical Brief (2007–2015) were used to allow for comparability across years. 11 Barrett M, Coffey R, Levit K. Population Denominator Data for Use with the HCUP Databases (Updated with 2016 Population Data). HCUP Methods Series Report #2017-04. October 17, 2017. U.S. Agency for Healthcare Research and Quality. www.hcup-us.ahrq.gov/reports/methods/2017-04.pdf. Accessed January 18, 2018. 12 Claritas. Claritas Demographic Profile by ZIP Code. https://claritas360.claritas.com/mybestsegments/. 13 Moore BJ, McDermott KW, Elixhauser A. ICD-10-CM Diagnosis Coding in HCUP Data: Comparisons With ICD-9-CM and Precautions for Trend Analyses. November 28, 2017. U.S. Agency for Healthcare Research and Quality. https://www.hcup-us.ahrq.gov/datainnovations/ICD-10_DXCCS_Trends112817.pdf. Accessed, July 5, 2018. 14 Agency for Healthcare Research and Quality. HCUP Clinical Classifications Software (CCS) for ICD-9-CM. Healthcare Cost and Utilization Project (HCUP). Agency for Healthcare Research and Quality. Updated March 2017. www.hcup-us.ahrq.gov/toolssoftware/ccs/ccs.jsp. Accessed January 18, 2018. 15 Claritas. Claritas Demographic Profile by ZIP Code. https://claritas360.claritas.com/mybestsegments/. |