STATISTICAL BRIEF #258 |
May 2020
Pamela L. Owens, Ph.D., Audrey J. Weiss, Ph.D., and Marguerite L. Barrett, M.S. Introduction Reflective of the national opioid crisis, the rate of opioid-related hospitalizations has increased substantially in the United States, from 164.2 per 100,000 population in 2006 to 296.9 per 100,000 population in 2016.1 The escalation in opioid-related inpatient stays has been accompanied by a disproportionately large increase in the costs associated with these types of hospitalizations. One study estimated that charges for hospital stays involving opioid abuse or dependence nearly quadrupled between 2002 and 2012, reaching almost $15 billion.2 The dramatic rise in hospitalizations related to taking opioids (defined as abuse, dependence, or use) and associated conditions place an increased burden on hospitals to be able to manage, treat, and potentially help minimize opioid-related problems for their patients. In October 2017, the American Hospital Association published a toolkit to assist hospitals in their efforts to address the opioid crisis, covering areas such as appropriate prescribing practices, identification and treatment of opioid use disorder, and nonopioid pain management.3 In order to help better focus hospital resources, it is important to understand which hospitals are facing the most substantial burden of opioid-related cases. This Healthcare Cost and Utilization Project (HCUP) Statistical Brief focuses on the hospital burden of opioid-related hospitalizations by hospital urban-rural location. The Statistical Brief presents hospital statistics on opioid-related inpatient stays using the 2016 State Inpatient Databases (SID) from 46 States and the District of Columbia. The hospital rate of opioid-related stays per 1,000 inpatient stays is examined for a total of 4,207 community hospitals (excluding rehabilitation and long-term acute care hospitals) classified based on the urban-rural location of the hospital: metropolitan (metro), rural and adjacent to a metropolitan area (rural-adjacent), and rural and not adjacent to a metropolitan area (rural-remote). The hospital rate of opioid-related stays is presented by hospital urban-rural location for each U.S. census division. The distribution of the rate is provided across all metropolitan and rural hospitals. Finally, the rate is presented by hospital urban-rural location for hospitals with different bed sizes and occupancy levels. All differences between estimates noted in the text are statistically significant at the .05 level or better. |
|
Findings
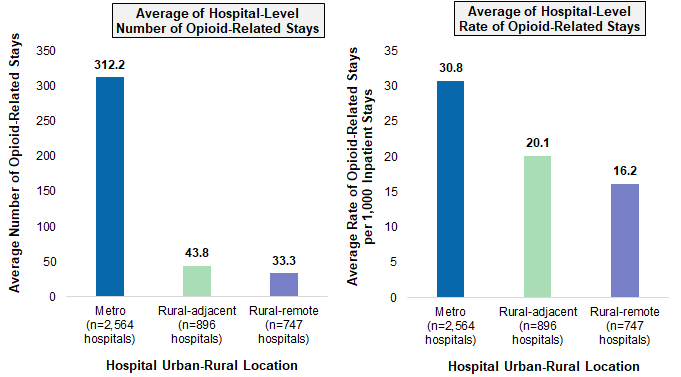
Burden of opioid-related stays in community hospitals by hospital urban-rural location, 2016 Figure 1 provides the average number and average hospital rate of opioid-related stays per 1,000 inpatient stays by hospital urban-rural location (metro, rural-adjacent to metro, and rural-remote) in 2016. |
|
Figure 1. Average number and average hospital rate of opioid-related inpatient stays, by hospital urban-rural location, 2016
Source: Agency for Healthcare Research and Quality (AHRQ), Healthcare Cost and Utilization Project (HCUP), State Inpatient Databases (SID) from 46 States and the District of Columbia (from all States except Alabama, Georgia, Idaho, and New Hampshire), 2016 Figure 1 consists of two bar charts that show the average number and average hospital rate of opioid-related stays by hospital urban-rural location in 2016. The average hospital-level number of opioid-related stays was 312.2 for metro hospitals (n=2,564 hospitals), 43.8 for hospitals in rural-adjacent to metro areas (n=896 hospitals), and 33.3 for hospitals in rural-remote areas (n=747 hospitals). The average hospital-level rate of opioid-related stays per 1,000 stays was 30.8 for metro hospitals (n=2,564), 20.1 for hospitals in rural-adjacent to metro areas (n=896), and 16.2 for hospitals in rural-remote areas (n=747). |
|
|
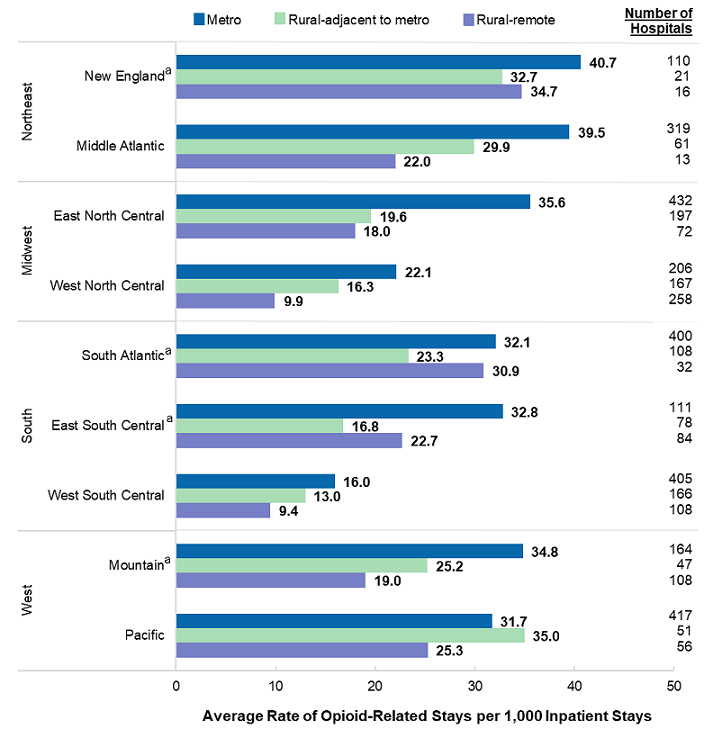
Figure 2. Average hospital rate of opioid-related stays per 1,000 inpatient stays, by hospital urban-rural location and U.S. census division, 2016
a Missing data from one State in the census division. Figure 2 is a horizontal bar chart that shows the average hospital rate of opioid-related stays per 1,000 inpatient stays by hospital urban-rural location and U.S. census division in 2016. Data are provided in Supplemental Table 1. |
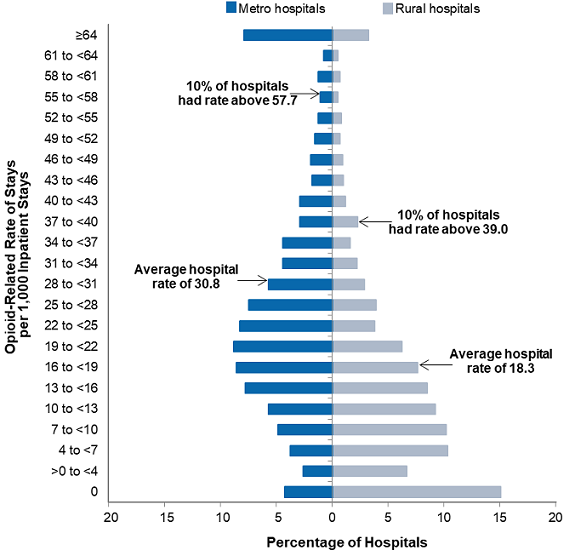
Figure 3 displays the distribution of hospital rates of opioid-related inpatient stays among metropolitan hospitals compared with rural hospitals (rural-adjacent and rural-remote hospitals were combined for this analysis). In addition to the average hospital rate, the rate threshold for the 10 percent of hospitals with the highest rates also is noted. |
|
Figure 3. Distribution of hospital rates of opioid-related stays per 1,000 inpatient stays across metropolitan and rural hospitals, 2016
Note: Hospitals with rates of 64 per 1,000 inpatient stays or larger were grouped into one category because of the small number of rural hospitals that exist in narrower rate groupings above this level. Figure 3 is a horizontal bar chart that shows the distribution of opioid-related rate of stays per 1,000 inpatient stays across metropolitan and rural hospitals in 2016. Ten percent of metro hospitals had a rate above 57.7, and 10 percent of rural hospitals had a rate above 39.0. The average hospital rate for metro hospitals was 30.8 and for rural hospitals was 18.3. Data are provided in Supplemental Table 2. |
|
|
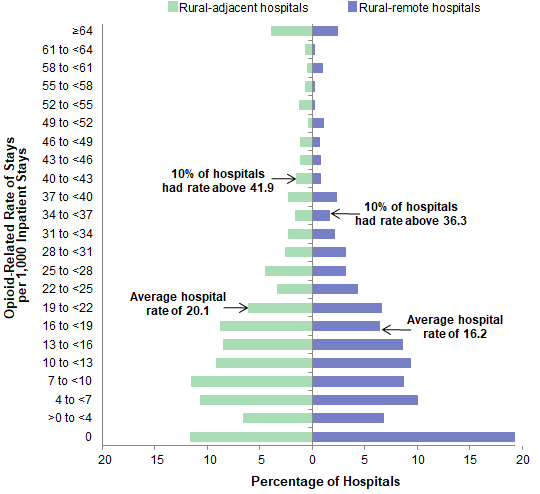
Figure 4. Distribution of hospital rates of opioid-related stays per 1,000 inpatient stays across two types of rural hospitals, 2016
Note: Hospitals with rates of 64 per 1,000 inpatient stays or larger were grouped into one category because of the small number of rural hospitals that exist in narrower rate groupings above this level. Figure 4 is a horizontal bar chart that shows the opioid-related rate of stays per 1,000 inpatient stays for rural-adjacent and rural-remote hospitals. Ten percent of rural-adjacent hospitals had a rate above 41.9, and 10 percent of rural-remote hospitals had a rate above 36.3. The average hospital rate for rural-adjacent hospitals was 20.1 and for rural-remote hospitals was 16.2. Data are provided in Supplemental Table 3. |
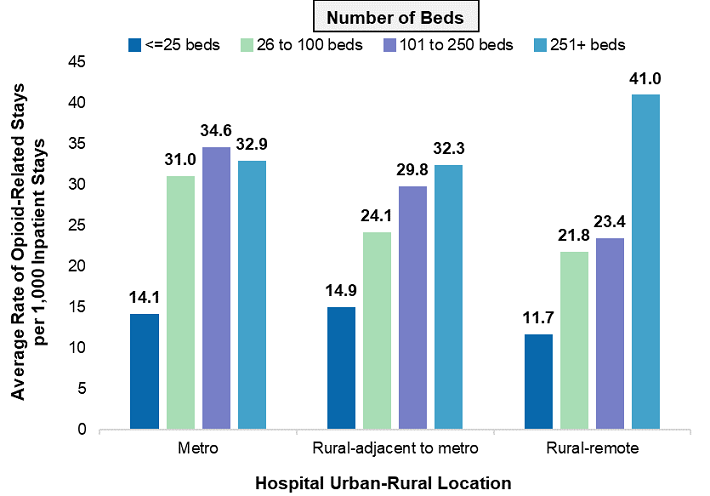
Figure 5 presents the average hospital rate of opioid-related inpatient stays by hospital urban-rural location and bed size in 2016. The number of hospitals by urban-rural location and bed size is provided below the figure, for reference. |
|
Figure 5. Average hospital rate of opioid-related stays per 1,000 inpatient stays, by hospital urban-rural location and bed size, 2016
Source: Agency for Healthcare Research and Quality (AHRQ), Healthcare Cost and Utilization Project (HCUP), State Inpatient Databases (SID) from 46 States and the District of Columbia (from all States except Alabama, Georgia, Idaho, and New Hampshire), 2016 Three bar charts that show the average rate of opioid-related stays per 1,000 inpatient stays by hospital urban-rural location and bed size in 2016. A supplemental table is included that shows the number of hospitals by hospital urban-rural location and bed size in 2016. Data are provided in Supplemental Table 4. | |||||||||||||||||||||||
|
|
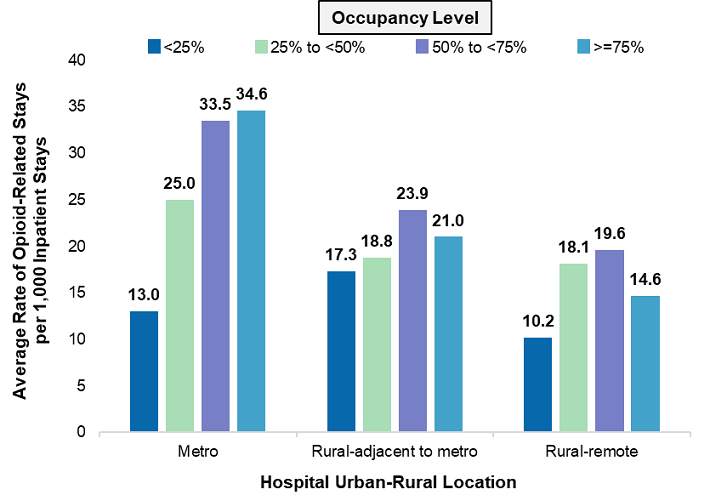
Figure 6. Average hospital rate of opioid-related stays per 1,000 inpatient stays, by hospital urban-rural location and occupancy level, 2016
Source: Agency for Healthcare Research and Quality (AHRQ), Healthcare Cost and Utilization Project (HCUP), State Inpatient Databases (SID) from 46 States and the District of Columbia (from all States except Alabama, Georgia, Idaho, and New Hampshire), 2016 Three bar charts that show the average rate of opioid-related stays per 1,000 inpatient stays by hospital urban-rural location and occupancy level in 2016. A supplemental table is included that shows the number of hospitals by hospital urban-rural location and bed size in 2016. Data are provided in Supplemental Table 5. | |||||||||||||||||||||||
Healthcare Cost and Utilization Project (HCUP) Statistical Briefs provide basic descriptive statistics on a variety of topics using HCUP administrative healthcare data. Topics include hospital inpatient, ambulatory surgery, and emergency department use and costs, quality of care, access to care, medical conditions, procedures, and patient populations, among other topics. The reports are intended to generate hypotheses that can be further explored in other research; the reports are not designed to answer in-depth research questions using multivariate methods. Data Source The estimates in this Statistical Brief are based upon data from the HCUP 2016 State Inpatient Databases (SID) from 46 States and the District of Columbia: Alaska, Arkansas, Arizona, California, Connecticut, Colorado, Delaware, District of Columbia, Florida, Hawaii, Iowa, Illinois, Indiana, Kansas, Kentucky, Louisiana, Maryland, Maine, Massachusetts, Michigan, Minnesota, Missouri, Mississippi, Montana, North Carolina, North Dakota, Nebraska, Nevada, New Jersey, New Mexico, New York, Ohio, Oklahoma, Oregon, Pennsylvania, Rhode Island, South Carolina, South Dakota, Tennessee, Texas, Utah, Vermont, Virginia, Washington, Wisconsin, West Virginia, and Wyoming. Table 1 presents a summary of the number of hospitals for which HCUP 2016 inpatient data were available for analysis by U.S. census region and division. |
| Table 1. Hospitals with available HCUP inpatient data, 2016 | |||
| U.S. census region/division | Total number of U.S. hospitals (from AHA) | Number of hospitals with HCUP inpatient data | Hospitals with HCUP inpatient data, % |
|---|---|---|---|
| United States | 4,654 | 4,207 | 90.4 |
| Northeast | 572 | 540 | 94.4 |
| New Englanda | 176 | 147 | 83.5 |
| Middle Atlantic | 396 | 393 | 99.2 |
| Midwest | 1,391 | 1,332 | 95.8 |
| East North Central | 715 | 701 | 98.0 |
| West North Central | 676 | 631 | 93.3 |
| South | 1,784 | 1,492 | 83.6 |
| South Atlantica | 679 | 540 | 79.5 |
| East South Centrala | 384 | 273 | 71.1 |
| West South Central | 721 | 679 | 94.2 |
| West | 907 | 843 | 92.9 |
| Mountaina | 378 | 319 | 84.4 |
| Pacific | 529 | 524 | 99.1 |
| Abbreviation: AHA, American Hospital Association Note: Hospitals were community hospitals, excluding rehabilitation and long-term acute care hospitals. a Missing data from one State in the census division. Source: Agency for Healthcare Research and Quality (AHRQ), Healthcare Cost and Utilization Project (HCUP), State Inpatient Databases (SID) from 46 States and the District of Columbia (from all States except Alabama, Georgia, Idaho, and New Hampshire), 2016 | |||
Definitions
Diagnoses and ICD-10-CM The principal diagnosis is that condition established after study to be chiefly responsible for the patient's admission to the hospital. Secondary diagnoses are concomitant conditions that coexist at the time of admission or develop during the stay. All-listed diagnoses include the principal diagnosis plus these additional secondary conditions. ICD-10-CM is the International Classification of Diseases, Tenth Revision, Clinical Modification. In October 2015, ICD-10-CM replaced the ICD-9-CM diagnosis with the ICD-10-CM diagnosis coding system for most inpatient and outpatient medical encounters. There are over 70,000 ICD-10-CM diagnosis codes. Case definition Opioid-related inpatient stays were defined using the all-listed ICD-10-CM diagnosis codes shown in Table 2. |
| Table 2. ICD-10-CM diagnosis codes defining opioid-related inpatient stays | |
| ICD-10-CM diagnosis code | Description |
|---|---|
| F11.10 | Opioid abuse, uncomplicated |
| F11.120 | Opioid abuse with intoxication, uncomplicated |
| F11.121 | Opioid abuse with intoxication, delirium |
| F11.122 | Opioid abuse with intoxication, with perceptual disturbance |
| F11.129 | Opioid abuse with intoxication, unspecified |
| F11.14 | Opioid abuse with opioid-induced mood disorder |
| F11.150 | Opioid abuse with opioid-induced psychotic disorder, with delusions |
| F11.151 | Opioid abuse with opioid-induced psychotic disorder, with hallucinations |
| F11.159 | Opioid abuse with opioid-induced psychotic disorder, unspecified |
| F11.181 | Opioid abuse with opioid-induced sexual dysfunction |
| F11.182 | Opioid abuse with opioid-induced sleep disorder |
| F11.188 | Opioid abuse with other opioid-induced disorder |
| F11.19 | Opioid abuse with unspecified opioid-induced disorder |
| F11.20 | Opioid dependence, uncomplicated |
| F11.220 | Opioid dependence with intoxication, uncomplicated |
| F11.221 | Opioid dependence with intoxication, delirium |
| F11.222 | Opioid dependence with intoxication, with perceptual disturbance |
| F11.229 | Opioid dependence with intoxication, unspecified |
| F11.23 | Opioid dependence with withdrawal |
| F11.24 | Opioid dependence with opioid-induced mood disorder |
| F11.250 | Opioid dependence with opioid-induced psychotic disorder, with delusions |
| F11.251 | Opioid dependence with opioid-induced psychotic disorder, with hallucinations |
| F11.259 | Opioid dependence with opioid-induced psychotic disorder, unspecified |
| F11.281 | Opioid dependence with opioid-induced sexual dysfunction |
| F11.282 | Opioid dependence with opioid-induced sleep disorder |
| F11.288 | Opioid dependence with other opioid-induced disorder |
| F11.29 | Opioid dependence with unspecified opioid-induced disorder |
| F11.90 | Opioid use, unspecified, uncomplicated |
| F11.920 | Opioid use, unspecified with intoxication, uncomplicated |
| F11.921 | Opioid use, unspecified with intoxication delirium |
| F11.922 | Opioid use, unspecified with intoxication, with perceptual disturbance |
| F11.929 | Opioid use, unspecified with intoxication, unspecified |
| F11.93 | Opioid use, unspecified, with withdrawal |
| F11.94 | Opioid use, unspecified, with opioid-induced mood disorder |
| F11.950 | Opioid use, unspecified with opioid-induced psychotic disorder, with delusions |
| F11.951 | Opioid use, unspecified with opioid-induced psychotic disorder, with hallucinations |
| F11.959 | Opioid use, unspecified with opioid-induced psychotic disorder, unspecified |
| F11.981 | Opioid use, unspecified with opioid-induced sexual dysfunction |
| F11.982 | Opioid use, unspecified with opioid-induced sleep disorder |
| F11.988 | Opioid use, unspecified with other opioid-induced disorder |
| F11.99 | Opioid use, unspecified, with unspecified opioid-induced disorder |
| T40.0X1A | Poisoning by opium, accidental (unintentional), initial encounter |
| T40.0X1D | Poisoning by opium, accidental (unintentional), subsequent encounter |
| T40.0X2A | Poisoning by opium, intentional self-harm, initial encounter |
| T40.0X2D | Poisoning by opium, intentional self-harm, subsequent encounter |
| T40.0X3A | Poisoning by opium, assault, initial encounter |
| T40.0X3D | Poisoning by opium, assault, subsequent encounter |
| T40.0X4A | Poisoning by opium, undetermined, initial encounter |
| T40.0X4D | Poisoning by opium, undetermined, subsequent encounter |
| T40.0X5A | Adverse effect of opium, initial encounter |
| T40.0X5D | Adverse effect of opium, subsequent encounter |
| T40.1X1A | Poisoning by heroin, accidental (unintentional), initial encounter |
| T40.IXID | Poisoning by heroin, accidental (unintentional), subsequent encounter |
| T40.1X2A | Poisoning by heroin, intentional self-harm, initial encounter |
| T40.1X2D | Poisoning by heroin, intentional self-harm, subsequent encounter |
| T40.1X3A | Poisoning by heroin, assault, initial encounter |
| T40.1X3D | Poisoning by heroin, assault, subsequent encounter |
| T40.1X4A | Poisoning by heroin, undetermined, initial encounter |
| T40.1X4D | Poisoning by heroin, undetermined, subsequent encounter |
| T40.2X1A | Poisoning by other opioids, accidental (unintentional), initial encounter |
| T40.2X1D | Poisoning by other opioids, accidental (unintentional), subsequent encounter |
| T40.2X2A | Poisoning by other opioids, intentional self-harm, initial encounter |
| T40.2X2D | Poisoning by other opioids, intentional self-harm, subsequent encounter |
| T40.2X3A | Poisoning by other opioids, assault, initial encounter |
| T40.2X3D | Poisoning by other opioids, assault, subsequent encounter |
| T40.2X4A | Poisoning by other opioids, undetermined, initial encounter |
| T40.2X4D | Poisoning by other opioids, undetermined, subsequent encounter |
| T40.2X5A | Adverse effect of other opioids, initial encounter |
| T40.2X5D | Adverse effect of other opioids, subsequent encounter |
| T40.3X1A | Poisoning by methadone, accidental (unintentional), initial encounter |
| T40.3X1D | Poisoning by methadone, accidental (unintentional), subsequent encounter |
| T40.3X2A | Poisoning by methadone, intentional self-harm, initial encounter |
| T40.3X2D | Poisoning by methadone, intentional self-harm, subsequent encounter |
| T40.3X3A | Poisoning by methadone, assault, initial encounter |
| T40.3X3D | Poisoning by methadone, assault, subsequent encounter |
| T40.3X4A | Poisoning by methadone, undetermined, initial encounter |
| T40.3X4D | Poisoning by methadone, undetermined, subsequent encounter |
| T40.3X5A | Adverse effect of methadone, initial encounter |
| T40.3X5D | Adverse effect of methadone, subsequent encounter |
| T40.4X1A | Poisoning by synthetic narcotics, accidental (unintentional), initial encounter |
| T40.4X1D | Poisoning by synthetic narcotics, accidental (unintentional), subsequent encounter |
| T40.4X2A | Poisoning by other synthetic narcotics, intentional self-harm, initial encounter |
| T40.4X2D | Poisoning by other synthetic narcotics, intentional self-harm, subsequent encounter |
| T40.4X3A | Poisoning by other synthetic narcotics, assault, initial encounter |
| T40.4X3D | Poisoning by other synthetic narcotics, assault, subsequent encounter |
| T40.4X4A | Poisoning by synthetic narcotics, undetermined, initial encounter |
| T40.4X4D | Poisoning by synthetic narcotics, undetermined, subsequent encounter |
| T40.4X5A | Adverse effect of synthetic narcotics, initial encounter |
| T40.4X5D | Adverse effect of synthetic narcotic, subsequent encounter |
| T40.601A | Poisoning by unspecified narcotics, accidental (unintentional), initial encounter |
| T40.601D | Poisoning by unspecified narcotics, accidental (unintentional), subsequent encounter |
| T40.602A | Poisoning by unspecified narcotics, intentional self-harm, initial encounter |
| T40.602D | Poisoning by unspecified narcotics, intentional self-harm, subsequent encounter |
| T40.603A | Poisoning by unspecified narcotics, assault, initial encounter |
| T40.603D | Poisoning by unspecified narcotics, assault, subsequent encounter |
| T40.604A | Poisoning by unspecified narcotics, undetermined, initial encounter |
| T40.604D | Poisoning by unspecified narcotics, undetermined, subsequent encounter |
| T40.605A | Adverse effect of unspecified narcotics, initial encounter |
| T40.605D | Adverse effect of unspecified narcotics, subsequent encounter |
| T40.691A | Poisoning by other narcotics, accidental (unintentional), initial encounter |
| T40.691D | Poisoning by other narcotics, accidental (unintentional), subsequent encounter |
| T40.692A | Poisoning by other narcotics, intentional self-harm, initial encounter |
| T40.692D | Poisoning by other narcotics, intentional self-harm, subsequent encounter |
| T40.693A | Poisoning by other narcotics, assault, initial encounter |
| T40.693D | Poisoning by other narcotics, assault, subsequent encounter |
| T40.694A | Poisoning by other narcotics, undetermined, initial encounter |
| T40.694D | Poisoning by other narcotics, undetermined, subsequent encounter |
| T40.695A | Adverse effect of other narcotics, initial encounter |
| T40.695D | Adverse effect of other narcotics, subsequent encounter |
| Abbreviation: ICD-10-CM, International Classification of Diseases, Tenth Revision, Clinical Modification | |
Types of hospitals included in HCUP State Inpatient Databases This analysis used State Inpatient Databases (SID) limited to data from community hospitals, which are defined as short-term, non-Federal, general, and other hospitals, excluding hospital units of other institutions (e.g., prisons). Community hospitals include obstetrics and gynecology, otolaryngology, orthopedic, cancer, pediatric, public, and academic medical hospitals. Excluded for this analysis are long-term care facilities such as rehabilitation, psychiatric, and alcoholism and chemical dependency hospitals. However, if a patient received long-term care, rehabilitation, or treatment for a psychiatric or chemical dependency condition in a community hospital, the discharge record for that stay was included in the analysis. Unit of analysis The unit of analysis in this Statistical Brief is the hospital. Hospital counts of opioid-related inpatient stays are based on the discharge (i.e., the hospital stay), not a person or patient. This means that a person who is admitted to the hospital multiple times in 1 year will be counted each time as a separate discharge from the hospital. Urban-rural location of hospital Hospital urban-rural location is based on the rural-urban continuum codes (RUCC) for U.S. counties developed by the United States Department of Agriculture (USDA).4 For this Statistical Brief, we collapsed the RUCC codes into the following three categories: Metropolitan (metro) area:
Region is one of the four regions defined by the U.S. Census Bureau. Division corresponds to the location of the hospital and is one of the nine divisions defined by the U.S. Census Bureau.
The Healthcare Cost and Utilization Project (HCUP, pronounced "H-Cup") is a family of healthcare databases and related software tools and products developed through a Federal-State-Industry partnership and sponsored by the Agency for Healthcare Research and Quality (AHRQ). HCUP databases bring together the data collection efforts of State data organizations, hospital associations, and private data organizations (HCUP Partners) and the Federal government to create a national information resource of encounter-level healthcare data. HCUP includes the largest collection of longitudinal hospital care data in the United States, with all-payer, encounter-level information beginning in 1988. These databases enable research on a broad range of health policy issues, including cost and quality of health services, medical practice patterns, access to healthcare programs, and outcomes of treatments at the national, State, and local market levels. HCUP would not be possible without the contributions of the following data collection Partners from across the United States: Alaska Department of Health and Social Services Alaska State Hospital and Nursing Home Association Arizona Department of Health Services Arkansas Department of Health California Office of Statewide Health Planning and Development Colorado Hospital Association Connecticut Hospital Association Delaware Division of Public Health District of Columbia Hospital Association Florida Agency for Health Care Administration Georgia Hospital Association Hawaii Laulima Data Alliance, a subsidiary of the Healthcare Association of Hawaii Illinois Department of Public Health Indiana Hospital Association Iowa Hospital Association Kansas Hospital Association Kentucky Cabinet for Health and Family Services Louisiana Department of Health Maine Health Data Organization Maryland Health Services Cost Review Commission Massachusetts Center for Health Information and Analysis Michigan Health & Hospital Association Minnesota Hospital Association Mississippi State Department of Health Missouri Hospital Industry Data Institute Montana Hospital Association Nebraska Hospital Association Nevada Department of Health and Human Services New Hampshire Department of Health & Human Services New Jersey Department of Health New Mexico Department of Health New York State Department of Health North Carolina Department of Health and Human Services North Dakota (data provided by the Minnesota Hospital Association) Ohio Hospital Association Oklahoma State Department of Health Oregon Association of Hospitals and Health Systems Oregon Office of Health Analytics Pennsylvania Health Care Cost Containment Council Rhode Island Department of Health South Carolina Revenue and Fiscal Affairs Office South Dakota Association of Healthcare Organizations Tennessee Hospital Association Texas Department of State Health Services Utah Department of Health Vermont Association of Hospitals and Health Systems Virginia Health Information Washington State Department of Health West Virginia Department of Health and Human Resources, West Virginia Health Care Authority Wisconsin Department of Health Services Wyoming Hospital Association About the SID The HCUP State Inpatient Databases (SID) are hospital inpatient databases from data organizations participating in HCUP. The SID contain the universe of the inpatient discharge abstracts in the participating HCUP States, translated into a uniform format to facilitate multistate comparisons and analyses. Together, the SID encompass more than 95 percent of all U.S. community hospital discharges. The SID can be used to investigate questions unique to one State, to compare data from two or more States, to conduct market-area variation analyses, and to identify State-specific trends in inpatient care utilization, access, charges, and outcomes. For More Information For other information on mental and substance use disorders, refer to the HCUP Statistical Briefs located at www.hcup-us.ahrq.gov/reports/statbriefs/sb_mhsa.jsp. For additional HCUP statistics, visit:
For a detailed description of HCUP and more information on the design of the State Inpatient Databases (SID), please refer to the following database documentation: Agency for Healthcare Research and Quality. Overview of the State Inpatient Databases (SID). Healthcare Cost and Utilization Project (HCUP). Rockville, MD: Agency for Healthcare Research and Quality. Updated November 2019. www.hcup-us.ahrq.gov/sidoverview.jsp. Accessed February 3, 2020. Suggested Citation Owens PL (AHRQ), Weiss AJ (IBM Watson Health), Barrett ML (M.L. Barrett, Inc.). Hospital Burden of Opioid-Related Inpatient Stays: Metropolitan and Rural Hospitals, 2016. HCUP Statistical Brief #258. May 2020. Agency for Healthcare Research and Quality, Rockville, MD. www.hcup-us.ahrq.gov/reports/statbriefs/sb258-Opioid-Hospitalizations-Rural-Metro-Hospitals-2016.pdf. Acknowledgments The authors would like to acknowledge the contributions of Minya Sheng of IBM Watson Health. *** AHRQ welcomes questions and comments from readers of this publication who are interested in obtaining more information about access, cost, use, financing, and quality of healthcare in the United States. We also invite you to tell us how you are using this Statistical Brief and other HCUP data and tools, and to share suggestions on how HCUP products might be enhanced to further meet your needs. Please e-mail us at hcup@ahrq.gov or send a letter to the address below:Joel W. Cohen, Ph.D., Director Center for Financing, Access and Cost Trends Agency for Healthcare Research and Quality 5600 Fishers Lane Rockville, MD 20857 This Statistical Brief was posted online on May 26, 2020. 1 Healthcare Cost and Utilization Project. HCUP Fast Stats, Opioid-Related Hospital Use. www.hcup-us.ahrq.gov/faststats/OpioidUseServlet?setting1=IP&location=US. Accessed January 26, 2020. 2 Ronan MV, Herzig SJ. Hospitalizations related to opioid abuse/dependence and associated serious infections increased sharply, 2002-12. Health Affairs. 2016;35(5):832-7. 3 American Hospital Association. Stem the Tide: Addressing the Opioid Epidemic. 2017. Chicago: IL. www.aha.org/opioidtoolkit. 4 United States Department of Agriculture. Rural-Urban Continuum Codes. www.ers.usda.gov/data-products/rural-urban-continuum-codes/. Accessed June 26, 2019. |
| Supplemental Table 1. Average hospital rate of opioid-related stays per 1,000 inpatient stays, by hospital urban-rural location and U.S. census division, 2016, for data presented in Figure 2 | ||||||
| Region/division | Metro | Rural-adjacent to metro | Rural-remote | |||
|---|---|---|---|---|---|---|
| Rate of stays | No. of hospitals | Rate of stays | No. of hospitals | Rate of stays | No. of hospitals | |
| Northeast | ||||||
| New England | 40.7 | 110 | 32.7 | 21 | 34.7 | 16 |
| Middle Atlantic | 39.5 | 319 | 29.9 | 61 | 22.0 | 13 |
| Midwest | ||||||
| East North Central | 35.6 | 432 | 19.6 | 197 | 18.0 | 72 |
| West North Central | 22.1 | 206 | 16.3 | 167 | 9.9 | 258 |
| South | ||||||
| South Atlantic | 32.1 | 400 | 23.3 | 108 | 30.9 | 32 |
| East South Central | 32.8 | 111 | 16.8 | 78 | 22.7 | 84 |
| West South Central | 16.0 | 405 | 13.0 | 166 | 9.4 | 108 |
| West | ||||||
| Mountain | 34.8 | 164 | 25.2 | 47 | 19.0 | 108 |
| Pacific | 31.7 | 417 | 35.0 | 51 | 25.3 | 56 |
| Supplemental Table 2. Distribution of hospital rates of opioid-related stays per 1,000 inpatient stays across metropolitan and rural hospitals, 2016, for data presented in Figure 3 | ||
| Opioid-related rate of stays per 1,000 stays | Percentage of hospitals | |
|---|---|---|
| Metro hospitals | Rural hospitals | |
| >64 | 7.9 | 3.2 |
| 61 to <64 | 0.8 | 0.5 |
| 58 to <61 | 1.2 | 0.7 |
| 55 to <58 | 1.1 | 0.5 |
| 52 to <55 | 1.2 | 0.8 |
| 49 to <52 | 1.6 | 0.7 |
| 46 to <49 | 1.9 | 0.9 |
| 43 to <46 | 1.8 | 1.0 |
| 40 to <43 | 2.9 | 1.2 |
| 37 to <40 | 2.9 | 2.3 |
| 34 to <37 | 4.4 | 1.6 |
| 31 to <34 | 4.4 | 2.2 |
| 28 to <31 | 5.7 | 2.9 |
| 25 to <28 | 7.5 | 3.9 |
| 22 to <25 | 8.3 | 3.8 |
| 19 to <22 | 8.8 | 6.3 |
| 16 to <19 | 8.6 | 7.7 |
| 13 to <16 | 7.8 | 8.5 |
| 10 to <13 | 5.7 | 9.3 |
| 7 to <10 | 4.9 | 10.2 |
| 4 to <7 | 3.8 | 10.3 |
| >0 to <4 | 2.6 | 6.7 |
| 0 | 4.3 | 15.1 |
| Supplemental Table 3. Supplemental Table 3. Distribution of hospital rates of opioid-related stays per 1,000 inpatient stays across metropolitan and rural hospitals, 2016, for data presented in Figure 4 | ||
| Opioid-related rate of stays per 1,000 stays | Percentage of hospitals | |
|---|---|---|
| Rural-adjacent hospitals | Rural-remote hospitals | |
| >64 | 3.9 | 2.4 |
| 61 to <64 | 0.7 | 0.3 |
| 58 to <61 | 0.4 | 0.9 |
| 55 to <58 | 0.7 | 0.3 |
| 52 to <55 | 1.2 | 0.3 |
| 49 to <52 | 0.3 | 1.1 |
| 46 to <49 | 1.1 | 0.7 |
| 43 to <46 | 1.1 | 0.8 |
| 40 to <43 | 1.5 | 0.8 |
| 37 to <40 | 2.2 | 2.3 |
| 34 to <37 | 1.6 | 1.6 |
| 31 to <34 | 2.2 | 2.1 |
| 28 to <31 | 2.6 | 3.2 |
| 25 to <28 | 4.5 | 3.2 |
| 22 to <25 | 3.3 | 4.3 |
| 19 to <22 | 6.0 | 6.6 |
| 16 to <19 | 8.7 | 6.4 |
| 13 to <16 | 8.5 | 8.6 |
| 10 to <13 | 9.2 | 9.4 |
| 7 to <10 | 11.5 | 8.7 |
| 4 to <7 | 10.6 | 10.0 |
| >0 to <4 | 6.6 | 6.8 |
| 0 | 11.6 | 19.3 |
| Supplemental Table 4. Average hospital rate of opioid-related stays per 1,000 inpatient stays, by hospital urban-rural location and bed size, 2016, for data presented in Figure 5 | |||
| Number of beds | Metro | Rural-adjacent to metro | Rural-remote |
|---|---|---|---|
| <=25 beds | 14.1 | 14.9 | 11.7 |
| 26 to 100 beds | 31.0 | 24.1 | 21.8 |
| 101 to 250 beds | 34.6 | 29.8 | 23.4 |
| 251+ beds | 32.9 | 32.3 | 41.0 |
| Supplemental Table 5. Average hospital rate of opioid-related stays per 1,000 inpatient stays, by hospital urban-rural location and occupancy level, 2016, for data presented in Figure 6 | |||
| Occupancy level, % | Metro | Rural-adjacent to metro | Rural-remote |
|---|---|---|---|
| <25 | 13.0 | 17.3 | 10.2 |
| 25-50 | 25.0 | 18.8 | 18.1 |
| 50-75 | 33.5 | 23.9 | 19.6 |
| >75 | 34.6 | 21.0 | 14.6 |