STATISTICAL BRIEF #259 |
June 2020
Kimberly W. McDermott, Ph.D., and H. Joanna Jiang, Ph.D. Introduction Hospital care represents the largest component of U.S. healthcare expenditures.1 As a result, reducing potentially preventable hospitalizations has become a priority among policymakers and public and private payers.2 Potentially preventable hospitalizations are inpatient stays for treating ambulatory care-sensitive conditions (ACSCs) that evidence suggests may be avoidable, in part, through timely and quality primary and preventive care.3 Examples of ACSCs include complications of diabetes and asthma. High hospital admission rates for these conditions may indicate areas where changes to the healthcare delivery system could be implemented to improve patient outcomes and lower costs. Determining the volume and costs of potentially preventable inpatient stays can identify where potential cost savings might be found associated with reducing these hospitalizations overall and among specific subpopulations. This Healthcare Cost and Utilization Project (HCUP) Statistical Brief presents weighted national estimates of potentially preventable inpatient stays using the State Inpatient Databases (SID) from 36 States. Potentially preventable stays were defined using the Agency for Healthcare Research and Quality (AHRQ) Prevention Quality Indicators (PQIs)4 and Pediatric Quality Indicators (PDIs).5 The PQIs and area-level PDIs were developed to identify hospitalizations for ACSCs. This Statistical Brief presents statistics on potentially preventable inpatient stays separately for adults and children. Obstetric stays and neonatal stays are excluded. The total number of adult and pediatric potentially preventable stays and associated aggregate costs are presented for chronic and acute conditions. For adults, age-sex-adjusted rates are presented by patient characteristics and hospital census region for all conditions, chronic conditions only, and acute conditions only. The number of inpatient stays, aggregate costs, and mean cost per stay are presented for each condition category as well as for individual conditions. Additionally, volume and cost statistics are presented by primary expected payer. For children, age-sex-adjusted rates, as well as volume and cost statistics for four individual pediatric conditions are provided. Because of the large sample size of the SID data, small differences can be statistically significant. Thus, only percentage differences greater than or equal to 10 percent are discussed in the text. |
|
Findings
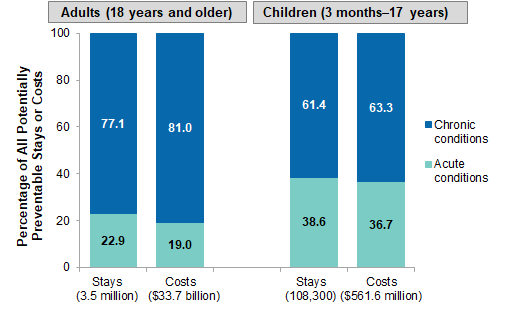
Potentially preventable adult and pediatric inpatient stays, 2017 Figure 1 presents the total number of nonobstetric adult (patients aged 18 years and older) and pediatric (patients aged 3 months to 17 years) stays and related aggregate hospital costs in 2017 that were potentially preventable. Among adults, chronic conditions include four diabetes-specific conditions6 as well as chronic respiratory diseases (chronic obstructive pulmonary disease and asthma in younger adults) and circulatory diseases (hypertension and heart failure). Acute conditions include community-acquired pneumonia and urinary tract infection.7 Among children, chronic conditions include asthma and diabetes short-term complications. Acute conditions include gastroenteritis and urinary tract infection. |
|
Figure 1. Potentially preventable stays and related costs for chronic and acute conditions, 2017
Note: Consistent with the Agency for Healthcare Research and Quality Prevention Quality Indicators and Pediatric Quality Indicators, obstetric stays are excluded. Bar chart that shows the percentage of all potentially preventable stays or costs for chronic and acute conditions in 2017. For adults 18 years and older, 77.1 percent of 3.5 million stays were for chronic conditions and 22.9 percent were for acute conditions, and 81.0 percent of $33.7 billion in costs were for chronic conditions and 19.0 percent were for acute conditions. For children 3 months to 17 years, 61.4 percent of 108,300 stays were for chronic conditions and 38.6 percent were for acute conditions, and 63.3 percent of $561.6 million in costs were for chronic conditions and 36.7 percent were for acute conditions. |
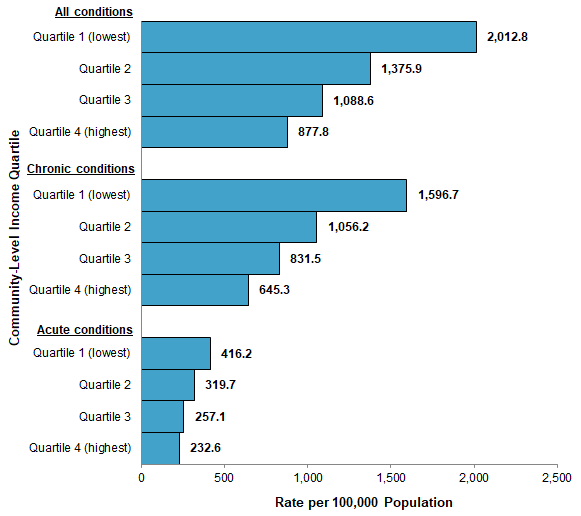
Figure 2 presents the 2017 age-sex-adjusted population rate of potentially preventable inpatient stays among adults for all conditions and for chronic and acute conditions separately by community-level income quartile. |
|
Figure 2. Rate of potentially preventable adult inpatient stays, by community-level income, 2017
Notes: Rates are adjusted for age and sex. Consistent with the Agency for Healthcare Research and Quality Prevention Quality Indicators, obstetric stays are excluded. Bar chart that shows the rate of preventable adult inpatient stays per 100,000 population by community-level income quartile. Data are provided in Supplemental Table 1. |
|
| Table 1. Rate of potentially preventable adult inpatient stays, by patient characteristics and hospital census region, 2017 | |||
| Patient or hospital characteristic | Rate per 100,000 population | ||
|---|---|---|---|
| All conditions | Chronic conditions | Acute conditions | |
| Overall | 1,328.4 | 1,023.0 | 305.4 |
| Age group, years | |||
| 18-44 | 328.8 | 253.1 | 75.7 |
| 45-64 | 1,261.0 | 1,060.1 | 200.9 |
| 65+ | 4,142.8 | 3,055.9 | 1,086.9 |
| Sex | |||
| Male | 1,369.0 | 1,111.7 | 257.3 |
| Female | 1,300.0 | 953.8 | 349.1 |
| Race/ethnicity | |||
| Asian/Pacific Islander | 580.9 | 439.2 | 141.8 |
| Black | 2,572.5 | 2,198.0 | 374.5 |
| Hispanic | 1,314.8 | 992.0 | 322.8 |
| White | 1,173.2 | 874.6 | 298.5 |
| Other | 4,910.5 | 3,718.9 | 1,191.6 |
| Location of patient's residence | |||
| Large central metropolitan | 1,373.4 | 1,094.4 | 279.0 |
| Large fringe metropolitan | 1,327.4 | 1,016.7 | 310.6 |
| Medium metropolitan | 1,193.6 | 930.4 | 263.3 |
| Small metropolitan | 1,223.1 | 948.0 | 275.1 |
| Micropolitan area | 1,427.8 | 1,061.5 | 366.3 |
| Noncore rural area | 1,596.2 | 1,107.0 | 489.2 |
| Hospital region | |||
| Northeast | 1,344.3 | 1,041.7 | 302.6 |
| Midwest | 1,397.5 | 1,072.0 | 325.6 |
| South | 1,520.3 | 1,168.5 | 351.8 |
| West | 927.8 | 716.3 | 211.4 |
| Notes: Rates are adjusted for age and sex. Consistent with the Agency for Healthcare Research and Quality Prevention Quality Indicators, obstetric stays are excluded. Source: Agency for Healthcare Research and Quality (AHRQ), Healthcare Cost and Utilization Project (HCUP), State Inpatient Databases (SID) from 36 States, 2017, weighted to provide national estimates; AHRQ Quality Indicators, version 2019.01 | |||
|
| Table 2. Total stays, aggregate costs, and mean cost per stay for potentially preventable adult inpatient stays, 2017 | |||
| Potentially preventable inpatient stays | Total stays, N | Aggregate costs, $ billions | Mean cost per stay, $ |
|---|---|---|---|
| All conditions | 3,530,900 | 33.685 | 9,500 |
| Chronic conditions | 2,720,800 | 27.261 | 10.000 |
| Heart failure | 1,112,600 | 11.240 | 10,100 |
| Chronic obstructive pulmonary disease | 825,800 | 7.273 | 8,800 |
| Diabetesa | 590,800 | 7.365 | 12,500 |
| Diabetes long-term complications | 281,200 | 4.304 | 15,300 |
| Diabetes short-term complications | 157,700 | 1.167 | 7,400 |
| Uncontrolled diabetes | 116,200 | 0.775 | 6,700 |
| Lower-extremity amputation among patients with diabetes | 78,200 | 2.110 | 27,000 |
| Hypertension | 160,600 | 1.194 | 7,400 |
| Asthma in younger adults | 31,300 | 0.195 | 6,200 |
| Acute conditions | 810,100 | 6.414 | 7,900 |
| Community-acquired pneumonia | 429,500 | 3.862 | 9,000 |
| Urinary tract infection | 380,600 | 2.550 | 6,700 |
| Notes: Number of stays and mean costs are rounded to the nearest hundred. Totals and costs for all conditions, chronic conditions (including the overall diabetes total), and acute conditions are based on Prevention Quality Indicator (PQI) composite measures. For these measures, an inpatient stay that meets the criteria for multiple components of the composite (i.e., multiple conditions) is counted only once. Consistent with the Agency for Healthcare Research and Quality PQIs, obstetric stays are excluded. a Unlike the other potentially preventable conditions, lower-extremity amputation among patients with diabetes was not identified by principal diagnosis. Thus, it was possible for an inpatient stay to meet the criteria for this condition and one of the other chronic or acute conditions. In most of these cases, the overlap was with another diabetes condition. Because of this overlap, totals and costs for individual diabetes conditions should not be summed to estimate the diabetes group total or aggregate costs. Source: Agency for Healthcare Research and Quality (AHRQ), Healthcare Cost and Utilization Project (HCUP), State Inpatient Databases (SID) from 36 States, 2017, weighted to provide national estimates; AHRQ Quality Indicators, version 2019.01 | |||
|
| Table 3. Total stays and aggregate costs of potentially preventable adult inpatient stays, by primary expected payer, 2017 | ||||||
| Primary expected payer | Total stays, N | Potentially preventable stays, % | All nonobstetric stays, % | Aggregate costs, $ billions | Aggregate costs for potentially preventable stays, % | Aggregate costs for all nonobstetric stays, % |
|---|---|---|---|---|---|---|
| Adult stays (age 18+ years) | 3,530,900 | 100.0 | 12.9 | 33.685 | 100.0 | 8.9 |
| Medicare | 2,310,000 | 65.4 | 15.4 | 22.201 | 65.9 | 10.7 |
| Medicaid | 498,000 | 14.1 | 12.3 | 4.912 | 14.6 | 8.9 |
| Private | 503,500 | 14.3 | 8.0 | 4.748 | 14.1 | 5.1 |
| Self-pay/No chargea | 153,700 | 4.4 | 12.2 | 1.222 | 3.6 | 8.9 |
| Other payers | 65,500 | 1.9 | 8.6 | 0.602 | 1.8 | 5.5 |
| Notes: Numbers of stays are rounded to the nearest hundred. Consistent with the AHRQ Prevention Quality Indicators, obstetric-related stays are excluded.
a Self-pay/No charge: includes self-pay, no charge, charity, and no expected payment. Source: Agency for Healthcare Research and Quality (AHRQ), Healthcare Cost and Utilization Project (HCUP), State Inpatient Databases (SID) from 36 States, 2017, weighted to provide national estimates; AHRQ Quality Indicators, version 2019.01 | ||||||
Table 4 presents the 2017 age-sex-adjusted population rate of potentially preventable inpatient stays among children for four conditions: asthma (ages 2-17 years), diabetes short-term complications (ages 6-17 years), gastroenteritis (ages 3 months-17 years), and urinary tract infection (ages 3 months-17 years). The age ranges included in the rates for each condition are consistent with the AHRQ PDI definitions. |
| Table 4. Rate of potentially preventable pediatric inpatient stays, by patient characteristics and hospital census region, 2017 | ||||
| Patient or hospital characteristic | Rate per 100,000 population | |||
|---|---|---|---|---|
| Asthma | Diabetes short-term complications | Gastroenteritis | Urinary tract infection | |
| Overall | 81.8 | 25.2 | 36.4 | 21.1 |
| Age group, yearsa | ||||
| 0-4 | 159.1 | n/a | 90.1 | 40.9 |
| 5-9 | 103.0 | 11.8 | 23.8 | 15.5 |
| 10-14 | 49.9 | 27.9 | 12.5 | 8.7 |
| 15-17 | 27.0 | 37.7 | 14.7 | 20.5 |
| Sex | ||||
| Male | 96.3 | 22.6 | 37.6 | 7.6 |
| Female | 66.6 | 27.8 | 35.1 | 35.3 |
| Race/ethnicity | ||||
| Asian/Pacific Islander | 45.9 | 6.6 | 22.9 | 11.5 |
| Black | 217.9 | 40.8 | 35.4 | 17.1 |
| Hispanic | 73.7 | 18.2 | 37.0 | 23.7 |
| White | 42.8 | 24.4 | 34.0 | 19.9 |
| Other | 379.5 | 87.2 | 186.9 | 102.4 |
| Community-level income | ||||
| Quartile 1 (lowest) | 136.5 | 34.1 | 44.4 | 29.0 |
| Quartile 2 | 70.9 | 25.3 | 34.6 | 21.3 |
| Quartile 3 | 63.2 | 23.7 | 34.1 | 18.4 |
| Quartile 4 (highest) | 51.7 | 17.5 | 31.1 | 14.8 |
| Location of patient's residence | ||||
| Large central metropolitan | 122.4 | 26.5 | 41.5 | 20.0 |
| Large fringe metropolitan | 71.8 | 23.3 | 37.8 | 20.3 |
| Medium metropolitan | 67.1 | 27.3 | 33.8 | 21.5 |
| Small metropolitan | 52.6 | 23.2 | 29.2 | 20.8 |
| Micropolitan area | 49.3 | 22.1 | 29.8 | 24.9 |
| Noncore rural area | 45.9 | 26.2 | 31.3 | 25.0 |
| Hospital region | ||||
| Northeast | 136.2 | 21.7 | 54.0 | 24.3 |
| Midwest | 74.6 | 27.7 | 33.9 | 21.0 |
| South | 73.8 | 27.4 | 34.0 | 22.5 |
| West | 65.0 | 21.7 | 30.8 | 17.0 |
| Abbreviation: n/a, not available Notes: Rates are adjusted for age and sex. Consistent with the Agency for Healthcare Research and Quality (AHRQ) Pediatric Quality Indicators (PDIs), obstetric stays are excluded. a Consistent with the AHRQ PDIs, the age range varies across conditions. Asthma rates include patients aged 2-17 years; diabetes short-term complication rates include patients aged 6-17 years, and both gastroenteritis and urinary tract infection rates include patients aged 3 months-17 years. Source: Agency for Healthcare Research and Quality (AHRQ), Healthcare Cost and Utilization Project (HCUP), State Inpatient Databases (SID) from 36 States, 2017, weighted to provide national estimates; AHRQ Quality Indicators, version 2019.01 | ||||
|
| Table 5. Total stays, aggregate costs, and mean cost per stay for potentially preventable pediatric inpatient stays, 2017 | |||
| Potentially preventable inpatient stays | Total stays, N | Aggregate costs, $ millions | Mean cost per stay, $ |
|---|---|---|---|
| All conditions | 108,300 | 561.6 | 5,200 |
| Chronic conditions | 66,500 | 355.6 | 5,400 |
| Asthma | 53,900 | 278.1 | 5,200 |
| Diabetes short-term complications | 12,500 | 77.5 | 6,200 |
| Acute conditions | 41,800 | 206.0 | 4,900 |
| Gastroenteritis | 26,500 | 129.3 | 4,900 |
| Urinary tract infection | 15,400 | 76.7 | 5,000 |
| Notes: Numbers of stays and mean costs are rounded to the nearest hundred. Number of stays and mean costs for all conditions, chronic conditions, and acute conditions are based on nonrounded totals. Consistent with PDIs, obstetric stays are excluded. To capture all potentially preventable stays, total counts and costs for chronic, acute, and all condition groups were computed as the sum of stays and costs for relevant individual conditions (instead of using the PDI composite measures, which are limited to patients aged 6-17 years). Source: Agency for Healthcare Research and Quality (AHRQ), Healthcare Cost and Utilization Project (HCUP), State Inpatient Databases (SID) from 36 States, 2017, weighted to provide national estimates; AHRQ Quality Indicators, version 2019.01 | |||
Healthcare Cost and Utilization Project (HCUP) Statistical Briefs provide basic descriptive statistics on a variety of topics using HCUP administrative healthcare data. Topics include hospital inpatient, ambulatory surgery, and emergency department use and costs, quality of care, access to care, medical conditions, procedures, and patient populations, among other topics. The reports are intended to generate hypotheses that can be further explored in other research; the reports are not designed to answer in-depth research questions using multivariate methods. Data Source The estimates in this Statistical Brief are based upon an analysis done for the National Healthcare Quality and Disparities Reports (QDR). For generating national Quality Indicator estimates, HCUP State Inpatient Databases (SID) were combined to create a nationally weighted analysis file because of variation in the availability of both race/ethnicity data and indicators of diagnoses being present on admission (POA), which are required for some of the AHRQ Quality Indicators. SID meeting the following inclusion criteria were included in the nationally weighted analysis file: (1) less than 10 percent of discharges failed edit checks on indicators of diagnoses being POA; (2) the SID included information on day of principal and secondary procedure; and (3) the SID included good reporting of race/ethnicity data. After hospitals and discharges that failed POA and race/ethnicity edits were excluded, the remaining discharges were weighted to represent all stays in the universe of community hospitals in the United States, excluding rehabilitation and long-term acute care facilities. In data year 2017, the nationally weighted analysis file includes data from 36 SID and 30,744,878 discharges (weighted, this represents 36,962,410 discharges). The District of Columbia and the following 35 States were included: Alaska, Arizona, Arkansas, California, Colorado, Florida, Georgia, Hawaii, Illinois, Indiana, Kansas, Kentucky, Louisiana, Maine, Maryland, Massachusetts, Michigan, Minnesota, Mississippi, Missouri, Montana, Nevada, New Jersey, New Mexico, New York, North Carolina, Ohio, Oregon, Pennsylvania, Rhode Island, South Carolina, Tennessee, Texas, Virginia, and Washington. Definitions Major diagnostic categories (MDCs) MDCs assign ICD-10-CM principal diagnosis codes to 1 of 25 general diagnosis categories. For this analysis, MDC 14 (Pregnancy, Childbirth, and Puerperium) was used to identify and exclude obstetric inpatient stays from the total nonobstetric stay counts and costs reported in Table 3. Prevention Quality Indicators and Pediatric Quality Indicators The Prevention Quality Indicators (PQIs) and Pediatric Quality Indicators (PDIs, formerly known as PedQIs) are components of the AHRQ Quality Indicators (QIs). The QIs are a set of algorithms that may be applied to hospital administrative data to quantify quality issues among inpatient populations. PQIs assess hospital admissions for 10 ambulatory care-sensitive conditions (ACSCs), that evidence suggests may be avoided, in part, through high-quality ambulatory care. These conditions are identified by principal diagnosis except for lower-extremity amputation among patients with diabetes. PQIs are adjusted for age and sex. Version 2019.01 of the PQI software also includes four composite measures assessing potentially avoidable hospitalizations overall and separately for chronic conditions, diabetes-specific conditions, and acute conditions. PDIs focus on potentially preventable complications and iatrogenic events for pediatric patients treated in hospitals and on preventable hospitalizations among pediatric patients. This analysis focuses on the four area-level PDIs, which like the PQIs are measures of potentially avoidable hospitalizations for ACSCs. All of these conditions are identified by principal diagnosis. Although these measures rely on hospital discharge data, they are intended to reflect issues of access to, and quality of, ambulatory care in a given geographic area. PDIs are adjusted for age and sex. Version 2019.01 of the PQI software also includes three composite measures assessing hospitalizations overall and for chronic and acute conditions. Although the age ranges included in the denominator populations vary across the four area-level PDIs (2-17 years for asthma; 6-17 years for diabetes short-term complications, and 3 months-17 years for both gastroenteritis and urinary tract infection), the PDI composites use a common age range (6 years to 17 years) for the denominator populations. Diverging from this approach, the chronic condition, acute condition, and all condition group totals reported in Table 5 of this Statistical Brief were computed as the sum of total stays or costs for individual conditions. These estimates are not limited to children aged 6 years or older. Obstetric discharges are excluded from the potentially preventable discharges, defined by PQIs and PDIs, that are reported in this Statistical Brief. For all but one of the PQIs and PDIs, the AHRQ QI software identifies the ACSC using the principal diagnosis, thereby excluding obstetric discharges, which also are identified based on principal diagnosis. For lower-extremity amputation among patients with diabetes, the AHRQ QI software uses all-listed diagnoses to identify the ACSC; in this case, obstetric cases, as identified by principal diagnosis, are explicitly excluded. Further information on the AHRQ QIs, including documentation and free software downloads, is available at www.qualityindicators.ahrq.gov/. Additional information on how the QI software was applied to the HCUP data for the statistics reported in this Statistical Brief is available in Barrett et al., 2017.8 Types of hospitals included in HCUP State Inpatient Databases This analysis used State Inpatient Databases (SID) limited to data from community hospitals, which are defined as short-term, non-Federal, general, and other hospitals, excluding hospital units of other institutions (e.g., prisons). Community hospitals include obstetrics and gynecology, otolaryngology, orthopedic, cancer, pediatric, public, and academic medical center hospitals. Excluded for this analysis are long-term care facilities such as rehabilitation, psychiatric, and alcoholism and chemical dependency hospitals. However, if a patient received long-term care, rehabilitation, or treatment for a psychiatric or chemical dependency condition in a community hospital, the discharge record for that stay was included in the analysis. Unit of analysis The unit of analysis is the hospital discharge (i.e., the hospital stay), not a person or patient. This means that a person who is admitted to the hospital multiple times in 1 year will be counted each time as a separate discharge from the hospital. Costs and charges Total hospital charges were converted to costs using HCUP Cost-to-Charge Ratios based on hospital accounting reports from the Centers for Medicare & Medicaid Services (CMS).9 Costs reflect the actual expenses incurred in the production of hospital services, such as wages, supplies, and utility costs; charges represent the amount a hospital billed for the case. For each hospital, a hospital-wide cost-to-charge ratio is used. Hospital charges reflect the amount the hospital billed for the entire hospital stay and do not include professional (physician) fees. For the purposes of this Statistical Brief, costs are reported to the nearest hundred. How HCUP estimates of costs differ from National Health Expenditure Accounts There are a number of differences between the costs cited in this Statistical Brief and spending as measured in the National Health Expenditure Accounts (NHEA), which are produced annually by CMS.10 The largest source of difference comes from the HCUP coverage of inpatient treatment only in contrast to the NHEA inclusion of outpatient costs associated with emergency departments and other hospital-based outpatient clinics and departments as well. The outpatient portion of hospitals' activities has been growing steadily and may exceed half of all hospital revenue in recent years. On the basis of the American Hospital Association Annual Survey, 2017 outpatient gross revenues (or charges) were about 49 percent of total hospital gross revenues.11 Smaller sources of differences come from the inclusion in the NHEA of hospitals that are excluded from HCUP. These include Federal hospitals (Department of Defense, Veterans Administration, Indian Health Services, and Department of Justice [prison] hospitals) as well as psychiatric, substance abuse, and long-term care hospitals. A third source of difference lies in the HCUP reliance on billed charges from hospitals to payers, adjusted to provide estimates of costs using hospital-wide cost-to-charge ratios, in contrast to the NHEA measurement of spending or revenue. HCUP costs estimate the amount of money required to produce hospital services, including expenses for wages, salaries, and benefits paid to staff as well as utilities, maintenance, and other similar expenses required to run a hospital. NHEA spending or revenue measures the amount of income received by the hospital for treatment and other services provided, including payments by insurers, patients, or government programs. The difference between revenues and costs includes profit for for-profit hospitals or surpluses for nonprofit hospitals. Location of patients' residence Place of residence is based on the urban-rural classification scheme for U.S. counties developed by the National Center for Health Statistics (NCHS) and based on the Office of Management and Budget (OMB) definition of a metropolitan service area as including a city and a population of at least 50,000 residents:
Community-level income is based on the median household income of the patient's ZIP Code of residence. Quartiles are defined so that the total U.S. population is evenly distributed. Cut-offs for the quartiles are determined annually using ZIP Code demographic data obtained from Claritas, a vendor that produces population estimates and projections based on data from the U.S. Census Bureau.12 The value ranges for the income quartiles vary by year. The income quartile is missing for patients who are homeless or foreign. Expected payer To make coding uniform across all HCUP data sources, the primary expected payer for the hospital stay combines detailed categories into general groups:
For this Statistical Brief, when more than one payer is listed for a hospital discharge, the first-listed payer is used. Region Region is one of the four regions defined by the U.S. Census Bureau:
Data on Hispanic ethnicity are collected differently among the States and also can differ from the census methodology of collecting information on race (White, Black, Asian/Pacific Islander, American Indian/Alaska Native, Other [including mixed race]) separately from ethnicity (Hispanic, non-Hispanic). State data organizations often collect Hispanic ethnicity as one of several categories that include race. Therefore, for multistate analyses, HCUP creates the combined categorization of race and ethnicity for data from States that report ethnicity separately. When a State data organization collects Hispanic ethnicity separately from race, HCUP uses Hispanic ethnicity to override any other race category to create a Hispanic category for the uniformly coded race/ethnicity data element, while also retaining the original race and ethnicity data. This Statistical Brief reports race/ethnicity for the following categories: Hispanic, non-Hispanic White, non-Hispanic Black, Asian/Pacific Islander, and non-Hispanic Other. About HCUP The Healthcare Cost and Utilization Project (HCUP, pronounced "H-Cup") is a family of healthcare databases and related software tools and products developed through a Federal-State-Industry partnership and sponsored by the Agency for Healthcare Research and Quality (AHRQ). HCUP databases bring together the data collection efforts of State data organizations, hospital associations, and private data organizations (HCUP Partners) and the Federal government to create a national information resource of encounter-level healthcare data. HCUP includes the largest collection of longitudinal hospital care data in the United States, with all-payer, encounter-level information beginning in 1988. These databases enable research on a broad range of health policy issues, including cost and quality of health services, medical practice patterns, access to healthcare programs, and outcomes of treatments at the national, State, and local market levels. HCUP would not be possible without the contributions of the following data collection Partners from across the United States: Alaska Department of Health and Social Services Alaska State Hospital and Nursing Home Association Arizona Department of Health Services Arkansas Department of Health California Office of Statewide Health Planning and Development Colorado Hospital Association Connecticut Hospital Association Delaware Division of Public Health District of Columbia Hospital Association Florida Agency for Health Care Administration Georgia Hospital Association University of Hawaii, Hilo, Center for Rural Health Science Hawaii Laulima Data Alliance Illinois Department of Public Health Indiana Hospital Association Iowa Hospital Association Kansas Hospital Association Kentucky Cabinet for Health and Family Services Louisiana Department of Health Maine Health Data Organization Maryland Health Services Cost Review Commission Massachusetts Center for Health Information and Analysis Michigan Health & Hospital Association Minnesota Hospital Association Mississippi State Department of Health Missouri Hospital Industry Data Institute Montana Hospital Association Nebraska Hospital Association Nevada Department of Health and Human Services New Hampshire Department of Health & Human Services New Jersey Department of Health New Mexico Department of Health New York State Department of Health North Carolina Department of Health and Human Services North Dakota (data provided by the Minnesota Hospital Association) Ohio Hospital Association Oklahoma State Department of Health Oregon Association of Hospitals and Health Systems Oregon Office of Health Analytics Pennsylvania Health Care Cost Containment Council Rhode Island Department of Health South Carolina Revenue and Fiscal Affairs Office South Dakota Association of Healthcare Organizations Tennessee Hospital Association Texas Department of State Health Services Utah Department of Health Vermont Association of Hospitals and Health Systems Virginia Health Information Washington State Department of Health West Virginia Department of Health and Human Resources, West Virginia Health Care Authority Wisconsin Department of Health Services Wyoming Hospital Association About the SID The HCUP State Inpatient Databases (SID) are hospital inpatient databases from data organizations participating in HCUP. The SID contain the universe of the inpatient discharge abstracts in the participating HCUP States, translated into a uniform format to facilitate multistate comparisons and analyses. Together, the SID encompass more than 95 percent of all U.S. community hospital discharges. The SID can be used to investigate questions unique to one State, to compare data from two or more States, to conduct market-area variation analyses, and to identify State-specific trends in inpatient care utilization, access, charges, and outcomes. About the QDR The National Healthcare Quality and Disparities Report (QDR) measures and tracks trends in quality and disparities in seven key areas of healthcare: patient safety, person-centered care, care coordination, effective treatment, healthy living, care affordability, and access to healthcare. The QDR is an annual report that was commissioned by Congress in 1999 and first published in 2003. Beginning with the 2014 report, findings that previously appeared in two separate reports (the National Healthcare Quality Report and the National Healthcare Disparities Report) have been integrated into a single document that provides a comprehensive overview of the quality of healthcare received by the general population and disparities in care experienced by different racial, ethnic, and socioeconomic groups. Information on individual measures will be available through chartbooks, which will be posted monthly. The QDR is designed and produced by AHRQ, with support from the Department of Health and Human Services (HHS) and private sector partners. For More Information For other information on preventable hospitalizations, refer to the HCUP Statistical Briefs located at www.hcup-us.ahrq.gov/reports/statbriefs/sb_preventable.jsp. For additional HCUP statistics, visit:
For a detailed description of HCUP and more information on the design of the State Inpatient Databases (SID), please refer to the following database documentation: Agency for Healthcare Research and Quality. Overview of the State Inpatient Databases (SID). Healthcare Cost and Utilization Project (HCUP). Rockville, MD: Agency for Healthcare Research and Quality. Updated November 2019. www.hcup-us.ahrq.gov/sidoverview.jsp. Accessed February 3, 2020. Suggested Citation McDermott KW (IBM Watson Health), Jiang HJ (AHRQ). Characteristics and Costs of Potentially Preventable Inpatient Stays, 2017. HCUP Statistical Brief #259. June 2020. Agency for Healthcare Research and Quality, Rockville, MD. www.hcup-us.ahrq.gov/reports/statbriefs/sb259-Potentially-Preventable-Hospitalizations-2017.pdf. Acknowledgments The authors would like to acknowledge the contributions of Marguerite Barrett of M.L. Barrett, Inc. and Tim Kenney of Kenney IS Consulting, Inc. *** AHRQ welcomes questions and comments from readers of this publication who are interested in obtaining more information about access, cost, use, financing, and quality of healthcare in the United States. We also invite you to tell us how you are using this Statistical Brief and other HCUP data and tools, and to share suggestions on how HCUP products might be enhanced to further meet your needs. Please e-mail us at hcup@ahrq.gov or send a letter to the address below:Joel W. Cohen, Ph.D., Director Center for Financing, Access and Cost Trends Agency for Healthcare Research and Quality 5600 Fishers Lane Rockville, MD 20857 This Statistical Brief was posted online on June 16, 2020. 1 Centers for Medicare & Medicaid Services. NHE Fact Sheet. Updated December 5, 2019. www.cms.gov/Research-Statistics-Data-and-Systems/Statistics-Trends-and-Reports/NationalHealthExpendData/NHE-Fact-Sheet. Accessed March 1, 2020. 2 Brennan N, Engelhardt T. Data Brief: Sharp Reduction in Avoidable Hospitalizations Among Long-Term Care Facility Residents. CMS.gov Blog. January 17, 2017. Centers for Medicare & Medicaid Services. www.cms.gov/blog/data-brief-sharp-reduction-avoidable-hospitalizations-among-long-term-care-facility-residents. Accessed March 2, 2020. Original source is no longer available on the Web. For related information refer to: Centers for Medicare & Medicaid Services. CMS Initiative to Reduce Avoidable Hospitalizations among Nursing Facility Residents-Payment Model. Fact Sheet. August 27, 2015. www.cms.gov/newsroom/fact-sheets/cms-initiative-reduce-avoidable-hospitalizations-among-nursing-facility-residents-payment-model. Accessed October 27, 2021. 3 Agency for Healthcare Research and Quality. AHRQ Quality Indicators: Prevention Quality Indicators Overview. www.qualityindicators.ahrq.gov/modules/pqi_resources.aspx#techspecs.. Accessed October 27, 2021. 4 Agency for Healthcare Research and Quality. Prevention Quality Indicators Overview. www.qualityindicators.ahrq.gov/Modules/pqi_resources.aspx. Accessed May 5, 2020. 5 Agency for Healthcare Research and Quality. Pediatric Quality Indicators Overview. www.qualityindicators.ahrq.gov/Modules/pdi_resources.aspx. Accessed May 5, 2020. 6 Diabetes-related conditions include diabetes short-term complications, diabetes long-term complications, lower-extremity amputation among patients with diabetes, and uncontrolled diabetes. 7 Although all other adult PQI conditions were defined using principal diagnosis, lower-extremity amputation among patients with diabetes (a chronic condition) was defined using all-listed diagnoses. As such, it was possible for a single visit to be included in both the chronic condition and acute condition totals. This was extremely rare (i.e., fewer than 30 cases) and, as such, did not affect the rounded totals or percentages presented. 8 Barrett M, Coffey R, Houchens R, Heslin K, Moles E, Coenen N. Methods Applying AHRQ Quality Indicators to Healthcare Cost and Utilization Project (HCUP) Data for the 2017 National Healthcare Quality and Disparities Report (QDR). HCUP Methods Series Report #2018-01. May 11, 2018. U.S. Agency for Healthcare Research and Quality. https://www.hcup-us.ahrq.gov/reports/methods/2018-01.pdf. Accessed February 3, 2020. 9 Agency for Healthcare Research and Quality. HCUP Cost-to-Charge Ratio (CCR) Files. Healthcare Cost and Utilization Project (HCUP). 2001-2017. Agency for Healthcare Research and Quality. Updated December 2019. www.hcup-us.ahrq.gov/db/state/costtocharge.jsp. Accessed February 3, 2020. 10 For additional information about the NHEA, see Centers for Medicare & Medicaid Services (CMS). National Health Expenditure Data. CMS website. Updated December 17, 2019. www.cms.gov/Research-Statistics-Data-and-Systems/Statistics-Trends-and-Reports/NationalHealthExpendData/index.html?redirect=/NationalHealthExpendData/. Accessed February 3, 2020. 11 American Hospital Association. TrendWatch Chartbook, 2019. Table 4.2. Distribution of Inpatient vs. Outpatient Revenues, 1995-2017. www.aha.org/system/files/media/file/2019/11/TrendwatchChartbook-2019-Appendices.pdf. 12 Claritas. Claritas Demographic Profile by ZIP Code. https://claritas360.claritas.com/mybestsegments/. |
| Supplemental Table 1. Rate of potentially preventable adult inpatient stays, by community-level income, 2017, for data presented in Figure 2 | |||
| Community-level income quartile | Rate per 100,000 population | ||
|---|---|---|---|
| All conditions | Chronic conditions | Acute conditions | |
| Quartile 1 (lowest) | 2,012.8 | 1,596.7 | 416.2 |
| Quartile 2 | 1,375.9 | 1,056.2 | 319.7 |
| Quartile 3 | 1,088.6 | 831.5 | 257.1 |
| Quartile 4 (highest) | 877.8 | 645.3 | 232.6 |