|
STATISTICAL BRIEF #262
August 2020
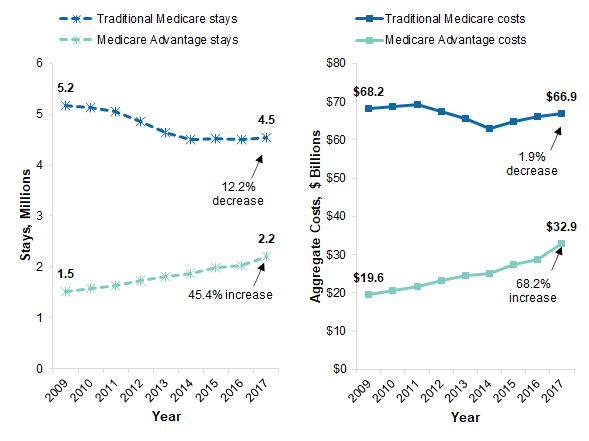
Brian J. Moore, Ph.D., and Lan Liang, Ph.D. Introduction Most individuals eligible for Medicare coverage administered through the Centers for Medicare & Medicaid Services (CMS), a U.S. Federal agency, have the option to receive their benefits by enrolling in either the traditional Medicare program or Medicare Advantage. Through the traditional Medicare program, CMS reimburses healthcare providers directly for the services delivered to beneficiaries. Alternatively, CMS contracts with private health plans to provide coverage to enrollees through the Medicare Advantage program. The private plan receives a set payment per beneficiary from CMS for all Medicare-covered services, adjusted for the health status of its Medicare enrollees. The proportion of Medicare beneficiaries enrolled in Medicare Advantage plans has increased over the past 15 years, from 13 percent of Medicare beneficiaries in 2004 to 34 percent in 2019.1 The Medicare Advantage enrollment rate varies by State. In 2019, in 14 States plus the District of Columbia less than 21 percent of Medicare beneficiaries were enrolled in the Medicare Advantage program, whereas in 6 States more than 40 percent were enrolled in Medicare Advantage.1 There are a number of differences in the two types of Medicare programs beyond payments to providers, and researchers have focused on a number of different areas for evaluation.2,3 However, policymakers and researchers have ongoing interest in the differences in costs and patient outcomes between Medicare Advantage and traditional Medicare enrollees.4,5 This Healthcare Cost and Utilization Project (HCUP) Statistical Brief presents statistics on the costs of hospital inpatient stays among patients aged 65 years and older with a primary expected payer of Medicare Advantage versus traditional Medicare using the 2009-2017 State Inpatient Databases (SID). Data are limited to 18 States that distinguish between Medicare Advantage plans and traditional Medicare in their expected payment source information (See Data Source for a list of the states included). Aggregate costs, average cost, and number of stays are presented separately for Medicare Advantage and traditional Medicare. Hospital charges were converted to costs using HCUP Cost-to-Charge Ratios.6 In addition, aggregate costs are presented by age and location of patient residence; and number of stays, average cost, and length of stay are presented by clinical condition. Because of the large sample size of the SID data, small differences can be statistically significant. Thus, only differences greater than or equal to 10 percent are discussed in the text. Findings Trends in costs and stays for Medicare Advantage and traditional Medicare, 2009-2017 Figure 1 presents trends in the number of stays and aggregate hospital costs for inpatient stays with a primary expected payer of either Medicare Advantage or traditional Medicare from 2009 to 2017 in select States.a |
|
Figure 1. Number of hospital inpatient stays and aggregate costs by type of Medicare program in 18 States, 2009-2017
Notes: Hospital charges were converted to costs using HCUP Cost-to-Charge Ratios. See Costs and Charges in the Definitions section for additional information. Costs were inflation adjusted using the Gross Domestic Product Price Index with 2017 as the index year. Patients aged less than 65 years were excluded from the analysis. Percent change was calculated using unrounded numbers. Figure 1 consists of two line graphs that show the number of inpatient stays paid by traditional Medicare and by Medicare Advantage and traditional Medicare and Medicare Advantage aggregate costs for 18 States from 2009 to 2017. Data are provided in Supplemental Tables 1a and 1b. |
|
|
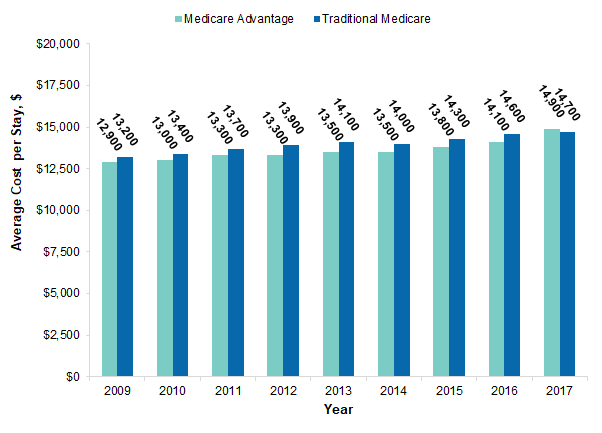
Figure 2. Average cost per inpatient stay by type of Medicare program in 18 States, 2009-2017
Notes: Costs were inflation adjusted using the Gross Domestic Product Price Index with 2017 as the index year. Patients aged less than 65 years were excluded from the analysis. Figure 2 is a bar chart that shows the average cost per inpatient stay for traditional Medicare and Medicare Advantage from 2009 to 2017. Data are provided in Supplemental Table 2. |
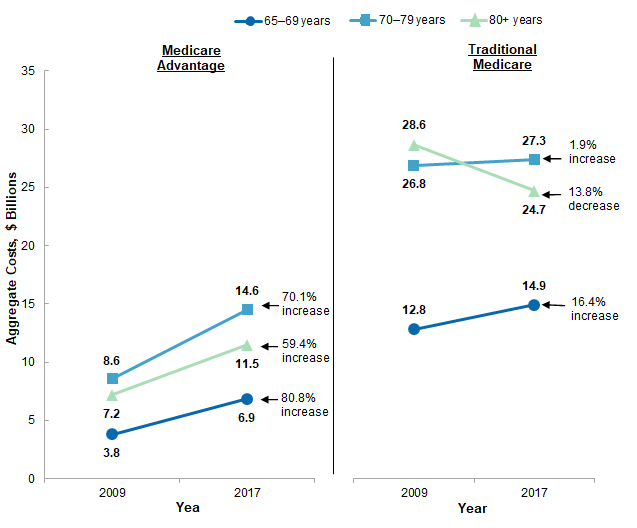
Figure 3 presents inflation-adjusted aggregate costs for inpatient stays with an expected payer of either Medicare Advantage or traditional Medicare by age group in 2009 and 2017. |
|
Figure 3. Aggregate costs of Medicare Advantage and traditional Medicare inpatient stays by age group in 18 States, 2009 and 2017
Notes: Costs were inflation adjusted using the Gross Domestic Product Price Index with 2017 as the index year. Patients aged less than 65 years were excluded from the analysis. Percent change was calculated using unrounded numbers. Figure 3 consists of two line graphs showing aggregate costs for Medicare Advantage and traditional Medicare inpatient stays by age group for 18 States in 2009 and 2017. Data are provided in Supplemental Table 3. |
|
|
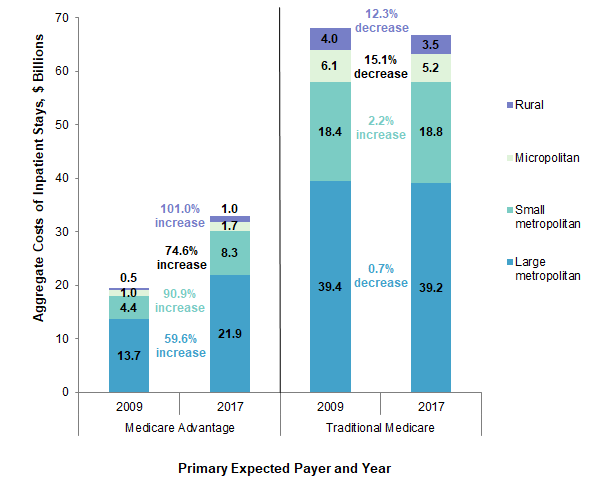
Figure 4. Aggregate costs of Medicare Advantage and traditional Medicare inpatient stays by location of patient residence in 18 States, 2009 and 2017
Notes: Costs were inflation adjusted using the Gross Domestic Product Price Index with 2017 as the index year. Patients aged less than 65 years were excluded from the analysis. Stays with missing location of patient residence are not presented; missing values represented no more than 0.3 percent of stays for any year and payer. Percent change was calculated using unrounded numbers. Figure 4 consists of two bar charts that show aggregate costs of inpatient stays for Medicare Advantage and traditional Medicare by location of patient residence in 18 States in 2009 and 2017. Data are provided in Supplemental Table 4. |
Table 1 presents the number of inpatient stays, the average cost per stay, and the average length of stay for the 20 clinical conditions most frequently listed as the principal diagnosis during hospital stays with a primary expected payer of Medicare in 2017 in the 18 States examined. The statistics are presented separately for Medicare Advantage and traditional Medicare, but clinical conditions are ranked based on the total number of stays for Medicare Advantage and traditional Medicare combined. |
| Table 1. Number of stays, average cost, and length of stay for Medicare Advantage and traditional Medicare by clinical condition, 2017 | ||||||
| Clinical condition | Medicare Advantage | Traditional Medicare | ||||
|---|---|---|---|---|---|---|
| Inpatient stays, N | Average cost per stay, $ | Length of stay, days | Inpatient stays, N | Average cost per stay, $ | Length of stay, days | |
| All stays | 2,212,500 | 14,900 | 5.2 | 4,544,400 | 14,700 | 5.3 |
| Septicemia | 199,700 | 18,800 | 7.0 | 409,300 | 18,400 | 7.2 |
| Heart failure | 140,100 | 11,800 | 5.3 | 272,700 | 11,700 | 5.3 |
| Osteoarthritis | 123,300 | 15,100 | 2.1 | 233,000 | 16,000 | 2.3 |
| Chronic obstructive pulmonary disease and bronchiectasis | 81,500 | 9,400 | 4.6 | 166,800 | 9,700 | 4.7 |
| Cardiac dysrhythmias | 73,000 | 11,400 | 3.7 | 147,000 | 11,500 | 3.6 |
| Acute myocardial infarction | 70,700 | 21,400 | 4.9 | 121,200 | 21,000 | 4.9 |
| Acute and unspecified renal failure | 58,700 | 10,200 | 5.3 | 121,000 | 9,900 | 5.1 |
| Pneumonia (except that caused by tuberculosis) | 54,300 | 10,400 | 4.9 | 124,000 | 10,600 | 5.0 |
| Urinary tract infections | 50,100 | 7,700 | 4.3 | 126,000 | 7,700 | 4.2 |
| Cerebral infarction | 62,400 | 14,600 | 5.0 | 111,300 | 14,000 | 4.7 |
| Respiratory failure; insufficiency; arrest | 49,500 | 18,400 | 7.2 | 101,100 | 20,300 | 8.2 |
| Fracture of the neck of the femur (hip), initial encounter | 47,500 | 17,700 | 5.3 | 94,200 | 17,300 | 5.2 |
| Gastrointestinal hemorrhage | 38,600 | 11,300 | 4.5 | 79,300 | 11,000 | 4.4 |
| Spondylopathies/spondyloarthropathy (including infective) | 35,800 | 22,200 | 3.9 | 76,200 | 22,400 | 3.7 |
| Coronary atherosclerosis and other heart disease | 38,300 | 24,400 | 4.8 | 68,100 | 23,600 | 4.6 |
| Diabetes mellitus with complication | 35,100 | 13,900 | 5.9 | 63,200 | 14,000 | 5.9 |
| Skin and subcutaneous tissue infections | 29,800 | 7,900 | 4.6 | 66,700 | 8,200 | 4.7 |
| Fluid and electrolyte disorders | 26,900 | 7,800 | 3.9 | 63,800 | 7,700 | 3.7 |
| Intestinal obstruction and ileus | 30,300 | 13,000 | 5.8 | 59,300 | 12,400 | 5.6 |
| Diverticulosis and diverticulitis | 26,900 | 11,800 | 4.8 | 51,900 | 11,400 | 4.7 |
| Abbreviation: ICD-10-CM, International Classification of Diseases, Tenth Revision, Clinical Modification Notes: Patients aged less than 65 years were excluded from the analysis. Clinical conditions were assigned using the Clinical Classifications Software Refined (CCSR) for ICD-10-CM Diagnoses default categorizations for principal diagnoses. Conditions were ranked by number of stays with Medicare as the expected payer (i.e., Medicare Advantage + traditional Medicare). Source: Agency for Healthcare Research and Quality (AHRQ), Healthcare Cost and Utilization Project (HCUP), State Inpatient Databases (SID), 2017, from 18 States | ||||||
References 1 Kaiser Family Foundation. Medicare Advantage. Fact sheet. June 6, 2019. www.kff.org/medicare/fact-sheet/medicare-advantage/. 2 Neuman P, Jacobson GA. Medicare Advantage checkup. New England Journal of Medicine. 2018;379(22):2163-72 3 Newhouse JP, McGuire TG. How successful is Medicare Advantage? The Millbank Quarterly. 2014;92(2):351-94. 4 Henke RM, Karaca Z, Gibson TB, Cutler E, Barrett MB, Levit K, et al. Medicare Advantage and traditional Medicare hospitalization intensity and readmissions. Medical Care Research and Review. 2018;75(4):434-53. 5 Newhouse JP, Price M, McWilliams JM, Hsu J, Souza J, Landon BE. Adjusted mortality rates are lower for Medicare Advantage than traditional Medicare, but the rates converge over time. Health Affairs (Millwood). 2019;38(4):554-60. 6 Agency for Healthcare Research and Quality. HCUP Cost-to-Charge Ratio (CCR) Files. Healthcare Cost and Utilization Project (HCUP). 2001-2017. Agency for Healthcare Research and Quality. Updated December 2019. www.hcup-us.ahrq.gov/db/state/costtocharge.jsp. Accessed February 3, 2020. About Statistical Briefs Healthcare Cost and Utilization Project (HCUP) Statistical Briefs provide basic descriptive statistics on a variety of topics using HCUP administrative healthcare data. Topics include hospital inpatient, ambulatory surgery, and emergency department use and costs, quality of care, access to care, medical conditions, procedures, and patient populations, among other topics. The reports are intended to generate hypotheses that can be further explored in other research; the reports are not designed to answer in-depth research questions using multivariate methods. Data Source The estimates in this Statistical Brief are based upon data from the HCUP 2017 State Inpatient Databases (SID) from 18 States. Historical data were drawn from the 2009-2016 SID. The 18 States included in this analysis are California, Connecticut, Florida, Georgia, Iowa, Kentucky, Massachusetts, Maryland, Michigan, Nevada, New Jersey, New York, Ohio, Oregon, Pennsylvania, Rhode Island, Tennessee, and Wisconsin. All 18 States were used in all years of analysis from 2009 to 2017. For this report, the inclusion of States was based on three criteria:
Definitions Diagnoses, ICD-10-CM, Clinical Classifications Software Refined (CCSR) for ICD-10-CM Diagnoses The principal diagnosis is that condition established after study to be chiefly responsible for the patient's admission to the hospital. Secondary diagnoses are concomitant conditions that coexist at the time of admission or develop during the stay. All-listed diagnoses include the principal diagnosis plus these additional secondary conditions. ICD-10-CM is the International Classification of Diseases, Tenth Revision, Clinical Modification. In October 2015, ICD-10-CM replaced the International Classification of Diseases, Ninth Revision, Clinical Modification (ICD-9-CM) diagnosis coding system for most inpatient and outpatient medical encounters. There are over 70,000 ICD-10-CM diagnosis codes. The CCSR aggregates ICD-10-CM diagnosis codes into a manageable number of clinically meaningful categories.b The CCSR is intended to be used analytically to examine patterns of healthcare in terms of cost, utilization and outcomes, rank utilization by diagnoses, and risk-adjust by clinical condition. The CCSR capitalizes on the specificity of the ICD-10-CM coding scheme and allows ICD-10-CM codes to be classified in more than one category. Approximately 10 percent of diagnosis codes are associated with more than one CCSR category because the diagnosis code documents either multiple conditions or a condition along with a common symptom or manifestation. For this Statistical Brief, the principal diagnosis code is assigned to a single default CCSR based on clinical coding guidelines, etiology and pathology of diseases, and standards set by other Federal agencies. The assignment of the default CCSR for the principal diagnosis is available starting with version v2020.2 of the software tool. ICD-10-CM coding definitions for each CCSR category presented in this Statistical Brief can be found in the CCSR reference file, available at www.hcup-us.ahrq.gov/toolssoftware/ccsr/ccs_refined.jsp#download. Case definition For this Statistical Brief, hospital stays were limited to those individuals aged 65 years and older with a primary expected payer of Medicare. Discharges were identified as Medicare Advantage (i.e., managed care Medicare) or traditional Medicare (i.e., fee-for-service) based on the primary expected payer as received from the State data source. The coding of managed care in HCUP data varies by State. Discharges with primary expected payer descriptions of Medicare HMO, Medicare PPO, Medicare POS, or Medicare managed care, were categorized as Medicare Advantage. All other Medicare discharges were categorized as traditional Medicare. When more than one expected payer was listed for a hospital discharge, the first-listed payer was used.c Types of hospitals included in HCUP State Inpatient Databases This analysis used State Inpatient Databases (SID) limited to data from community hospitals, which are defined as short-term, non-Federal, general, and other hospitals, excluding hospital units of other institutions (e.g., prisons). Community hospitals include obstetrics and gynecology, otolaryngology, orthopedic, cancer, pediatric, public, and academic medical center hospitals. Excluded for this analysis are long-term care facilities such as rehabilitation, psychiatric, and alcoholism and chemical dependency hospitals. However, if a patient received long-term care, rehabilitation, or treatment for a psychiatric or chemical dependency condition in a community hospital, the discharge record for that stay was included in the analysis. Unit of analysis The unit of analysis is the hospital discharge (i.e., the hospital stay), not a person or patient. This means that a person who is admitted to the hospital multiple times in 1 year will be counted each time as a separate discharge from the hospital. Percent Change Percent change between groups were calculated using the following formula: Percent change equals Group 1 value minus Group 2 value divided into Group 2value times 100. Costs and charges Total hospital charges were converted to costs using HCUP Cost-to-Charge Ratios based on hospital accounting reports from CMS.d Costs reflect the actual expenses incurred in the production of hospital services, such as wages, supplies, and utility costs; charges represent the amount a hospital billed for the case. For each hospital, a hospital-wide cost-to-charge ratio is used. Hospital charges reflect the amount the hospital billed for the entire hospital stay and do not include separately billed professional (physician) fees. Total charges were not available on all records. For this Statistical Brief, aggregate costs were estimated as the product of number of stays and average cost in each reporting category. Costs are reported to the nearest hundred dollars. Annual costs were inflation adjusted using the Gross Domestic Product (GDP) Price Index from the U.S. Department of Commerce, Bureau of Economic Analysis (BEA), with 2017 as the index base.e That is, all costs are expressed in 2017 dollars. Average cost per stay could not be calculated on all records because of missing values for total charges. Stays from California with an expected payer of Medicare Advantage were missing total charges on 36.5-41.6 percent of records from 2009 to 2017, but only 0.1 percent were missing total charges in 2017. Fewer than 2 percent of traditional Medicare stays in California had missing charges in each year. If a stay was missing total charges, average cost was imputed using the average cost for other stays with the same Medicare payer type in that State and year. How HCUP estimates of costs differ from National Health Expenditure Accounts There are a number of differences between the costs cited in this Statistical Brief and spending as measured in the National Health Expenditure Accounts (NHEA), which are produced annually by CMS.f The largest source of difference comes from the HCUP coverage of inpatient treatment only in contrast to the NHEA inclusion of outpatient costs associated with emergency departments and other hospital-based outpatient clinics and departments as well. The outpatient portion of hospitals' activities has been growing steadily and may exceed half of all hospital revenue in recent years. On the basis of the American Hospital Association Annual Survey, 2017 outpatient gross revenues (or charges) were about 49 percent of total hospital gross revenues.g Smaller sources of differences come from the inclusion in the NHEA of hospitals that are excluded from HCUP. These include Federal hospitals (Department of Defense, Veterans Administration, Indian Health Services, and Department of Justice [prison] hospitals) as well as psychiatric, substance abuse, and long-term care hospitals. A third source of difference lies in the HCUP reliance on billed charges from hospitals to payers, adjusted to provide estimates of costs using hospital-wide cost-to-charge ratios, in contrast to the NHEA measurement of spending or revenue. HCUP costs estimate the amount of money required to produce hospital services, including expenses for wages, salaries, and benefits paid to staff as well as utilities, maintenance, and other similar expenses required to run a hospital. NHEA spending or revenue measures the amount of income received by the hospital for treatment and other services provided, including payments by insurers, patients, or government programs. The difference between revenues and costs include profit for for-profit hospitals or surpluses for nonprofit hospitals. Expected payer To make coding uniform across all HCUP data sources, the primary expected payer for the hospital stay combines detailed categories into general groups:
Place of residence is based on a simplified adaptation of the Urban Influence Codes (UIC) developed by the United States Department of Agriculture (USDA) Economic Research Service (ERS). Starting with 2014 data, the county-level designation is based on the 2013 version of the UIC. Prior to 2014, the categorization was based on the 2003 version of the UIC. The 12 categories of the UIC are combined into 4 broader categories that differentiate between large metropolitan counties (include one or more urbanized areas with at least 1 million residents), small metropolitan counties (include one or more urbanized areas with 50,000-999,999 residents), micropolitan counties (include at least one urbanized area with 10,000-49,999 residents), and nonurban residual counties (rural). About HCUP The Healthcare Cost and Utilization Project (HCUP, pronounced "H-Cup") is a family of healthcare databases and related software tools and products developed through a Federal-State-Industry partnership and sponsored by the Agency for Healthcare Research and Quality (AHRQ). HCUP databases bring together the data collection efforts of State data organizations, hospital associations, and private data organizations (HCUP Partners) and the Federal government to create a national information resource of encounter-level healthcare data. HCUP includes the largest collection of longitudinal hospital care data in the United States, with all-payer, encounter-level information beginning in 1988. These databases enable research on a broad range of health policy issues, including cost and quality of health services, medical practice patterns, access to healthcare programs, and outcomes of treatments at the national, State, and local market levels. HCUP would not be possible without the contributions of the following data collection Partners from across the United States: |
|
Alaska Department of Health and Social Services
Alaska State Hospital and Nursing Home Association Arizona Department of Health Services Arkansas Department of Health California Office of Statewide Health Planning and Development Colorado Hospital Association Connecticut Hospital Association Delaware Division of Public Health District of Columbia Hospital Association Florida Agency for Health Care Administration Georgia Hospital Association Hawaii, University of Hawai'i at Hilo Hawaii Laulima Data Alliance Illinois Department of Public Health Indiana Hospital Association Iowa Hospital Association Kansas Hospital Association Kentucky Cabinet for Health and Family Services Louisiana Department of Health Maine Health Data Organization Maryland Health Services Cost Review Commission Massachusetts Center for Health Information and Analysis Michigan Health & Hospital Association Minnesota Hospital Association Mississippi State Department of Health Missouri Hospital Industry Data Institute |
Montana Hospital Association Nebraska Hospital Association Nevada Department of Health and Human Services New Hampshire Department of Health & Human Services New Jersey Department of Health New Mexico Department of Health New York State Department of Health North Carolina Department of Health and Human Services North Dakota (data provided by the Minnesota Hospital Association) Ohio Hospital Association Oklahoma State Department of Health Oregon Association of Hospitals and Health Systems Oregon Office of Health Analytics Pennsylvania Health Care Cost Containment Council Rhode Island Department of Health South Carolina Revenue and Fiscal Affairs Office South Dakota Association of Healthcare Organizations Tennessee Hospital Association Texas Department of State Health Services Utah Department of Health Vermont Association of Hospitals and Health Systems Virginia Health Information Washington State Department of Health West Virginia Department of Health and Human Resources, West Virginia Health Care Authority Wisconsin Department of Health Services Wyoming Hospital Association |
|
About the SID
The HCUP State Inpatient Databases (SID) are hospital inpatient databases from data organizations participating in HCUP. The SID contain the universe of the inpatient discharge abstracts in the participating HCUP States, translated into a uniform format to facilitate multistate comparisons and analyses. Together, the SID encompass more than 95 percent of all U.S. community hospital discharges. The SID can be used to investigate questions unique to one State, to compare data from two or more States, to conduct market-area variation analyses, and to identify State-specific trends in inpatient care utilization, access, charges, and outcomes. For More Information For other information on hospital costs and use in the United States focused on specific types of insurers or payers (Medicaid, Medicare, and private insurance), refer to the HCUP Statistical Briefs located at www.hcup-us.ahrq.gov/reports/statbriefs/sb_insured.jsp. For additional HCUP statistics, visit:
For a detailed description of HCUP and more information on the design of the State Inpatient Databases (SID), please refer to the following database documentation: Agency for Healthcare Research and Quality. Overview of the State Inpatient Databases (SID). Healthcare Cost and Utilization Project (HCUP). Rockville, MD: Agency for Healthcare Research and Quality. Updated November 2019. www.hcup-us.ahrq.gov/sidoverview.jsp. Accessed February 3, 2020. Suggested Citation Moore BJ (IBM Watson Health), Liang L (AHRQ). Medicare Advantage Versus the Traditional Medicare Program: Costs of Inpatient Stays, 2009-2017. HCUP Statistical Brief #262. August 2020. Agency for Healthcare Research and Quality, Rockville, MD. www.hcup-us.ahrq.gov/reports/statbriefs/sb262-Medicare-Advantage-Costs-2009-2017.pdf. Acknowledgments The authors would like to acknowledge the contributions of Nils Nordstrand of IBM Watson Health. *** AHRQ welcomes questions and comments from readers of this publication who are interested in obtaining more information about access, cost, use, financing, and quality of healthcare in the United States. We also invite you to tell us how you are using this Statistical Brief and other HCUP data and tools, and to share suggestions on how HCUP products might be enhanced to further meet your needs. Please email us at hcup@ahrq.gov or send a letter to the address below:Joel W. Cohen, Ph.D., Director Center for Financing, Access and Cost Trends Agency for Healthcare Research and Quality 5600 Fishers Lane Rockville, MD 20857 This Statistical Brief was posted online on August 4, 2020. a The 18 States included in this analysis are California, Connecticut, Florida, Georgia, Iowa, Kentucky, Massachusetts, Maryland, Michigan, Nevada, New Jersey, New York, Ohio, Oregon, Pennsylvania, Rhode Island, Tennessee, and Wisconsin. b Agency for Healthcare Research and Quality. HCUP Clinical Classifications Software Refined (CCSR) for ICD-10-CM Diagnoses. Healthcare Cost and Utilization Project (HCUP). Agency for Healthcare Research and Quality. Updated January 2020. www.hcup-us.ahrq.gov/toolssoftware/ccs/ccs.jsp. Accessed February 27, 2020. c Barrett ML, McCarty J, Jiang J. An Examination of Expected Payer Coding in HCUP Databases (Updated for 2017 HCUP Data), User Guide. 2019. HCUP Methods Series Report #2019-03 ONLINE. December 13, 2019. U.S. Agency for Healthcare Research and Quality. www.hcup-us.ahrq.gov/reports/methods/2019-03.pdf. Accessed April 7, 2020. d Agency for Healthcare Research and Quality. HCUP Cost-to-Charge Ratio (CCR) Files. Healthcare Cost and Utilization Project (HCUP). 2001-2017. Agency for Healthcare Research and Quality. Updated December 2019. www.hcup-us.ahrq.gov/db/state/costtocharge.jsp. Accessed February 3, 2020. e U.S. Bureau of Economic Analysis. GDP & Personal Income Tables, Table 1.1.4 Price Indexes for Gross Domestic Product. www.bea.gov/iTable/iTable.cfm?reqid=19&step=2#reqid=19&step=3&isuri=1&1921=survey&1903=4. Accessed February 3, 2020. f For additional information about the NHEA, see Centers for Medicare & Medicaid Services (CMS). National Health Expenditure Data. CMS website. Updated December 17, 2019. www.cms.gov/Research-Statistics-Data-and-Systems/Statistics-Trends-and-Reports/NationalHealthExpendData/index.html?redirect=/NationalHealthExpendData/. Accessed February 3, 2020. g American Hospital Association. TrendWatch Chartbook, 2019. Table 4.2. Distribution of Inpatient vs. Outpatient Revenues, 1995-2017. www.aha.org/system/files/media/file/2019/11/TrendwatchChartbook-2019-Appendices.pdf. |
| Supplemental Table 1a. Number of hospital inpatient stays by type of Medicare program in 18 States, 2009-2017, for data presented in Figure 1 | |||
| Year | Number of Inpatient Stays, Millions | ||
|---|---|---|---|
| Medicare Advantage | Traditional Medicare | ||
| 2009 | 1.5 | 5.2 | |
| 2010 | 1.6 | 5.1 | |
| 2011 | 1.6 | 5.1 | |
| 2012 | 1.7 | 4.8 | |
| 2013 | 1.8 | 4.6 | |
| 2014 | 1.9 | 4.5 | |
| 2015 | 2.0 | 4.5 | |
| 2016 | 2.0 | 4.5 | |
| 2017 | 2.2 | 4.5 | |
| Notes: The number of Medicare Advantage stays increased 45.4% from 2009 to 2017.The number of traditional Medicare stays decreased 12.2% from 2009 to 2017. | |||
| Supplemental Table 1b. Aggregate costs by type of Medicare program in 18 States, 2009-2017, for data presented in Figure 1 | |||
| Year | Aggregate Costs, $ Billions | ||
|---|---|---|---|
| Medicare Advantage | Traditional Medicare | ||
| 2009 | 19.6 | 68.2 | |
| 2010 | 20.5 | 68.6 | |
| 2011 | 21.7 | 69.3 | |
| 2012 | 23.1 | 67.4 | |
| 2013 | 24.6 | 65.5 | |
| 2014 | 25.1 | 63.0 | |
| 2015 | 27.5 | 64.7 | |
| 2016 | 28.7 | 66.0 | |
| 2017 | 32.9 | 66.9 | |
| Notes: Aggregate costs for Medicare Advantage increased 68.2% from 2009 to 2017. Aggregate costs for traditional Medicare decreased 1.9% from 2009 to 2017. | |||
| Supplemental Table 2. Average cost per inpatient stay by type of Medicare program in 18 States, 2009-2017, for data presented in Figure 2 | |||
| Year | Average Cost per Stay, $ | ||
|---|---|---|---|
| Medicare Advantage | Traditional Medicare | ||
| 2009 | 12,900 | 13,200 | |
| 2010 | 13,000 | 13,400 | |
| 2011 | 13,300 | 13,700 | |
| 2012 | 13,300 | 13,900 | |
| 2013 | 13,500 | 14,100 | |
| 2014 | 13,500 | 14,000 | |
| 2015 | 13,800 | 14,300 | |
| 2016 | 14,100 | 14,600 | |
| 2017 | 14,900 | 14,700 | |
| Supplemental Table 3. Aggregate costs of Medicare Advantage and traditional Medicare inpatient stays by age group in 18 States, 2009 and 2017, for data presented in Figure 3 | |||
| Age Group, Years | Average Cost per Stay, $ Billions | ||
|---|---|---|---|
| 2009 | 2017 | % Change | |
| Medicare Advantage | |||
| 65-69 | 3.8 | 6.9 | 80.8 |
| 70-79 | 8.6 | 14.6 | 70.1 |
| 80+ | 7.2 | 11.5 | 59.4 |
| Traditional Medicare | |||
| 65-69 | 12.8 | 14.9 | 16.4 |
| 70-79 | 26.8 | 27.3 | 1.9 |
| 80+ | 28.6 | 24.7 | -13.8 |
| Supplemental Table 4. Aggregate costs of Medicare Advantage and traditional Medicare inpatient stays by location of patient residence in 18 States, 2009 and 2017, for data presented in Figure 4 | |||
| Location of Patient Residence | Aggregate Costs, % Billions | ||
|---|---|---|---|
| 2009 | 2017 | % Change | |
| Medicare Advantage | |||
| Large metropolitan | 13.7 | 21.9 | 59.6 |
| Small metropolitan | 4.4 | 8.3 | 90.9 |
| Micropolitan | 1.0 | 1.7 | 74.6 |
| Rural | 0.5 | 1.0 | 101.0 |
| Traditional Medicare | |||
| Large metropolitan | 39.4 | 39.2 | -0.7 |
| Small metropolitan | 18.4 | 18.8 | 2.2 |
| Micropolitan | 6.1 | 5.2 | -15.1 |
| Rural | 4.0 | 3.5 | -12.3 |