STATISTICAL BRIEF #27
|
|
March 2007
C. Allison Russo, M.P.H. and Claudia Steiner, M.D., M.P.H.
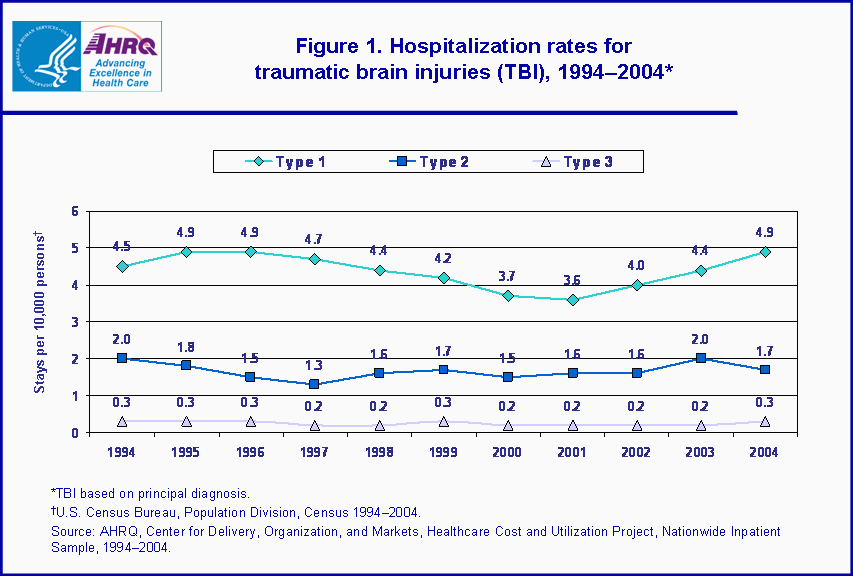
Introduction Traumatic brain injury (TBI), or head injury, occurs when a sudden trauma causes damage to the brain. This type of trauma usually occurs when the head suddenly and violently hits an object, or when an object pierces the skull and enters brain tissue. Symptoms of a TBI can range from mild to severe, depending on the extent of damage to the brain. According to the Centers for Disease Control and Prevention (CDC), TBIs contribute to a substantial number of deaths and cases of permanent disability each year. Approximately 1.4 million TBIs occur annually in the U.S.—with the vast majority of patients treated and released from emergency departments.1 However, the most serious cases often result in death or hospitalization, and patients hospitalized for TBI frequently require long-term or lifetime care. This Statistical Brief presents data from the Healthcare Cost and Utilization Project (HCUP) on the treatment of TBI in U.S. hospitals in 2004.2 Hospital utilization and costs for TBI admissions are compared with hospital stays for all other injuries. Additionally, trends in hospital stays for TBI and differences in the distribution of TBI admissions by various patient characteristics are examined. Finally, common causes of TBIs resulting in hospital admission, as well as the coexisting conditions often associated with these injuries, are described. All differences between estimates noted in the text are statistically significant at the 0.05 level or better. Findings In 2004, there were more than 203,500 hospital stays principally for the treatment of TBIs. This represented a hospitalization rate of 6.9 stays per 10,000 persons and totaled $3.2 billion in hospital costs (table 1). Type 1 TBIs accounted for the majority of TBI admissions (71.1 percent), while Type 2 and Type 3 TBIs accounted for less than one-third of all TBI admissions (25.1 percent and 3.8 percent, respectively).2 Between 1994 and 2001, the hospitalization rate for Type 1 TBIs decreased by 21 percent, from 4.5 to 3.6 stays per 10,000 persons. However, since 2001, stays for Type 1 TBI have been on the rise, increasing by about 38 percent, from 3.6 to 4.9 stays per 10,000 (figure 1), reaching the previous high of 4.9 stays in 1995 and 1996. Hospitalization rates for Type 2 and Type 3 TBI remained relatively stable from 1994 to 2004. General characteristics of hospital stays for traumatic brain injury Table 1 compares the general characteristics of hospitalizations for TBI with the characteristics of all other injury hospitalizations in 2004. Compared with the average hospital stay for non-TBI injuries, admissions for TBIs were longer and more costly. The mean length of stay for the treatment of all TBI types was 6.6 days compared with 4.6 days for all other injuries. Admissions for Type 1 TBI were even longer, averaging 8.1 days. However, admissions for Type 2 and Type 3 TBIs were considerably shorter (2.8 and 3.0 days, respectively). Overall, the average cost of a TBI admission was $15,700 versus $9,600 for all other injuries. The average cost for a Type 1 TBI hospitalization was $19,300. |
|
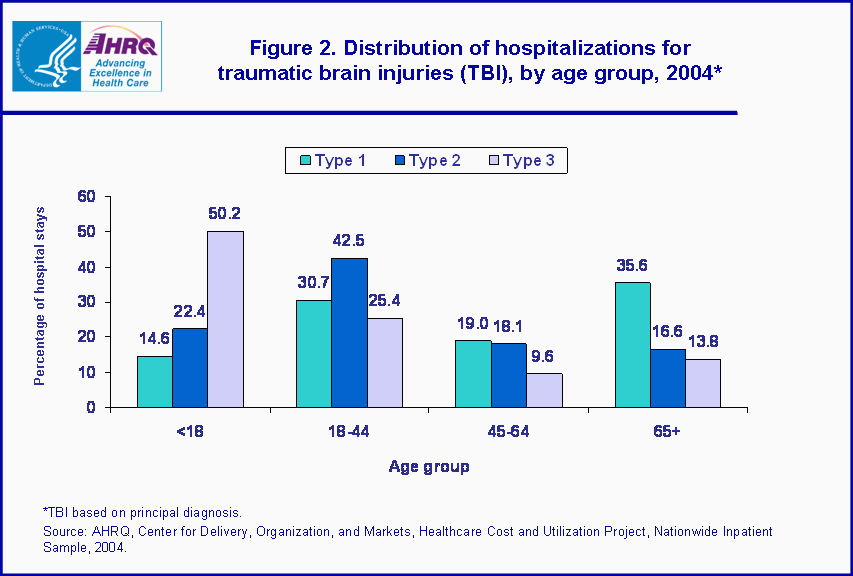
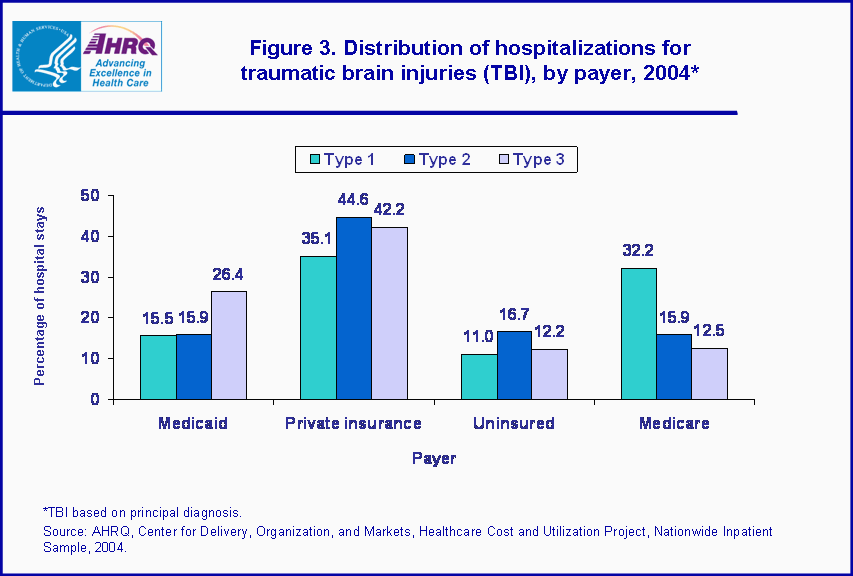
Admissions for TBIs were more likely to occur in younger patients and males. On average, patients admitted for TBI were 45.3 years old, seven years younger than the average patient hospitalized for all other injuries. Patients hospitalized for Type 2 TBI were an average 37.7 years of age, while the mean age of those admitted for Type 3 TBI was 26.4 years. Although males accounted for 48.5 percent of all hospitalizations for non-TBI injuries, they accounted for 64.7 percent of hospital stays for TBI.
Hospitalizations for TBI were also more likely than non-TBI injuries to originate in the emergency department and result in death. The percentage of admissions for all TBIs originating in the emergency department was 82.1 percent compared with 77.3 percent for all other injuries. The percentage of emergency admissions was highest among Type 2 TBIs (88.1 percent). Approximately 9.4 percent of all TBI hospital admissions resulted in death—nearly six times the in-hospital death rate for all other injuries. However, Type 1 TBIs accounted for most of the deaths. In-hospital deaths occurred in 13.1 percent of stays for Type 1 TBI, but the in-hospital mortality rate for Type 2 and Type 3 TBIs was less than 0.4 percent. Although the emergency admission and in-hospital death rates were higher for TBI hospitalizations, the percentage of TBI stays resulting in a transfer to rehabilitation and nursing home facilities was lower than the percentage of rehabilitation and nursing home transfers required for non-TBI injuries (22.2 percent versus 32.8 percent, respectively). However, this transfer rate for Type 1 TBI admissions (27.8 percent) was more than three times higher than that for Type 2 TBI (8.5 percent) and Type 3 TBI (8.2 percent), while only slightly lower than the rehabilitation and nursing home transfer rate for non-TBI injuries. Differences in hospital stays for traumatic brain injury, by age and payer Figure 2 illustrates that the age groups predominantly admitted to the hospital for TBIs varied significantly depending on TBI type. For example, more than one-third (35.6 percent) of Type 1 TBI admissions occurred among patients 65 years and older, while patients ages 18 to 44 years accounted for 30.7 percent of Type 1 stays. In contrast, more than two out of three hospitalizations for Type 2 TBI occurred among patients younger than 45 years of age, with patients ages 18 to 44 years accounting for 42.5 percent. Furthermore, patients younger than 45 years of age made up nearly three-fourths of Type 3 TBI hospital stays—children younger than 18 years accounted for approximately half of these admissions. Figure 3 shows that private insurance was the most common source of payment for charges related to hospital stays for all TBIs, regardless of type. Private insurance was billed for more than one-third (35.1 percent) of Type 1 TBI admissions, followed closely by Medicare, which was billed for 32.2 percent of the charges associated with Type 1 TBI admissions. Nearly half of all stays for Type 2 and Type 3 TBIs (44.6 percent and 42.2 percent, respectively) were billed to private insurance. The percentage of stays billed to Medicaid was highest among patients admitted for Type 3 TBI (26.4 percent), while the percentage of uninsured stays was highest for Type 2 TBIs (16.7 percent). Common causes of hospital stays for traumatic brain injury Table 2 lists the most frequent causes of TBIs requiring hospitalization. The vast majority of TBI hospitalizations resulted from falls and motor vehicle traffic (MVT) crashes. Falls caused 40.4 percent of Type 1 TBI hospital admissions and 42.0 percent of Type 3 TBI stays. More than one in four Type 2 TBIs (26.9 percent) also resulted from falls. MVT crashes caused 41.6 percent of Type 2 TBIs, and were listed as the cause of injury for 26.2 percent of Type 1 TBI stays and 16.6 percent of admissions for Type 3 TBIs. Other common causes of TBI hospital stays included being struck by or against an object and non-MVT transport accidents. Firearms were common causes of Type 1 TBI stays, while admissions for Type 2 and Type 3 TBIs commonly resulted from non-MVT pedal cyclist accidents. Coexisting conditions commonly associated with hospital stays for traumatic brain injury Table 3 lists the coexisting diagnoses most commonly associated with hospital stays principally for the treatment of TBI. Nearly one in four admissions for TBI (24.2 percent) also required the treatment of an open wound of the head, neck, and trunk. Approximately one in five TBI hospitalizations also included a superficial injury/contusion (22.1 percent) and essential hypertension (21.3 percent). Respiratory failure, a potentially life-threatening disorder, was noted in 13.5 percent of all hospitalizations for TBI. Alcohol-related and substance-related mental disorders were coexisting conditions for 13.4 percent and 11.6 percent, respectively, of all TBI stays. Data Source The estimates in this Statistical Brief are based on data from the HCUP 2004 Nationwide Inpatient Sample (NIS). Historical data were drawn from the 1994–2003 NIS. Supplemental source included data on regional population estimates from Table 8: Annual Estimates of the Population for the United States, Regions, and Divisions: April 1, 2000 to July 1, 2005 (NST-EST2005-08), Population Division, U.S. Census Bureau, Release date: December 22, 2005 (http://www.census.gov/popest/). Definitions Types of hospitals included in HCUP HCUP is based on data from community hospitals, defined as short-term, non-Federal, general and other hospitals, excluding hospital units of other institutions (e.g., prisons). HCUP data include OB-GYN, ENT, orthopedic, cancer, pediatric, public, and academic medical hospitals. They exclude long-term care, rehabilitation, psychiatric, and alcoholism and chemical dependency hospitals, but these types of discharges are included if they are from community hospitals. Unit of analysis The unit of analysis is the hospital discharge (i.e., the hospital stay), not a person or patient. This means that a person who is admitted to the hospital multiple times in one year will be counted each time as a separate "discharge" from the hospital. Costs and charges Total hospital charges were converted to costs using cost-to-charge ratios based on hospital accounting reports from the Centers for Medicare and Medicaid Services (CMS).3 Costs will tend to reflect the actual costs of production, while charges represent what the hospital billed for the case. For each hospital, a hospital-wide cost-to-charge ratio is used because detailed charges are not available across all HCUP States. Hospital charges reflect the amount the hospital charged for the entire hospital stay and does not include professional (physician) fees. For the purposes of this Statistical Brief, costs are reported to the nearest hundreds. Payer Up to two payers can be coded for a hospital stay in HCUP data. When this occurs, the following hierarchy is used: – If either payer is listed as Medicaid, the payer is "Medicaid." – For non-Medicaid stays, if either payer is listed as Medicare, the payer is "Medicare." – For stays that are neither Medicaid nor Medicare, if either payer is listed as private insurance, the payer is "private insurance." – For stays that are not Medicaid, Medicare or private insurance, if either payer is some other third-party payer, the payer is "other," which consists of Worker’s Compensation, TRICARE/CHAMPUS, CHAMPVA, Title V, and other government programs. – For stays that have no third-party payer and the payer is listed as "self-pay" or "no charge," the payer is "uninsured." Diagnoses, ICD-9-CM, and Clinical Classifications Software (CCS) The principal diagnosis is that condition established after study to be chiefly responsible for the patient’s admission to the hospital. Secondary diagnoses are concomitant conditions that coexist at the time of admission or that develop during the stay. ICD-9-CM is the International Classification of Diseases, Ninth Revision, Clinical Modification, which assigns numeric codes to diagnoses. There are about 12,000 ICD-9-CM diagnosis codes. CCS categorizes ICD-9-CM diagnoses into 260 clinically meaningful categories.4 This "clinical grouper" makes it easier to quickly understand patterns of diagnoses and procedures. Cases and types of traumatic brain injury were identified using the Barell Matrix definition.5 The ICD-9-CM diagnosis codes used to categorize Type 1 TBIs are – 800, 801, 803, 804 (.03-.05, .1-.4, .53-.55, .6-.9) – 850 (.2-.4) – 851-854 – 950 (.1-.3) – 995.55 The ICD-9-CM diagnosis codes used to categorize Type 2 TBIs are – 800, 801, 803, 804 (.00, .02, .06, .09, .50, .52, .56, .59) – 850 (.0, .1, .5, .9) The ICD-9-CM diagnosis codes used to categorize Type 3 TBIs are – 800, 801, 803, 804 (.01, .51) Cause of injury The cause of injury is determined by the external cause of injury codes (commonly referred to as E codes), which supplement the ICD-9-CM diagnosis codes. These codes designate the cause of injury. Multiple E codes may be present on a single hospital record, but not all records for patients with TBI include E codes. For this report, external cause of injury codes were categorized using the HCUP CCS tool. Emergency admission Admission source indicates where the patient was located prior to admission to the hospital. Emergency admission indicates the patient was admitted to the hospital through the emergency department. Discharge status Discharge status indicates the disposition of the patient at discharge from the hospital, and includes the following six categories: routine (to home), transfer to another short-term hospital, other transfers (including skilled nursing facility, intermediate care, rehabilitation care, swing bed, and another type of facility such as a nursing home), home health care, against medical advice (AMA), or died in the hospital. About the NIS The HCUP Nationwide Inpatient Sample (NIS) is a nationwide database of hospital inpatient stays. The NIS is nationally representative of all community hospitals (i.e., short-term, non-Federal, non-rehabilitation hospitals). The NIS is a sample of hospitals and includes all patients from each hospital, regardless of payer. It is drawn from a sampling frame that contains hospitals comprising 90 percent of all discharges in the United States. The vast size of the NIS allows the study of topics at both the national and regional levels for specific subgroups of patients. In addition, NIS data are standardized across years to facilitate ease of use. About HCUP HCUP is a family of powerful health care databases, software tools, and products for advancing research. Sponsored by the Agency for Healthcare Research and Quality (AHRQ), HCUP includes the largest all- payer encounter-level collection of longitudinal health care data (inpatient, ambulatory surgery, and emergency department) in the United States, beginning in 1988. HCUP is a Federal-State-Industry Partnership that brings together the data collection efforts of many organizations—such as State data organizations, hospital associations, private data organizations, and the Federal government—to create a national information resource. For more information about HCUP, visit http://www.hcup-us.ahrq.gov/. HCUP would not be possible without the contributions of the following data collection Partners from across the United States: Arizona Department of Health Services Arkansas Department of Health & Human Services California Office of Statewide Health Planning & Development Colorado Health & Hospital Association Connecticut Integrated Health Information (Chime, Inc.) Florida Agency for Health Care Administration Georgia GHA: An Association of Hospitals & Health Systems Hawaii Health Information Corporation Illinois Health Care Cost Containment Council and Department of Public Health Indiana Hospital&Health Association Iowa Hospital Association Kansas Hospital Association Kentucky Cabinet for Health and Family Services Maryland Health Services Cost Review Commission Massachusetts Division of Health Care Finance and Policy Michigan Health & Hospital Association Minnesota Hospital Association Missouri Hospital Industry Data Institute Nebraska Hospital Association Nevada Division of Health Care Financing and Policy, Department of Human Resources New Hampshire Department of Health & Human Services New Jersey Department of Health and Senior Services New York State Department of Health North Carolina Department of Health and Human Services Ohio Hospital Association Oregon Office for Oregon Health Policy and Research and Oregon Association of Hospitals and Health Systems Rhode Island Department of Health South Carolina State Budget & Control Board South Dakota Association of Healthcare Organizations Tennessee Hospital Association Texas Department of State Health Services Utah Department of Health Vermont Association of Hospitals and Health Systems Virginia Health Information Washington State Department of Health West Virginia Health Care Authority Wisconsin Department of Health and Family Services For additional HCUP statistics, visit HCUPnet, our interactive query system at https://datatools.ahrq.gov/hcupnet. For More Information For a detailed description of HCUP and more information on the design of the NIS and methods to calculate estimates, please refer to the following publications: Steiner, C., Elixhauser, A., Schnaier, J. The Healthcare Cost and Utilization Project: An Overview. Effective Clinical Practice 5(3):143–51, 2002. Design of the HCUP Nationwide Inpatient Sample, 2004. Online. August 8, 2006. U.S. Agency for Healthcare Research and Quality. http://www.hcup-us.ahrq.gov/db/nation/nis/reports/NIS_2004_Design_Report.pdf Houchens, R., Elixhauser, A. Final Report on Calculating Nationwide Inpatient Sample (NIS) Variances, 2001. HCUP Methods Series Report #2003-2. Online. June 2005 (revised June 6, 2005). U.S. Agency for Healthcare Research and Quality. http://www.hcup-us.ahrq.gov/reports/methods/2003_02.pdf Houchens R. L., Elixhauser A. Using the HCUP Nationwide Inpatient Sample to Estimate Trends. (Updated for 1988–2004). HCUP Methods Series Report #2006-05. Online. August 18, 2006. U.S. Agency for Healthcare Research and Quality. http://www.hcup-us.ahrq.gov/reports/methods/2006_05_NISTrends Report_1988-2004.pdf Suggested Citation Russo, C. A. (Thomson Medstat) and Steiner, C. (AHRQ). Hospital Admissions for Traumatic Brain Injuries, 2004. HCUP Statistical Brief #27. March 2007. Agency for Healthcare Research and Quality, Rockville, MD. http://www.hcup-us.ahrq.gov/reports/statbriefs/sb27.pdf *** AHRQ welcomes questions and comments from readers of this publication who are interested in obtaining more information about access, cost, use, financing, and quality of health care in the United States. We also invite you to tell us how you are using this Statistical Brief and other HCUP data and tools, and to share suggestions on how HCUP products might be enhanced to further meet your needs. Please e-mail us at hcup@ahrq.gov or send a letter to the address below:Irene Fraser, Ph.D., Director Center for Delivery, Organization, and Markets Agency for Healthcare Research and Quality 540 Gaither Road Rockville, MD 20850 1Langlois J. A., Rutland-Brown W., Thomas K. E. Traumatic brain injury in the United States: emergency department visits, hospitalizations, and deaths. January 2006. Centers for Disease Control and Prevention, National Center for Injury Prevention and Control, Atlanta, GA. 2In this brief, estimates are presented for three types of TBI: Type 1, Type 2, and Type 3. Type 1 TBI represents the most serious head injuries and indicates recorded evidence of an intracranial injury or a moderate or prolonged loss of consciousness, shaken infant syndrome, or injuries to the optic nerve pathways. Type 2 TBI includes head injuries with no recorded evidence of intracranial injury but a loss of consciousness that is less than one hour, unspecified, or unknown. Type 3 TBI includes patients with no evidence of intracranial injury and no loss of consciousness. See the Definitions section for a complete list of ICD-9-CM codes defining these categories. 3HCUP Cost-to-Charge Ratio Files (CCR). Healthcare Cost and Utilization Project (HCUP). 2001–2003. U.S. Agency for Healthcare Research and Quality, Rockville, MD. http://www.hcup-us.ahrq.gov/db/state/costtocharge.jsp. 4HCUP CCS. Healthcare Cost and Utilization Project (HCUP). August 2006. U.S. Agency for Healthcare Research and Quality, Rockville, MD. http://www.hcup-us.ahrq.gov/toolssoftware/ccs/ccs.jsp. 5Barell V., Aharonson-Daniel L., Fingerhut L., MacKenzie E., Ziv A., Boyko V., et al. An introduction to the Barell body region by nature of injury diagnosis matrix. Injury Prevention8:91–96, 2002. |
| Table 1. Hospitalizations for traumatic brain injuries (TBI) compared with hospitalizations for all other injuries, 2004 | |||||
| Hospital stays for TBI* | Hospital stays for all other injuries | ||||
| All TBI | Type 1 | Type 2 | Type 3 | ||
| Number of hospital stays (percentage of TBI stays) | 203,500 (100%) | 144,700 (71.1%) | 51,100 (25.1%) | 7,700 (3.8%) | 1,690,700 |
| Stays per 10,000 persons† | 6.9 | 4.9 | 1.7 | 0.3 | 57.6 |
| Mean length of stays, days | 6.6 | 8.1 | 2.8 | 3.0 | 4.6 |
| Mean hospital cost | $15,700 | $19,300 | $7,000 | $6,500 | $9,600 |
| Aggregate costs | $3.2 billion | $2.7 billion | $356.9 million | $49.0 million | $16.0 billion |
| Mean age, years | 45.3 | 49.0 | 37.7 | 26.4 | 52.3 |
| Percentage male | 64.7% | 64.7% | 64.8% | 64.6% | 48.5% |
| Percentage admitted through the emergency department | 82.1% | 80.1% | 88.1% | 81.4% | 77.3% |
| Percentage transferred to rehabilitation and nursing home facilities‡ | 22.2% | 27.8% | 8.5% | 8.2% | 32.8% |
| Percentage died in hospital | 9.4% | 13.1% | 0.4% | 0.2% | 1.6% |
| *TBI based on principal diagnosis. †U.S. Census Bureau, Population Division, Census 2004. ‡Includes skilled nursing facility, intermediate care, rehabilitation care, swing bed, and other facilities such as a nursing homes. Source: AHRQ, Center for Delivery, Organization, and Markets, Healthcare Cost and Utilization Project, Nationwide Inpatient Sample, 2004. | |||||
| Table 2. Common causes of traumatic brain injuries (TBI) that result in hospitalization, 2004* | ||
| Cause of injury† | Total number of stays | Percentage of TBI stays |
| Type 1: | ||
| Fall | 58,500 | 40.4% |
| Motor vehicle traffic (MVT) crashes | 37,900 | 26.2% |
| Struck by/against events | 10,800 | 7.5% |
| Transport (not MVT) accidents | 5,200 | 3.6% |
| Firearm | 3,100 | 2.1% |
| Type 2: | ||
| Motor vehicle traffic (MVT) crashes | 21,300 | 41.6% |
| Fall | 13,800 | 26.9% |
| Struck by/against events | 5,400 | 10.5% |
| Transport (not MVT) accidents | 2,500 | 5.0% |
| Pedal cyclist (not MVT) accidents | 1,300 | 2.5% |
| Type 3: | ||
| Fall | 3,200 | 42.0% |
| Motor vehicle traffic (MVT) crashes | 1,300 | 16.6% |
| Struck by/against events | 1,200 | 15.9% |
| Transport (not MVT) accidents | 300 | 4.0% |
| Pedal cyclist (not MVT) accidents | 200 | 2.5% |
| *TBI based on principal diagnosis. †Based on external cause of injury codes (E codes). Not all discharges for traumatic brain injury have an associated external cause of injury code. Source: AHRQ, Center for Delivery, Organization, and Markets, Healthcare Cost and Utilization Project, Nationwide Inpatient Sample, 2004. | ||
| Table 3. Coexisting conditions commonly associated with hospitalizations for traumatic brain injuries (TBI), 2004* | ||
| Secondary diagnoses | Total number of TBI stays with this diagnosis | Percentage of TBI stays with this diagnosis |
| Open wounds of head, neck, and trunk | 49,300 | 24.2% |
| Superficial injury/contusion | 45,100 | 22.1% |
| Essential hypertension | 43,300 | 21.3% |
| Other fractures | 29,900 | 14.7% |
| Respiratory failure/insufficiency/arrest (adult) | 27,500 | 13.5% |
| Alcohol-related mental disorders | 27,400 | 13.4% |
| Fluid and electrolyte disorders | 26,200 | 12.9% |
| Skull and face fractures | 24,900 | 12.2% |
| Crushing injury or internal injury | 23,600 | 11.6% |
| Substance-related mental disorders | 23,600 | 11.6% |
| *TBI based on principal diagnosis. Source: AHRQ, Center for Delivery, Organization, and Markets, Healthcare Cost and Utilization Project, Nationwide Inpatient Sample, 2004. | ||
|
|