|
STATISTICAL BRIEF #271
February 2021
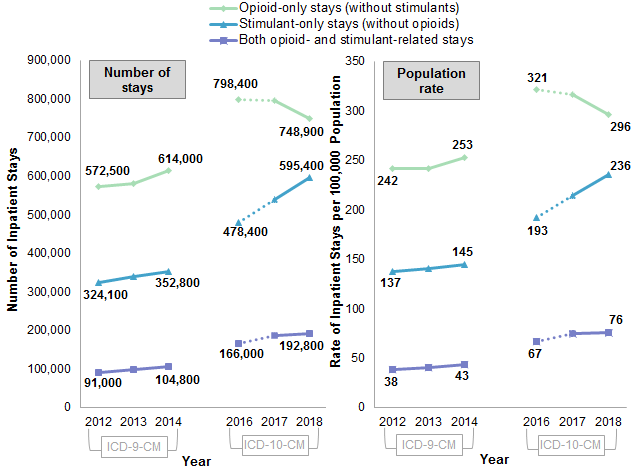
Kathryn R. Fingar, Ph.D., M.P.H., and Pamela L. Owens, Ph.D. Introduction Substance use continues to be a primary public health concern, with substance use disorders placing a considerable burden on individuals, families, the healthcare system, and the economy.1 To date, the national focus largely has been on the more than 10 million Americans misusing opioids.2 More recently, however, concerns have shifted to the rising number of individuals abusing multiple substances, such as those who use stimulants to counter the sedative effects of opioids.3,4 This Healthcare Cost and Utilization Project (HCUP) Statistical Brief presents statistics on inpatient stays involving dependence on, abuse of, and poisoning and adverse effects from opioids (e.g., prescription opioids, heroin) and stimulants (e.g., cocaine, psychostimulants, amphetamines). Data are from adults aged 18 years and older in the 2012-2014 and 2016-2018 National Inpatient Sample (NIS) and State Inpatient Databases (SID). National trends in opioid- and stimulant-related stays are shown from 2012 to 2014 and 2016 to 2018, overall and by primary expected payer. Additionally, characteristics of stays involving opioids and stimulants and State-specific rates of opioid- and stimulant-related stays are examined in 2012 and 2018. Because of the large sample size of the NIS and SID data, small differences can be statistically significant but not clinically important. Thus, only differences greater than or equal to 10 percent are discussed in the text. Findings Trends in opioid- and stimulant-related inpatient stays, 2012-2014 and 2016-2018 Figure 1 displays trends in the number and population rate of inpatient stays with an opioid-related diagnosis but no stimulant-related diagnosis (opioid-only stays), stimulant-related diagnosis but no opioid-related diagnosis (stimulant-only stays), or both opioid-related and stimulant-related diagnoses from 2012 to 2014 and from 2016 to 2018. The 2012-2014 trend is based on International Classification of Diseases, Ninth Revision, Clinical Modification (ICD-9-CM)-coded data, whereas the 2016-2018 trend is based on International Classification of Diseases, Tenth Revision, Clinical Modification (ICD-10-CM)-coded data. Notably, the ICD-10-CM coding system expanded the number and types of codes available to include unspecified opioid and stimulant use, for which dependence or abuse could not be determined. In contrast, the ICD-9-CM system includes only classifications for dependence and abuse but no codes for unspecified use. As a result of the coding changes, more cases related to opioids and stimulants may be identified under the ICD-10-CM coding system than the ICD-9-CM coding system. For example, of the 1,537,100 stays involving opioids or stimulants identified in 2018, 11 percent were identified only by unspecified use codes. In addition, the identification of cases may be affected by the transition period itself, in which there may be differential adoption of new codes. Figure 1 establishes new baseline estimates of such cases using the ICD-10-CM coding system in 2016. It is expected that hospitals required a transition period to become more familiar with the ICD-10-CM coding system. The transition period for the uptake of the ICD-10-CM coding period is represented as a dashed line, rather than a solid line, in the graph. |
|
Figure 1. The number and population rate of opioid- and stimulant-related adult inpatient stays in the United States, 2012-2014 and 2016-2018
Abbreviations: ICD-9-CM, International Classification of Diseases, Ninth Revision, Clinical Modification; ICD-10-CM, International Classification of Diseases, Tenth Revision, Clinical Modification Line graph that shows the number and population rate of adult inpatient stays with an opioid-related diagnosis but no stimulant-related diagnosis, stimulant-related diagnosis but no opioid-related diagnosis, or both opioid-related and stimulant-related diagnoses from 2012 to 2014 and from 2016 to 2018. Data are provided in Supplemental Table 1. |
|
|
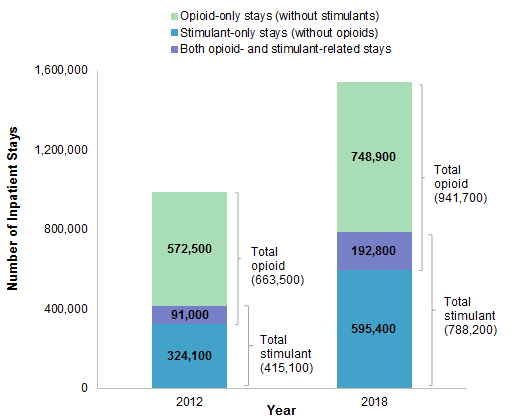
Figure 2. The distribution of opioid- and stimulant-related adult inpatient stays in the United States, 2012 and 2018
Note: The number of inpatient stays was rounded to the nearest hundred. Bar chart that shows the distribution of opioid- and stimulant-related adult inpatient stays for 2012 and 2018. In 2012, there were 572,500 opioid-only stays, 324,100 stimulant-only stays, and 91,000 stays for both opioid- and stimulant-related diagnoses (total opioid stays: 663,500; total stimulant stays: 415,100). In 2018, there were 748,900 opioid-only stays, 595,400 stimulant-only stays, and 192,800 stays for both opioid- and stimulant-related diagnoses (total opioid stays: 941,700; total stimulant stays: 788,200). |
Table 1 presents the population rates of adult inpatient stays involving opioids and stimulants in 2012 and 2018 by patient characteristic. Stays involving opioids without stimulants, stays involving stimulants without opioids, and stays involving both types of substances are examined separately. |
| Table 1. Population rate of opioid- and stimulant-related adult inpatient stays in the United States, by patient characteristic, 2012 and 2018 | ||||||
| Patient characteristic | Rate of stays per 100,000 adult population | |||||
|---|---|---|---|---|---|---|
| Opioid-only stays (without stimulants | Stimulants-only stays (without opioids) | Both opioid- and stimulant-related stays | ||||
| 2012* | 2018† | 2012* | 2018† | 2012* | 2018† | |
| Total | 242 | 296 | 137 | 236 | 38 | 76 |
| Age, years | ||||||
| 18-45 | 221 | 215 | 141 | 254 | 49 | 109 |
| 46-64 | 276 | 355 | 192 | 323 | 40 | 70 |
| 65-74 | 244 | 390 | 35 | 85 | 5 | 16 |
| 75+ | 237 | 403 | 4 | 14 | 1 | 2 |
| Sex | ||||||
| Male | 239 | 284 | 179 | 311 | 47 | 92 |
| Female | 245 | 308 | 97 | 164 | 31 | 61 |
| Race/ethnicity | ||||||
| Asian/Pacific Islander | 37 | 47 | 29 | 54 | 4 | 8 |
| Black | 274 | 324 | 459 | 616 | 80 | 112 |
| Hispanic | 125 | 155 | 109 | 185 | 27 | 50 |
| White | 256 | 338 | 84 | 180 | 33 | 78 |
| Other | 353 | 376 | 230 | 381 | 70 | 132 |
| Location of residence | ||||||
| Metro | 243 | 295 | 144 | 225 | 41 | 76 |
| Rural, metro adjacent | 219 | 284 | 80 | 197 | 23 | 62 |
| Rural, remote | 227 | 293 | 68 | 213 | 19 | 50 |
| Community income | ||||||
| Quartile 1 (lowest) | 306 | 384 | 247 | 418 | 60 | 122 |
| Quartile 2 | 234 | 304 | 122 | 224 | 34 | 71 |
| Quartile 3 | 212 | 268 | 89 | 150 | 28 | 57 |
| Quartile 4 (highest) | 182 | 206 | 55 | 89 | 22 | 40 |
| Note: Sex was missing for <1% of stays across the substance groups and years, race/ethnicity and location of residence were missing for <6% of stays, and community income was missing for <8% of stays. * Data are from the ICD-9-CM, International Classification of Diseases, Ninth Revision, Clinical Modification coding system † Data are from the ICD-10-CM, International Classification of Diseases, Tenth Revision, Clinical Modification coding system Source: Agency for Healthcare Research and Quality (AHRQ), Healthcare Cost and Utilization Project (HCUP), National Inpatient Sample (NIS), 2012 and 2018 | ||||||
|
|
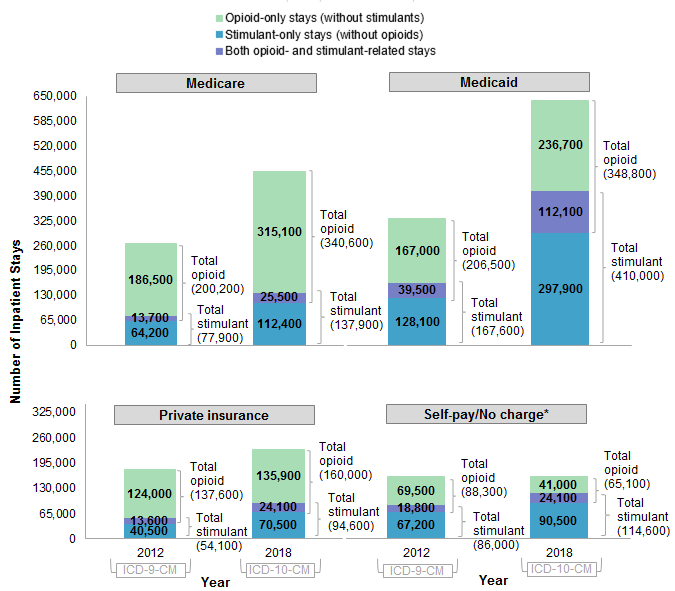
Figure 3. The number of opioid- and stimulant-related adult inpatient stays in the United States, by primary expected payer, 2012 and 2018
Abbreviations: ICD-9-CM, International Classification of Diseases, Ninth Revision, Clinical Modification; ICD-10-CM, International Classification of Diseases, Tenth Revision, Clinical Modification Bar chart that shows the number of opioid- and stimulant-related adult inpatient stays by primary expected payer (Medicare, Medicaid, private insurance, and self-pay/no charge) in 2012 and 2018. Data are provided in Supplemental Table 2. |
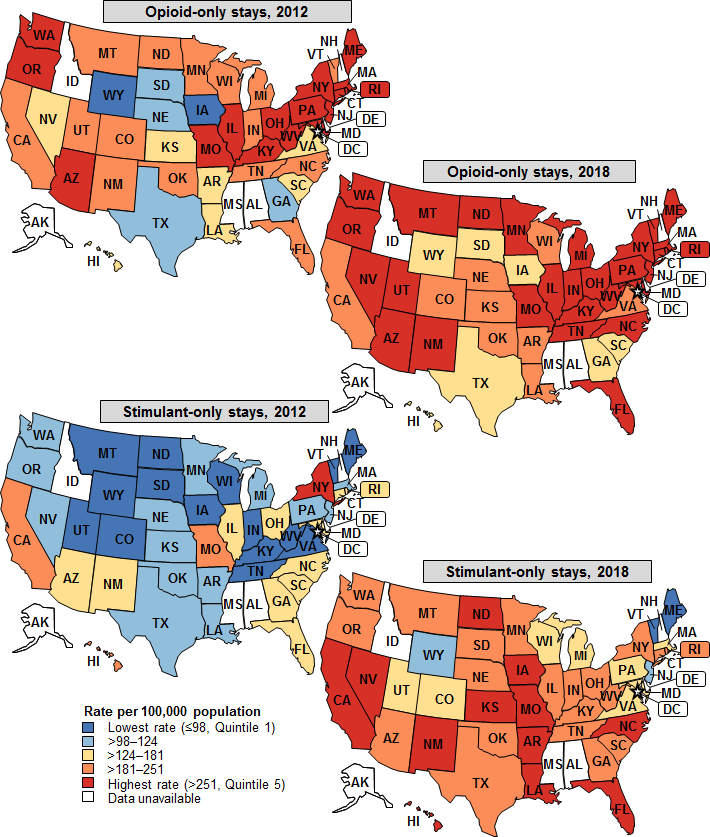
Figure 4 presents the State-specific population rates of opioid-only and stimulant-only adult inpatient stays in 2012 and 2018. |
|
Figure 4. Population rates of opioid- and stimulant-related adult inpatient stays without a concurrent diagnosis for the other type of substance, for 44 States, 2012 and 2018
Note: Quintiles were calculated using the distribution of 2012 population rates for opioid-only and stimulant-only inpatient stays across the 44 States included in this analysis. All 2012 opioid rates and all 2012 stimulant rates were used, totaling 88 data values. Color-coded maps that show the State-specific rates per 100,000 population (by quintile) of opioid-only and stimulant-only adult inpatient stays in 2012 and 2018. Data are provided in Supplemental Table 3. |
|
|
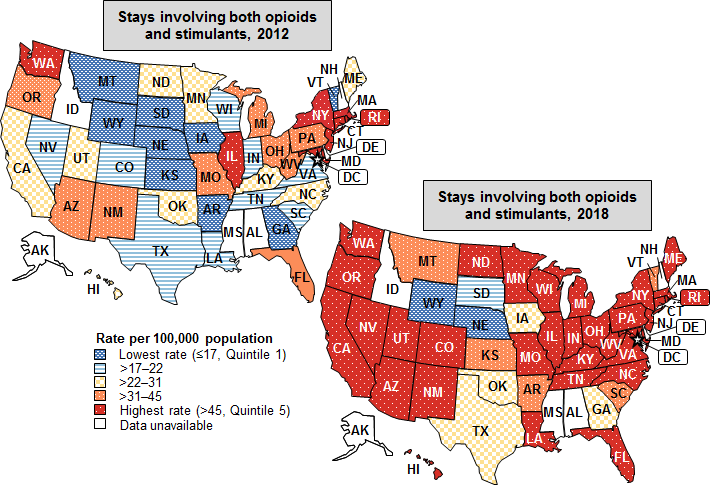
Figure 5. Population rates of adult inpatient stays involving both opioids and stimulants, for 44 States, 2012 and 2018
Note: Quintiles were calculated using the distribution of 2012 population rates for inpatient stays involving both opioids and stimulants across the 44 States included in this analysis. Thus, the population rates in each quintile are different from those presented in Figure 4. Color-coded maps that show the State-specific rates of adult inpatient stays involving both opioids and stimulants in 2012 and 2018. Data are provided in Supplemental Table 4. |
1 Hagemeier NE. Introduction to the opioid epidemic: the economic burden on the healthcare system and impact on quality of life. American Journal of Managed Care. 2018;24:S200-6. 2 Substance Abuse and Mental Health Services Administration, Center for Behavioral Health Statistics and Quality. Key Substance Use and Mental Health Indicators in the United States: Results from the 2019 National Survey on Drug Use and Health. HHS Publication No. PEP20-07-01-001, NSDUH Series H-55. September 2020. www.samhsa.gov/data/sites/default/files/reports/rpt29393/2019NSDUHFFRPDFWHTML/2019NSDUHFFR1PDFW090120.pdf. Accessed November 9, 2020. 3 The Pew Charitable Trusts. Opioid Overdose Crisis Compounded by Polysubstance Use. October 2020. www.pewtrusts.org/-/media/assets/2020/10/opioidoverdosecrisiscompoundedpolysubstanceuse_v3.pdf. 4 Hainer R. Polysubstance Use and Stimulants: A Dangerous Fourth Wave in the Opioid Crisis. Boston Medical Center, Health City. June 2019. www.bmc.org/healthcity/population-health/polysubstance-use-dangerous-fourth-wave-opioid-crisis. About Statistical Briefs Healthcare Cost and Utilization Project (HCUP) Statistical Briefs provide basic descriptive statistics on a variety of topics using HCUP administrative healthcare data. Topics include hospital inpatient, ambulatory surgery, and emergency department use and costs, quality of care, access to care, medical conditions, procedures, and patient populations, among other topics. The reports are intended to generate hypotheses that can be further explored in other research; the reports are not designed to answer in-depth research questions using multivariate methods. Data Source The estimates in this Statistical Brief are based upon data from the HCUP 2012-2014 and 2016-2018 National Inpatient Sample (NIS) and State Inpatient Databases (SID) for 44 States (all except Alabama, Alaska, Delaware, the District of Columbia, Idaho, Mississippi, and New Hampshire). Supplemental sources included population denominator data for use with HCUP databases, derived from information available from Claritas, a vendor that produces population estimates and projections based on data from the U.S. Census Bureau.a Definitions Diagnoses, ICD-9-CM, ICD-10-CM, and Clinical Classifications Software Refined (CCSR) for ICD-10-CM Diagnoses The principal diagnosis is that condition established after study to be chiefly responsible for the patient's admission to the hospital. Secondary diagnoses are conditions that coexist at the time of admission that require or affect patient care treatment received or management, or that develop during the inpatient stay. All-listed diagnoses include the principal diagnosis plus the secondary conditions. ICD-9-CM is the International Classification of Diseases, Ninth Revision, Clinical Modification, which assigns numeric codes to diagnoses. There are approximately 14,000 ICD-9-CM diagnosis codes. ICD-10-CM is the International Classification of Diseases, Tenth Revision, Clinical Modification. In October 2015, ICD-10-CM replaced the ICD-9-CM diagnosis coding system for most inpatient and outpatient medical encounters. There are over 70,000 ICD-10-CM diagnosis codes. The CCSR aggregates ICD-10-CM diagnosis codes into a manageable number of clinically meaningful categories.b The CCSR is intended to be used analytically to examine patterns of healthcare in terms of cost, utilization, and outcomes; rank utilization by diagnoses; and risk-adjust by clinical condition. The CCSR capitalizes on the specificity of the ICD-10-CM coding scheme and allows ICD-10-CM codes to be classified in more than one category. Approximately 10 percent of diagnosis codes are associated with more than one CCSR category because the diagnosis code documents either multiple conditions or a condition along with a common symptom or manifestation. For this Statistical Brief, all-listed diagnosis codes are assigned to the CCSR for opioids and stimulants. ICD-10-CM coding definitions for each CCSR category presented in this Statistical Brief can be found in the CCSR reference file, available at www.hcup-us.ahrq.gov/toolssoftware/ccsr/ccs_refined.jsp#download. Case definition The ICD-9-CM codes defining opioid- and stimulant-related inpatient stays are shown in Table 2. |
| Table 2. ICD-9-CM codes defining opioid- and stimulant-related stays | |
| ICD-9-CM code | Description |
|---|---|
| Opioids | |
| 30400 | Opioid type dependence, unspecified |
| 30401 | Opioid type dependence, continuous |
| 30402 | Opioid type dependence, episodic |
| 30470 | Combinations of opioid type drug with any other drug dependence, unspecified |
| 30471 | Combinations of opioid type drug with any other drug dependence, continuous |
| 30472 | Combinations of opioid type drug with any other drug dependence, episodic |
| 30550 | Opioid abuse, unspecified |
| 30551 | Opioid abuse, continuous |
| 30552 | Opioid abuse, episodic |
| 96500 | Poisoning by opium |
| 96501 | Poisoning by heroin |
| 96502 | Poisoning by methadone |
| 96509 | Poisoning by other opiates and related narcotics |
| E8500 | Accidental poisoning by heroin |
| E8501 | Accidental poisoning by methadone |
| E8502 | Accidental poisoning by other opiates and related narcotics |
| E9350 | Heroin causing adverse effects in therapeutic use |
| E9351 | Methadone causing adverse effects in therapeutic use |
| E9352 | Other opiates and related narcotics causing adverse effects in therapeutic use |
| E9401 | Opiate antagonists causing adverse effects in therapeutic use |
| Stimulants | |
| 30420 | Cocaine dependence, unspecified |
| 30421 | Cocaine dependence, continuous |
| 30422 | Cocaine dependence, episodic |
| 30440 | Amphetamine and other psychostimulant dependence, unspecified |
| 30441 | Amphetamine and other psychostimulant dependence, continuous |
| 30442 | Amphetamine and other psychostimulant dependence, episodic |
| 30560 | Cocaine abuse, unspecified |
| 30561 | Cocaine abuse, continuous |
| 30562 | Cocaine abuse, episodic |
| 30570 | Amphetamine and other psychostimulant abuse, unspecified |
| 30571 | Amphetamine and other psychostimulant abuse, continuous |
| 30572 | Amphetamine and other psychostimulant abuse, episodic |
| 9697 | Poisoning by psychostimulants |
| 96972 | Poisoning by amphetamine |
| 96973 | Poisoning by methylphendate |
| 96979 | Poisoning by psychostimulant NEC |
| 97081 | Poisoning by cocaine |
| E8542 | Accidental poisoning by psychostimulants |
| E9397 | Psychostimulants causing adverse effects in therapeutic use |
| Abbreviations: ICD-9-CM, International Classification of Diseases, Ninth Revision, Clinical Modification; NEC, not elsewhere classified | |
In the ICD-10-CM period, opioid- and stimulant-related inpatient stays were identified using the following CCSR categories:
Note that the ICD-10-CM coding system has one fundamental difference from the ICD-9-CM coding system for substance-related stays. In addition to the classifications for dependence, abuse, poisoning, and adverse effects that are shared by both coding systems, the ICD-10-CM coding system includes a classification for unspecified use that the ICD-9-CM coding system does not. Types of hospitals included in the HCUP National (Nationwide) Inpatient Sample The National (Nationwide) Inpatient Sample (NIS) is based on data from community hospitals, which are defined as short-term, non-Federal, general, and other hospitals, excluding hospital units of other institutions (e.g., prisons). The NIS includes obstetrics and gynecology, otolaryngology, orthopedic, cancer, pediatric, public, and academic medical center hospitals. Excluded are long-term care facilities such as rehabilitation, psychiatric, and alcoholism and chemical dependency hospitals. Beginning in 2012, long-term acute care hospitals are also excluded. However, if a patient received long-term care, rehabilitation, or treatment for a psychiatric or chemical dependency condition in a community hospital, the discharge record for that stay will be included in the NIS. Types of hospitals included in HCUP State Inpatient Databases This analysis used State Inpatient Databases (SID) limited to data from community hospitals, which are defined as short-term, non-Federal, general, and other hospitals, excluding hospital units of other institutions (e.g., prisons). Community hospitals include obstetrics and gynecology, otolaryngology, orthopedic, cancer, pediatric, public, and academic medical center hospitals. Excluded for this analysis are long-term care facilities such as rehabilitation, psychiatric, and alcoholism and chemical dependency hospitals. However, if a patient received long-term care, rehabilitation, or treatment for a psychiatric or chemical dependency condition in a community hospital, the discharge record for that stay was included in the analysis. Unit of analysis The unit of analysis is the hospital discharge (i.e., the hospital stay), not a person or patient. This means that a person who is admitted to the hospital multiple times in 1 year will be counted each time as a separate discharge from the hospital. Population rates Rates of stays per 100,000 population were calculated using 2012-2014 and 2016-2018 hospital discharge totals in the numerator and Claritasc estimates of the 2012-2014 and 2016-2018 U.S. population aged 18 years or older in the denominator, specific to each data year. Individuals hospitalized multiple times are counted more than once in the numerator. Formula: Population rate of stays = number of stays nationally or per State among adults aged 18+ years divided by number of U.S. or State residents aged 18+ years multiplied by 100,000 Percentage difference Percentage differences between groups were calculated using the following formula: Formula: Percentage difference = Group 1 value minus Group 2 value divided by Group 2 value multiplied by 100 Location of patients' residence Place of residence is based on the rural-urban continuum codes (RUCC) for U.S. counties developed by the United States Department of Agriculture (USDA).d RUCC classifies metropolitan counties by population size and nonmetropolitan counties by the size of the urban population and whether the county is adjacent or not adjacent to a metropolitan area. For this Statistical Brief, we collapsed the RUCC codes into the following three categories: Metropolitan (metro) area:
Community-level income is based on the median household income of the patient's ZIP Code of residence. Quartiles are defined so that the total U.S. population is evenly distributed. Cut-offs for the quartiles are determined annually using ZIP Code demographic data obtained from Claritas, a vendor that produces population estimates and projections based on data from the U.S. Census Bureau.e The value ranges for the income quartiles vary by year. The income quartile is missing for patients who are homeless or foreign. Expected payer To make coding uniform across all HCUP data sources, the primary expected payer for the hospital stay combines detailed categories into general groups:
Beginning with 2017 data, hospital stays that were expected to be billed to the State Children's Health Insurance Program (SCHIP) are included under Medicaid. For this Statistical Brief, when more than one payer is listed for a hospital discharge, the first-listed payer is used. Reporting of race and ethnicity Data on Hispanic ethnicity are collected differently among the States and also can differ from the census methodology of collecting information on race (White, Black, Asian/Pacific Islander, American Indian/Alaska Native, Other [including mixed race]) separately from ethnicity (Hispanic, non-Hispanic). State data organizations often collect Hispanic ethnicity as one of several categories that include race. Therefore, for multistate analyses, HCUP creates the combined categorization of race and ethnicity for data from States that report ethnicity separately. When a State data organization collects Hispanic ethnicity separately from race, HCUP uses Hispanic ethnicity to override any other race category to create a Hispanic category for the uniformly coded race/ethnicity data element, while also retaining the original race and ethnicity data. This Statistical Brief reports race/ethnicity for the following categories: Hispanic, non-Hispanic White, non-Hispanic Black, non-Hispanic Asian/Pacific Islander, and non-Hispanic Other. About HCUP The Healthcare Cost and Utilization Project (HCUP, pronounced "H-Cup") is a family of healthcare databases and related software tools and products developed through a Federal-State-Industry partnership and sponsored by the Agency for Healthcare Research and Quality (AHRQ). HCUP databases bring together the data collection efforts of State data organizations, hospital associations, and private data organizations (HCUP Partners) and the Federal government to create a national information resource of encounter-level healthcare data. HCUP includes the largest collection of longitudinal hospital care data in the United States, with all-payer, encounter-level information beginning in 1988. These databases enable research on a broad range of health policy issues, including cost and quality of health services, medical practice patterns, access to healthcare programs, and outcomes of treatments at the national, State, and local market levels. HCUP would not be possible without the contributions of the following data collection Partners from across the United States: |
|
Alaska Department of Health and Social Services
Alaska State Hospital and Nursing Home Association Arizona Department of Health Services Arkansas Department of Health California Office of Statewide Health Planning and Development Colorado Hospital Association Connecticut Hospital Association Delaware Division of Public Health District of Columbia Hospital Association Florida Agency for Health Care Administration Georgia Hospital Association Hawaii Laulima Data Alliance Hawaii University of Hawai'i at Hilo Illinois Department of Public Health Indiana Hospital Association Iowa Hospital Association Kansas Hospital Association Kentucky Cabinet for Health and Family Services Louisiana Department of Health Maine Health Data Organization Maryland Health Services Cost Review Commission Massachusetts Center for Health Information and Analysis Michigan Health & Hospital Association Minnesota Hospital Association Mississippi State Department of Health Missouri Hospital Industry Data Institute |
Montana Hospital Association Nebraska Hospital Association Nevada Department of Health and Human Services New Hampshire Department of Health & Human Services New Jersey Department of Health New Mexico Department of Health New York State Department of Health North Carolina Department of Health and Human Services North Dakota (data provided by the Minnesota Hospital Association) Ohio Hospital Association Oklahoma State Department of Health Oregon Association of Hospitals and Health Systems Oregon Office of Health Analytics Pennsylvania Health Care Cost Containment Council Rhode Island Department of Health South Carolina Revenue and Fiscal Affairs Office South Dakota Association of Healthcare Organizations Tennessee Hospital Association Texas Department of State Health Services Utah Department of Health Vermont Association of Hospitals and Health Systems Virginia Health Information Washington State Department of Health West Virginia Department of Health and Human Resources, West Virginia Health Care Authority Wisconsin Department of Health Services Wyoming Hospital Association |
|
About the NIS The HCUP National (Nationwide) Inpatient Sample (NIS) is a nationwide database of hospital inpatient stays. The NIS is nationally representative of all community hospitals (i.e., short-term, non-Federal, nonrehabilitation hospitals). The NIS includes all payers. It is drawn from a sampling frame that contains hospitals comprising more than 95 percent of all discharges in the United States. The vast size of the NIS allows the study of topics at the national and regional levels for specific subgroups of patients. In addition, NIS data are standardized across years to facilitate ease of use. Over time, the sampling frame for the NIS has changed; thus, the number of States contributing to the NIS varies from year to year. The NIS is intended for national estimates only; no State-level estimates can be produced. The unweighted sample size for the 2012 NIS is 7,296,968 (weighted, this represents 36,484,846 inpatient stays). The unweighted sample size for the 2018 NIS is 7,105,498 (weighted, this represents 35,527,481 inpatient stays). About the SID The HCUP State Inpatient Databases (SID) are hospital inpatient databases from data organizations participating in HCUP. The SID contain the universe of the inpatient discharge abstracts in the participating HCUP States, translated into a uniform format to facilitate multistate comparisons and analyses. Together, the SID encompass more than 95 percent of all U.S. community hospital discharges. The SID can be used to investigate questions unique to one State, to compare data from two or more States, to conduct market-area variation analyses, and to identify State-specific trends in inpatient care utilization, access, charges, and outcomes. For More Information For other information on mental and/or substance use disorders, including opioid-related stays, refer to the HCUP Statistical Briefs located at www.hcup-us.ahrq.gov/reports/statbriefs/sb_mhsa.jsp. For additional HCUP statistics, visit:
For a detailed description of HCUP and more information on the design of the National Inpatient Sample (NIS) and the State Inpatient Databases (SID), please refer to the following database documentation: Agency for Healthcare Research and Quality. Overview of the National (Nationwide) Inpatient Sample (NIS). Healthcare Cost and Utilization Project (HCUP). Rockville, MD: Agency for Healthcare Research and Quality. Updated December 2019. www.hcup-us.ahrq.gov/nisoverview.jsp. Accessed February 3, 2020. Agency for Healthcare Research and Quality. Overview of the State Inpatient Databases (SID). Healthcare Cost and Utilization Project (HCUP). Rockville, MD: Agency for Healthcare Research and Quality. Updated November 2019. www.hcup-us.ahrq.gov/sidoverview.jsp. Accessed February 3, 2020. Suggested Citation Fingar KR (IBM Watson Health), Owens PL (AHRQ). Opioid-Related and Stimulant-Related Adult Inpatient Stays, 2012-2018. HCUP Statistical Brief #271. February 2021. Agency for Healthcare Research and Quality, Rockville, MD. www.hcup-us.ahrq.gov/reports/statbriefs/sb271-Stimulant-Opioid-Hospitalizations-2012-2018.pdf. Acknowledgments The authors would like to acknowledge the contributions of Minya Sheng of IBM Watson Health. *** AHRQ welcomes questions and comments from readers of this publication who are interested in obtaining more information about access, cost, use, financing, and quality of healthcare in the United States. We also invite you to tell us how you are using this Statistical Brief and other HCUP data and tools, and to share suggestions on how HCUP products might be enhanced to further meet your needs. Please email us at hcup@ahrq.gov or send a letter to the address below:Joel W. Cohen, Ph.D., Director Center for Financing, Access and Cost Trends Agency for Healthcare Research and Quality 5600 Fishers Lane Rockville, MD 20857 This Statistical Brief was posted online on February 2, 2021. a Claritas. Claritas Demographic Profile by ZIP Code. https://claritas360.claritas.com/mybestsegments/. b Agency for Healthcare Research and Quality. HCUP Clinical Classifications Software Refined (CCSR) for ICD-10-CM Diagnoses. Healthcare Cost and Utilization Project (HCUP). Agency for Healthcare Research and Quality. Updated January 2020. www.hcup-us.ahrq.gov/toolssoftware/ccsr/ccs_refined.jsp. Accessed February 27, 2020. c Claritas. Claritas Demographic Profile by ZIP Code. https://claritas360.claritas.com/mybestsegments/. d United States Department of Agriculture. Rural-Urban Continuum Codes. www.ers.usda.gov/data-products/rural-urban-continuum-codes/. Accessed February 27, 2020. e Claritas. Claritas Demographic Profile by ZIP Code. https://claritas360.claritas.com/mybestsegments/. |
| Supplemental Table 1. The number and population rate of opioid- and stimulant-related adult inpatient stays in the United States, 2012-2014 and 2016-2018, for data presented in Figure 1 | ||||
| Diagnosis | 2012 | 2014 | 2016 | 2018 |
|---|---|---|---|---|
| Number of Stays | ||||
| Both opioid- and stimulant-related stays | 91,000 | 104,800 | 166,000 | 192,800 |
| Opioid-only stays (without stimulants) | 572,500 | 614,000 | 798,400 | 748,900 |
| Stimulant-only stays (without opioids) | 324,100 | 352,800 | 478,400 | 595,400 |
| Rate per 100,000 Population | ||||
| Both opioid- and stimulant-related stays | 38 | 43 | 67 | 76 |
| Opioid-only stays (without stimulants) | 242 | 253 | 321 | 296 |
| Stimulant-only stays (without opioids) | 137 | 145 | 193 | 236 |
| Supplemental Table 2. The number of opioid- and stimulant-related adult inpatient stays in the United States, by primary expected payer, 2012 and 2018, for data presented in Figure 3 | ||||
| Diagnosis | 2012 | 2018 | ||
|---|---|---|---|---|
| Medicare | ||||
| Opioid-only stays (without stimulants) | 186,500 | 315,100 | ||
| Stimulant-only stays (without opioids) | 64,200 | 112,400 | ||
| Both opioid- and stimulant-related stays | 13,700 | 25,500 | ||
| Total opioid | 200,200 | 340,600 | ||
| Total stimulant | 77,900 | 137,900 | ||
| Medicaid | ||||
| Opioid-only stays (without stimulants) | 167,000 | 236,700 | ||
| Stimulant-only stays (without opioids) | 128,100 | 297,900 | ||
| Both opioid- and stimulant-related stays | 39,500 | 112,100 | ||
| Total opioid | 206,500 | 348,800 | ||
| Total stimulant | 167,600 | 410,000 | ||
| Private Insurance | ||||
| Opioid-only stays (without stimulants) | 124,000 | 135,900 | ||
| Stimulant-only stays (without opioids) | 40,500 | 70,500 | ||
| Both opioid- and stimulant-related stays | 13,600 | 24,100 | ||
| Total opioid | 137,600 | 160,800 | ||
| Total stimulant | 54,100 | 97,600 | ||
| Self-Pay/No Charge | ||||
| Opioid-only stays (without stimulants) | 69,500 | 41,000 | ||
| Stimulant-only stays (without opioids) | 67,200 | 90,500 | ||
| Both opioid- and stimulant-related stays | 18,800 | 24,100 | ||
| Total opioid | 88,300 | 65,100 | ||
| Total stimulant | 86,000 | 114,600 | ||
| Supplemental Table 3. Population rates of opioid- and stimulant-related adult inpatient stays without a concurrent diagnosis for the other type of substance, for 44 States, 2012 and 2018, for data presented in Figure 4 | ||||
| State | Opioid-only stays | Stimulant-only stays | ||
|---|---|---|---|---|
| 2012 | 2018 | 2012 | 2018 | |
| Alabama | —* | —* | —* | —* |
| Alaska | —* | —* | —* | —* |
| Arizona | 5 | 5 | 3 | 4 |
| Arkansas | 3 | 4 | 2 | 5 |
| California | 4 | 4 | 4 | 5 |
| Colorado | 4 | 4 | 1 | 3 |
| Connecticut | 5 | 5 | 3 | 4 |
| Delaware | —* | —* | —* | —* |
| District of Columbia | —* | —* | —* | —* |
| Florida | 4 | 5 | 3 | 5 |
| Georgia | 2 | 3 | 3 | 4 |
| Hawaii | 3 | 3 | 4 | 5 |
| Idaho | —* | —* | —* | —* |
| Illinois | 5 | 5 | 3 | 4 |
| Indiana | 4 | 5 | 1 | 4 |
| Iowa | 1 | 3 | 1 | 5 |
| Kansas | 3 | 4 | 2 | 5 |
| Kentucky | 5 | 5 | 1 | 4 |
| Louisiana | 3 | 4 | 2 | 5 |
| Maine | 5 | 5 | 1 | 1 |
| Maryland | 5 | 5 | 3 | 3 |
| Massachusetts | 5 | 5 | 2 | 3 |
| Michigan | 4 | 5 | 2 | 3 |
| Minnesota | 4 | 5 | 2 | 4 |
| Mississippi | —* | —* | —* | —* |
| Missouri | 5 | 5 | 4 | 5 |
| Montana | 4 | 5 | 1 | 4 |
| Nebraska | 2 | 4 | 2 | 4 |
| Nevada | 3 | 5 | 2 | 5 |
| New Hampshire | —* | —* | —* | —* |
| New Jersey | 5 | 5 | 2 | 2 |
| New Mexico | 4 | 5 | 3 | 5 |
| New York | 5 | 5 | 5 | 4 |
| North Carolina | 4 | 5 | 3 | 5 |
| North Dakota | 4 | 5 | 1 | 5 |
| Ohio | 5 | 5 | 3 | 4 |
| Oklahoma | 4 | 4 | 2 | 4 |
| Oregon | 5 | 5 | 2 | 4 |
| Pennsylvania | 5 | 5 | 2 | 3 |
| Rhode Island | 5 | 5 | 3 | 4 |
| South Carolina | 3 | 3 | 3 | 4 |
| South Dakota | 2 | 3 | 1 | 4 |
| Tennessee | 4 | 5 | 1 | 4 |
| Texas | 2 | 3 | 2 | 4 |
| Utah | 4 | 5 | 1 | 3 |
| Vermont | 4 | 5 | 1 | 1 |
| Virgina | 3 | 4 | 1 | 3 |
| Washington | 5 | 5 | 2 | 4 |
| West Virginia | 5 | 5 | 1 | 4 |
| Wisconsin | 4 | 4 | 1 | 3 |
| Wyoming | 1 | 3 | 1 | 2 |
| Notes: Quintile 1: ≤98 per 100,000 population; Quintile 2: >98-124 per 100,000 population; Quintile 3: >124-181 per 100,000 population; Quintile 4: >181-251 per 100,000 population; Quintile 5: >251 per 100,000 population. * Indicates data unavailable. |
||||
| Supplemental Table 4. Population rates of adult inpatient stays involving both opioids and stimulants, for 44 States, 2012 and 2018, for data presented in Figure 5 | ||||
| State | Stays involving both opioids and stimulants | |||
|---|---|---|---|---|
| 2012 | 2018 | |||
| Alabama | —* | —* | ||
| Alaska | —* | —* | ||
| Arizona | 4 | 5 | ||
| Arkansas | 1 | 4 | ||
| California | 3 | 5 | ||
| Colorado | 2 | 5 | ||
| Connecticut | 5 | 5 | ||
| Delaware | —* | —* | ||
| District of Columbia | —* | —* | ||
| Florida | 4 | 5 | ||
| Georgia | 1 | 3 | ||
| Hawaii | 3 | 5 | ||
| Idaho | —* | —* | ||
| Illinois | 5 | 5 | ||
| Indiana | 2 | 5 | ||
| Iowa | 1 | 3 | ||
| Kansas | 1 | 4 | ||
| Kentucky | 3 | 5 | ||
| Louisiana | 2 | 5 | ||
| Maine | 3 | 5 | ||
| Maryland | 5 | 5 | ||
| Massachusetts | 5 | 5 | ||
| Michigan | 4 | 5 | ||
| Minnesota | 3 | 5 | ||
| Mississippi | —* | —* | ||
| Missouri | 4 | 5 | ||
| Montana | 1 | 4 | ||
| Nebraska | 1 | 1 | ||
| Nevada | 2 | 5 | ||
| New Hampshire | —* | —* | ||
| New Jersey | 5 | 5 | ||
| New Mexico | 4 | 5 | ||
| New York | 5 | 5 | ||
| North Carolina | 3 | 5 | ||
| North Dakota | 3 | 5 | ||
| Ohio | 4 | 5 | ||
| Oklahoma | 3 | 3 | ||
| Oregon | 4 | 5 | ||
| Pennsylvania | 4 | 5 | ||
| Rhode Island | 5 | 5 | ||
| South Carolina | 2 | 4 | ||
| South Dakota | 1 | 2 | ||
| Tennessee | 2 | 5 | ||
| Texas | 2 | 3 | ||
| Utah | 3 | 5 | ||
| Vermont | 1 | 4 | ||
| Virgina | 2 | 5 | ||
| Washington | 5 | 5 | ||
| West Virginia | 4 | 5 | ||
| Wisconsin | 2 | 5 | ||
| Wyoming | 1 | 1 | ||
| Notes: Quintile 1: ≤17 per 100,000 population; Quintile 2: >17-22 per 100,000 population; Quintile 3: >22-31 per 100,000 population; Quintile 4: >31-45 per 100,000 population; Quintile 5: >45 per 100,000 population. * Indicates data unavailable. |
||||