|
STATISTICAL BRIEF #282
September 2021
Lawrence D. Reid, Ph.D., M.P.H., and Zhengyi Fang, M.S. Introduction Annually, there are approximately 35.5 million hospitalizations in the United States, including for medical conditions (48 percent), surgeries (20 percent), maternal conditions (11 percent), births and neonatal conditions (11 percent), mental health and substance use conditions (5 percent), and injuries (5 percent).1 With the COVID-19 pandemic beginning in early 2020, hospital utilization changed considerably, as areas of the country saw spikes in COVID-19 cases and subsequent hospitalizations. Hospitalizations related to COVID-19 varied by State and across time.2 In addition to changes in the need for hospital care, there were concerns about hospital capacity, as seen by the Centers for Medicare & Medicaid Services (CMS) recommendation that hospitals limit all nonessential planned surgeries and procedures.3 Little is known, however, about the impact of the initial period of the pandemic on hospitalizations and in-hospital deaths overall. This Healthcare Cost and Utilization Project (HCUP) Statistical Brief presents data from 13 States on the number of hospitalizations and in-hospital deaths across time periods and States with a focus on the initial impact of the COVID-19 pandemic. The counts are presented overall and by patient characteristics across 13 States from April to September 2020 using quarterly HCUP inpatient data compared with State-level averages from April to September in 2016-2019 using the HCUP State Inpatient Databases (SID). The percentages of all hospitalizations and in-hospital deaths related to COVID-19 during the April-September 2020 timeframe are also provided. Because of the large sample size of the HCUP data, small differences can be statistically significant but not meaningful. Thus, only differences greater than or equal to 10 percent are discussed in the text. This analysis is limited to discharges for patients treated in community, nonrehabilitation hospitals in 13 States (Colorado, Georgia, Iowa, Kentucky, Maryland, Michigan, Minnesota, Mississippi, Missouri, New Jersey, Ohio, South Carolina, and Vermont) for which HCUP data were available for April-September 2016-2019 and April-September 2020. These States account for 24.7 percent of the resident U.S. population in 2019.4,5 Information contained in this Statistical Brief was primarily obtained from the HCUP Summary Trend Tables.6 The Summary Trend Tables, accessed as downloadable tables, provide State-specific monthly trends in hospital utilization for the most recent HCUP data available. These tables were also used to create the HCUP Visualization of Inpatient Trends in COVID-19 and Other Conditions7 and will be updated as more quarterly data become available. |
Findings
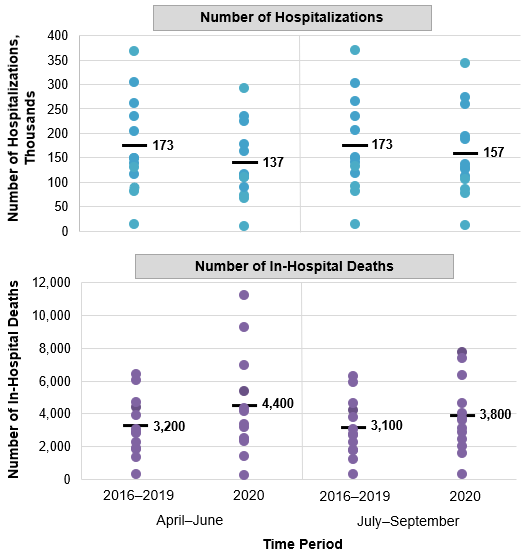
State-level hospitalizations and in-hospital deaths, 2016-2019 and 2020 Figure 1 displays the number of hospitalizations and in-hospital deaths for each of the 13 States in April-September 2016-2019 and 2020. Each dot in the figure represents the State-specific number of hospitalizations or in-hospital deaths. The average number of hospitalizations and in-hospital deaths across these 13 States is also presented.
|
|
Figure 1. Number of hospitalizations (in thousands) and in-hospital deaths in April-September 2020 compared with the average of April-September 2016-2019, by quarter, 13 States
Notes: Number of in-hospital deaths is rounded to the nearest hundred. Counts for 2016-2019 represent the mean number of hospitalizations or in-hospital deaths during April-September across these 4 years. Scatter plot that shows the number of hospitalizations and in-hospital deaths for 13 States in April-June and July-September 2016-2019 and 2020. April-June 2016-2019: The number of hospitalizations ranged from 14,000 to 368,000 (average = 173,000). The number of in-hospital deaths ranged from 300 to 6,400 (average = 3,200). April-June 2020: The number of hospitalizations ranged from 10,000 to 292,000 (average = 137,000). The number of in-hospital deaths ranged from 200 to 11,200 (average = 4,400). July-September 2016-2019: The number of hospitalizations ranged from 13,000 to 369,000 (average = 173,000). The number of in-hospital deaths ranged from 300 to 6,300 (average = 3,100). July-September 2020: The number of hospitalizations ranged from 12,000 to 344,000 (average = 157,000). The number of in-hospital deaths ranged from 300 to 7,800 (average = 3,800).
|
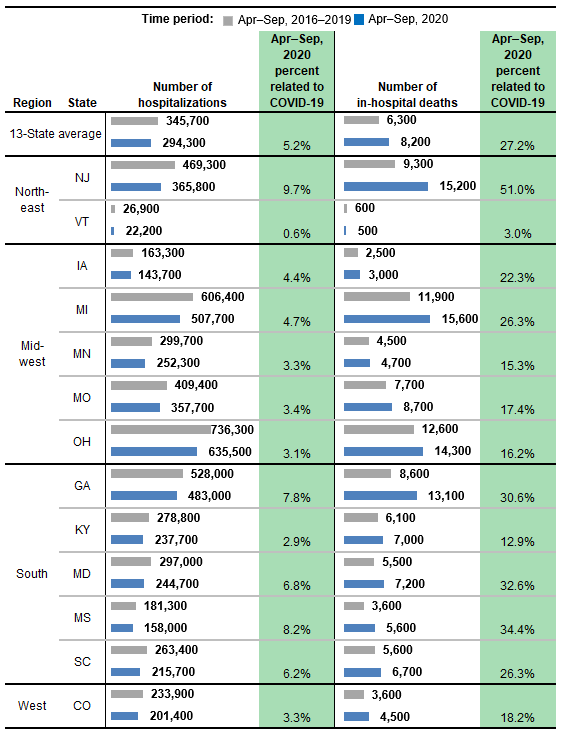
Figure 2 presents the number of hospitalizations and in-hospital deaths by State, comparing April-September 2020 with the average from April-September 2016-2019. The percentage of all hospitalizations and in-hospital deaths related to COVID-19 in April-September 2020 is also presented. States are listed in alphabetical order within U.S. census regions.
|
|
Figure 2. Number of hospitalizations, in-hospital deaths, and percentage of each related to COVID-19 in April-September 2020 compared with the average of all hospitalizations in April-September 2016-2019, 13 States
Notes: Number of hospitalizations and in-hospital deaths is rounded to the nearest hundred. Counts for 2016-2019 represent the mean number of hospitalizations or in-hospital deaths during April-September across these 4 years. Combined bar chart and table that shows the number of hospitalizations and in-hospital deaths in 13 States by State. The figure compares statistics for April-September 2020 with the average from April-September 2016-2019. It also presents the percentage of hospitalizations and in-hospital deaths related to COVID-19 in April-September 2020. Data are provided in Supplemental Table 1.
|
Patient characteristics associated with hospitalizations and in-hospital deaths, 2016-2019 and 2020
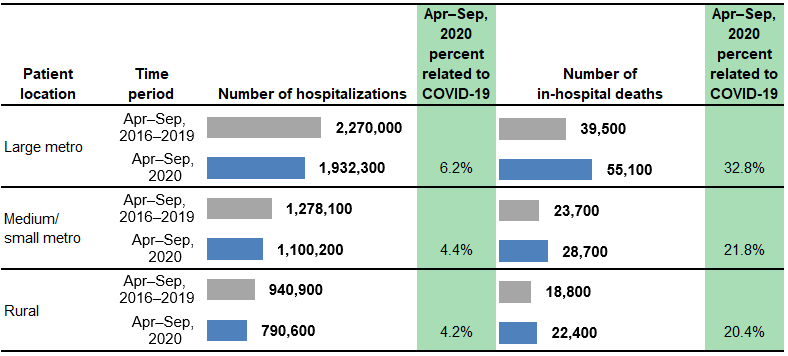
Figure 3 presents the number of hospitalizations and in-hospital deaths in 13 States combined by location of patient residence (large metro, medium/small metro, and rural), comparing April-September 2020 with the average from April-September 2016-2019. The percentage of hospitalizations and in-hospital deaths related to COVID-19 in April-September 2020 is also presented.
|
|
Figure 3. Number of hospitalizations, in-hospital deaths, and percentage of each related to COVID-19 by location of patient residence in April-September 2020 compared with the average of all hospitalizations in April-September 2016-2019, 13 States
Notes: Number of hospitalizations and in-hospital deaths is rounded to the nearest hundred. Counts for 2016-2019 represent the mean number of hospitalizations or in-hospital deaths during April-September across these 4 years. Combined bar chart and table that shows the number of hospitalizations and in-hospital deaths in 13 States by location of patient residence. The figure compares statistics for April-September 2020 with the average from April-September 2016-2019. It also presents the percentage of hospitalizations and in-hospital deaths related to COVID-19 in April-September 2020. Data are provided in Supplemental Table 2.
|
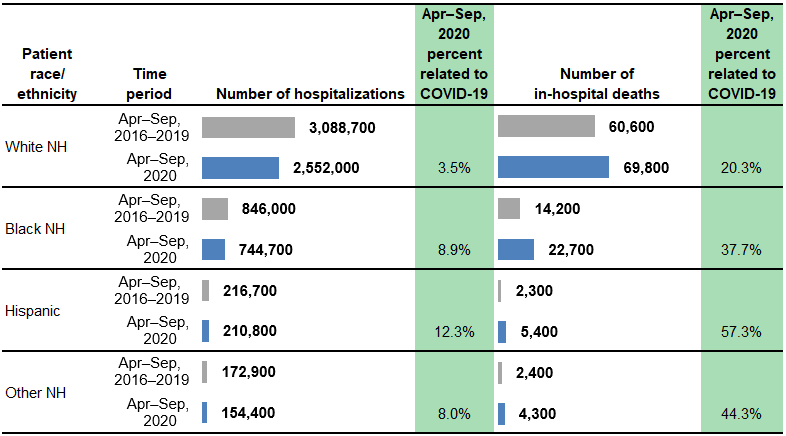
Figure 4 presents the number of hospitalizations and in-hospital deaths in 13 States combined by patient race/ethnicity, comparing April-September 2020 with the average from April-September 2016-2019. The percentage of hospitalizations and in-hospital deaths related to COVID-19 in April-September 2020 is also presented.
|
|
Figure 4. Number of hospitalizations, in-hospital deaths, and percentage of each related to COVID-19 by patient race/ethnicity in April-September 2020 compared with the average of all hospitalizations in April-September 2016-2019, 13 States
Abbreviation: NH, non-Hispanic Combined bar chart and table that shows the number of hospitalizations and in-hospital deaths in 13 States by patient race/ethnicity. The figure compares statistics for April-September 2020 with the average from April-September 2016-2019. It also presents the percentage of hospitalizations and in-hospital deaths related to COVID-19 in April-September 2020. Data are provided in Supplemental Table 3.
|
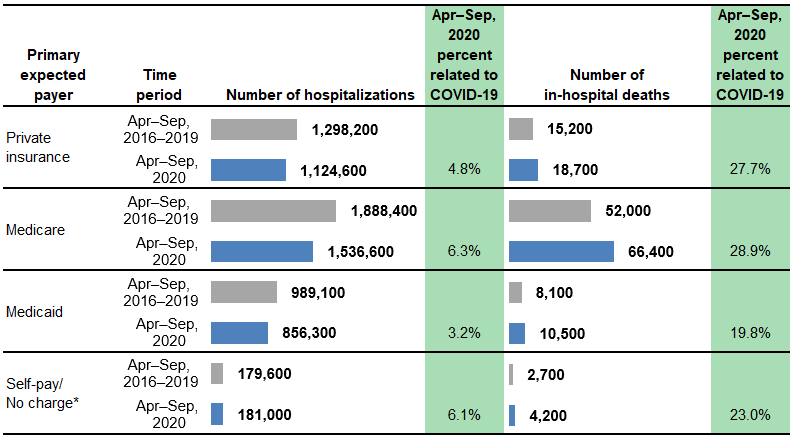
Figure 5 presents the number of hospitalizations and in-hospital deaths in 13 States combined by primary expected payer, comparing April-September 2020 with the average from April-September 2016-2019. The percentage of hospitalizations and in-hospital deaths related to COVID-19 in April-September 2020 is also presented.
|
|
Figure 5. Number of hospitalizations, in-hospital deaths, and percentage of each related to COVID-19 by primary expected payer in April-September 2020 compared with the average of all hospitalizations in April-September 2016-2019, 13 States
Notes: Number of hospitalizations and in-hospital deaths is rounded to the nearest hundred. Counts for 2016-2019 represent the mean number of hospitalizations or in-hospital deaths during April-September across these 4 years. Combined bar chart and table that shows the number of hospitalizations and in-hospital deaths in 13 States by primary expected payer. The figure compares statistics for April-September 2020 with the average from April-September 2016-2019. It also presents the percentage of hospitalizations and in-hospital deaths related to COVID-19 in April-September 2020. Data are provided in Supplemental Table 4.
|
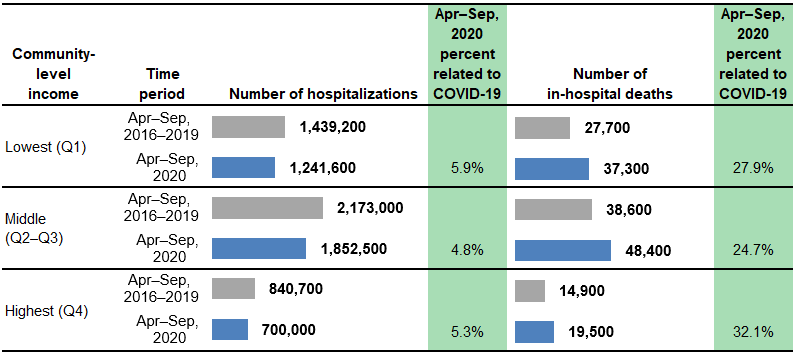
Figure 6 presents the number of hospitalizations and in-hospital deaths in 13 States combined by community-level income, comparing April-September 2020 with the average from April-September 2016-2019. The percentage of hospitalizations and in-hospital deaths related to COVID-19 in April-September 2020 is also presented.
|
|
Figure 6. Number of hospitalizations, in-hospital deaths, and percentage of each related to COVID-19 by community-level income in April-September 2020 compared with the average of all hospitalizations in April-September 2016-2019, 13 States
Abbreviation: Q, quartile Combined bar chart and table that shows the number of hospitalizations and in-hospital deaths in 13 States by community-level income. The figure compares statistics for April-September 2020 with the average from April-September 2016-2019. It also presents the percentage of hospitalizations and in-hospital deaths related to COVID-19 in April-September 2020. Data are provided in Supplemental Table 5.
|
References
1 Agency for Healthcare Research and Quality. HCUP Fast Stats - Trends in Inpatient Stays. Healthcare Cost and Utilization Project (HCUP). www.hcup-us.ahrq.govhttps://datatools.ahrq.gov/hcup-fast-stats?type=subtab&tab=hcupfsis&count=1. Accessed August 27, 2021. 2 Healthcare Cost and Utilization Project (HCUP) Statistical Briefs Series on COVID-19-Related Hospitalizations in 13 States (HCUP Statistical Briefs #273-276). June 2021. Agency for Healthcare Research and Quality, Rockville, MD. www.hcup-us.ahrq.gov/reports/statbriefs/statbriefs.jsp. Accessed August 29, 2021. 3 Centers for Medicare & Medicaid Services. CMS Adult Elective Surgery and Procedures Recommendations: Limit All Non-essential Planned Surgeries and Procedures, Including Dental, Until Further Notice. April 7, 2020. www.cms.gov/files/document/covid-elective-surgery-recommendations.pdf. Accessed August 27, 2021. 4 U.S. Census Bureau, Population Division. Annual Estimates of the Resident Population by Sex, Race, and Hispanic Origin for the United States: April 1, 2010 to July 1, 2019 (NC-EST2019-SR11H). June 2020. www.census.gov/newsroom/press-kits/2020/population-estimates-detailed.html. Accessed July 26, 2021. 5 U.S. Census Bureau, Population Division. Annual Estimates of the Resident Population by Sex, Race, and Hispanic Origin for Colorado, Georgia, Iowa, Kentucky, Maryland, Michigan, Minnesota, Mississippi, Missouri, New Jersey, Ohio, South Carolina, and Vermont: April 1, 2010 to July 1, 2019 (NC-EST2019-SR11H-nn). June 2020. www.census.gov/data/tables/time-series/demo/popest/2010s-state-detail.html. Accessed July 26, 2021. 6 Agency for Healthcare Research and Quality. HCUP Summary Trend Tables. Healthcare Cost and Utilization Project (HCUP). Updated December 2020. www.hcup-us.ahrq.gov/reports/trendtables/summarytrendtables.jsp. Accessed February 10, 2021. 7 Agency for Healthcare Research and Quality. HCUP Visualization of Inpatient Trends in COVID-19 and Other Conditions. Healthcare Cost and Utilization Project (HCUP). June 2021. www.hcup-us.ahrq.gov/datavisualizations/covid-19-inpatient-trends.jsp. Accessed July 26, 2021. About Statistical Briefs Healthcare Cost and Utilization Project (HCUP) Statistical Briefs provide basic descriptive statistics on a variety of topics using HCUP administrative healthcare data. Topics include hospital inpatient, ambulatory surgery, and emergency department use and costs, quality of care, access to care, medical conditions, procedures, and patient populations, among other topics. The reports are intended to generate hypotheses that can be further explored in other research; the reports are not designed to answer in-depth research questions using multivariate methods. Data Source The estimates in this Statistical Brief are based upon data from the HCUP 2016-2019 State Inpatient Databases (SID) and 2020 quarterly inpatient data. Information based on quarterly data should be considered preliminary, as additional quarterly data may become available over time. This analysis is limited to patients treated in community, nonrehabilitation hospitals in 13 States (Colorado, Georgia, Iowa, Kentucky, Maryland, Michigan, Minnesota, Mississippi, Missouri, New Jersey, Ohio, South Carolina, and Vermont) for which HCUP data were available for April-September 2016-2019 and April-September 2020. These States account for the following percentages of the resident U.S. population: 24.7 percent of the total population, 28.0 percent of the non-Hispanic White population, 32.7 percent of the non-Hispanic Black population, 11.9 percent of the Hispanic population, and 18.0 percent of the other non-Hispanic population, including but not limited to American Indian, Alaska Native, Asian, Native Hawaiian, and other Pacific Islander.1,2 All of the information contained in this Statistical Brief can be found in the HCUP Summary Trend Tables at www.hcup-us.ahrq.gov/reports/trendtables/summarytrendtables.jsp. The HCUP inpatient data contain the universe of the inpatient discharge abstracts in the participating HCUP States, translated into a uniform format to facilitate multistate comparisons and analyses. The inpatient data encompass more than 95 percent of all U.S. community hospital discharges. The inpatient data can be used to investigate questions unique to one State, to compare data from two or more States, to conduct market-area variation analyses, and to identify State-specific trends in inpatient care utilization, access, charges, and outcomes. Types of hospitals included in HCUP State Inpatient Databases (and quarterly inpatient data) This analysis used SID and quarterly inpatient data limited to information from community hospitals, which are defined as short-term, non-Federal, general, and other hospitals, excluding hospital units of other institutions (e.g., prisons). Community hospitals include obstetrics and gynecology, otolaryngology, orthopedic, cancer, pediatric, public, and academic medical center hospitals. Excluded for this analysis are long-term care facilities such as rehabilitation, psychiatric, and alcoholism and chemical dependency hospitals. However, if a patient received long-term care, rehabilitation, or treatment for a psychiatric or chemical dependency condition in a community hospital, the discharge record for that stay was included in the analysis. Definitions Diagnoses and ICD-10-CM The principal diagnosis is that condition established after study to be chiefly responsible for the patient's admission to the hospital. Secondary diagnoses are conditions that coexist at the time of admission that require or affect patient care treatment received or management, or that develop during the inpatient stay. All-listed diagnoses include the principal diagnosis plus the secondary conditions. ICD-10-CM is the International Classification of Diseases, Tenth Revision, Clinical Modification. There are over 70,000 ICD-10-CM diagnosis codes. Case definition COVID-19-related hospitalizations are identified by any-listed ICD-10-CM code of U07.1 (2019 novel coronavirus disease) on the discharge record. Per coding guidelines,a the use of U07.1 is based on documentation by the provider or documentation of a positive COVID-19 test result. The ICD-10-CM code for COVID-19 was implemented beginning April 1, 2020. As such, there may be some measurement error in the identification of cases. Unit of analysis The unit of analysis is the hospital discharge (i.e., the hospital stay), not a person or patient. This means that a person who is admitted to the hospital multiple times in 1 year will be counted each time as a separate discharge from the hospital. Location of patients' residence Place of residence is based on the urban-rural classification scheme for U.S. counties developed by the National Center for Health Statistics (NCHS) and based on the Office of Management and Budget (OMB) definition of a metropolitan service area as including a city and a population of at least 50,000 residents. For this Statistical Brief, we collapsed the NCHS codes into the following three categories: Large metropolitan (metro) area:
Data on Hispanic ethnicity are collected differently among the States and also can differ from the census methodology of collecting information on race (White, Black, Asian/Pacific Islander, American Indian/Alaska Native, Other [including mixed race]) separately from ethnicity (Hispanic, non-Hispanic). State data organizations often collect Hispanic ethnicity as one of several categories that include race. Therefore, for multistate analyses, HCUP creates the combined categorization of race and ethnicity for data from States that report ethnicity separately. When a State data organization collects Hispanic ethnicity separately from race, HCUP uses Hispanic ethnicity to override any other race category to create a Hispanic category for the uniformly coded race/ethnicity data element, while also retaining the original race and ethnicity data. This Statistical Brief reports race/ethnicity for the following categories: Hispanic, non-Hispanic White, non-Hispanic Black, and non-Hispanic Other (Asian/Pacific Islander, American Indian/Alaska Native, Other). Expected payer To make coding uniform across all HCUP data sources, the primary expected payer for the hospital stay combines detailed categories into general groups:
Prior to 2017, hospital stays that were expected to be billed to the State Children's Health Insurance Program (SCHIP) may be classified as Medicaid or Other, depending on the structure of the State program. Because most State data do not identify SCHIP as a separate expected payer, it is not possible to present this information separately. Beginning with 2017 data, hospital stays that were expected to be billed to SCHIP are included under Medicaid. For this Statistical Brief, when more than one payer is listed for a hospital discharge, the first-listed payer is used. Community-level income Community-level income is based on the median household income of the patient's ZIP Code of residence. Quartiles are defined so that the total U.S. population is evenly distributed. Cut-offs for the quartiles are determined annually using ZIP Code demographic data obtained from Claritas, a vendor that produces population estimates and projections based on data from the U.S. Census Bureau.b The value ranges for the income quartiles vary by year. Patients in the first quartile are designated as having the lowest income, patients in the middle two quartiles are designated as having middle income, and patients in the highest quartile are designated as having the highest income. The income quartile is missing for patients who are homeless or foreign. About HCUP The Healthcare Cost and Utilization Project (HCUP, pronounced "H-Cup") is a family of healthcare databases and related software tools and products developed through a Federal-State-Industry partnership and sponsored by the Agency for Healthcare Research and Quality (AHRQ). HCUP databases bring together the data collection efforts of State data organizations, hospital associations, and private data organizations (HCUP Partners) and the Federal government to create a national information resource of encounter-level healthcare data. HCUP includes the largest collection of longitudinal hospital care data in the United States, with all-payer, encounter-level information beginning in 1988. These databases enable research on a broad range of health policy issues, including cost and quality of health services, medical practice patterns, access to healthcare programs, and outcomes of treatments at the national, State, and local market levels. HCUP would not be possible without the contributions of the following data collection Partners from across the United States: |
|
Alaska Department of Health and Social Services Alaska State Hospital and Nursing Home Association Arizona Department of Health Services Arkansas Department of Health California Office of Statewide Health Planning and Development Colorado Hospital Association Connecticut Hospital Association Delaware Division of Public Health District of Columbia Hospital Association Florida Agency for Health Care Administration Georgia Hospital Association Hawaii Laulima Data Alliance Hawaii University of Hawai'i at Hilo Illinois Department of Public Health Indiana Hospital Association Iowa Hospital Association Kansas Hospital Association Kentucky Cabinet for Health and Family Services Louisiana Department of Health Maine Health Data Organization Maryland Health Services Cost Review Commission Massachusetts Center for Health Information and Analysis Michigan Health & Hospital Association Minnesota Hospital Association Mississippi State Department of Health Missouri Hospital Industry Data Institute |
Montana Hospital Association Nebraska Hospital Association Nevada Department of Health and Human Services New Hampshire Department of Health & Human Services New Jersey Department of Health New Mexico Department of Health New York State Department of Health North Carolina Department of Health and Human Services North Dakota (data provided by the Minnesota Hospital Association) Ohio Hospital Association Oklahoma State Department of Health Oregon Association of Hospitals and Health Systems Oregon Office of Health Analytics Pennsylvania Health Care Cost Containment Council Rhode Island Department of Health South Carolina Revenue and Fiscal Affairs Office South Dakota Association of Healthcare Organizations Tennessee Hospital Association Texas Department of State Health Services Utah Department of Health Vermont Association of Hospitals and Health Systems Virginia Health Information Washington State Department of Health West Virginia Department of Health and Human Resources, West Virginia Health Care Authority Wisconsin Department of Health Services Wyoming Hospital Association |
|
For More Information
For information on COVID-19 resources at AHRQ, refer to the AHRQ COVID-19 Resources page: www.ahrq.gov/coronavirus/index.html. For other information on COVID-19 healthcare utilization, refer to the HCUP Statistical Briefs located at www.hcup-us.ahrq.gov/reports/statbriefs/sb_covid.jsp. For additional HCUP statistics, visit:
For a detailed description of HCUP and more information on the design of the State Inpatient Databases (SID), please refer to the following database documentation: Agency for Healthcare Research and Quality. Overview of the State Inpatient Databases (SID). Healthcare Cost and Utilization Project (HCUP). Rockville, MD: Agency for Healthcare Research and Quality. Updated October 2020. www.hcup-us.ahrq.gov/sidoverview.jsp. Accessed January 22, 2021. Suggested Citation Reid LD (AHRQ), Fang Z (AHRQ). Changes in Hospitalizations and In-Hospital Deaths in the Initial Period of the COVID-19 Pandemic (April-September 2020), 13 States. HCUP Statistical Brief #282. September 2021. Agency for Healthcare Research and Quality, Rockville, MD. www.hcup-us.ahrq.gov/reports/statbriefs/sb282-COVID-19-AllHospital.pdf. Acknowledgments The authors would like to acknowledge the contributions of Marguerite Barrett of M.L. Barrett, Inc., in addition to Molly Hensche, Brendan Leonard, Minya Sheng, Audrey Weiss, and Jennifer Welch of IBM Watson Health. *** AHRQ welcomes questions and comments from readers of this publication who are interested in obtaining more information about access, cost, use, financing, and quality of healthcare in the United States. We also invite you to tell us how you are using this Statistical Brief and other HCUP data and tools, and to share suggestions on how HCUP products might be enhanced to further meet your needs. Please email us at hcup@ahrq.gov or send a letter to the address below:Joel W. Cohen, Ph.D., Director Center for Financing, Access and Cost Trends Agency for Healthcare Research and Quality 5600 Fishers Lane Rockville, MD 20857 This Statistical Brief was posted online on September 8, 2021. a Centers for Disease Control and Prevention, National Center for Health Statistics. ICD-10-C Official Guidelines for Coding and Reporting FY 2021 (October 1, 2020 - September 30, 2021). www.cdc.gov/nchs/data/icd/10cmguidelines-FY2021.pdf. Accessed March 18, 2021. b Claritas. Claritas Demographic Profile by ZIP Code. https://claritas360.claritas.com/mybestsegments/. |
| Supplemental Table 1. Number of hospitalizations, in-hospital deaths, and percentage of each related to COVID-19 in April-September 2020 compared with the average of all hospitalizations in April-September 2016-2019, 13 States, for data presented in Figure 2 | |||||||
| Region | State | Number of hospitalizations | Number of in-hospital deaths | ||||
|---|---|---|---|---|---|---|---|
| Apr-Sep, 2016-2019 average | Apr-Sep, 2020 | Apr-Sep, 2020 percent related to COVID-19 | Apr-Sep, 2016-2019 average | Apr-Sep, 2020 | Apr-Sep, 2020 percent related to COVID-19 | ||
| 13-State average | 345,700 | 294,300 | 5.2% | 6,300 | 8,200 | 27.2% | |
| Northeast | NJ | 469,300 | 365,800 | 9.7% | 9,300 | 15,200 | 51.0% |
| VT | 26,900 | 22,200 | 0.6% | 600 | 500 | 3.0% | |
| Midwest | IA | 163,300 | 143,700 | 4.4% | 2,500 | 3,000 | 22.3% |
| MI | 606,400 | 507,700 | 4.7% | 11,900 | 15,600 | 26.3% | |
| MN | 299,700 | 252,300 | 3.3% | 4,500 | 4,700 | 15.3% | |
| MO | 409,400 | 357,700 | 3.4% | 7,700 | 8,700 | 17.4% | |
| OH | 736,300 | 635,500 | 3.1% | 16,600 | 14,300 | 16.2% | |
| South | GA | 528,000 | 483,000 | 7.8% | 8,600 | 13,100 | 30.6% |
| KY | 278,800 | 237,700 | 2.9% | 6,100 | 7,000 | 12.9% | |
| MD | 297,000 | 244,700 | 6.8% | 5,500 | 7,200 | 32.6% | |
| MS | 181,300 | 158,000 | 8.2% | 3,600 | 5,600 | 34.4% | |
| SC | 263,400 | 215,700 | 6.2% | 5,600 | 6,700 | 26.3% | |
| West | CO | 233,900 | 201,400 | 3.3% | 3,600 | 4,500 | 18.2% |
| Supplemental Table 2. Number of hospitalizations, in-hospital deaths, and percentage of each related to COVID-19 by location of patient residence in April-September 2020 compared with the average of all hospitalizations in April-September 2016-2019, 13 States, for data presented in Figure 3 | |||||
| Patient location | Time period | Number of hospitalizations | Apr-Sep, 2020 percent related to COVID-19 | Number of in-hospital deaths | Apr-Sep, 2020 percent related to COVID-19 |
|---|---|---|---|---|---|
| Large metro | Apr-Sep, 2016-2019 | 2,270,000 | - | 39,500 | - |
| Apr-Sep, 2020 | 1,932,300 | 6.2% | 55,100 | 32.8% | |
| Medium/small metro | Apr-Sep, 2016-2019 | 1,278,100 | - | 23,700 | - |
| Apr-Sep, 2020 | 1,100,200 | 4.4% | 28,700 | 21.8% | |
| Rural | Apr-Sep, 2016-2019 | 949,900 | - | 18,800 | - |
| Apr-Sep, 2020 | 790,600 | 4.2% | 22,400 | 20.4% | |
| Supplemental Table 3. Number of hospitalizations, in-hospital deaths, and percentage of each related to COVID-19 by patient race/ethnicity in April-September 2020 compared with the average of all hospitalizations in April-September 2016-2019, 13 States, for data presented in Figure 4 | |||||
| Patient race/ethnicity | Time period | Number of hospitalizations | Apr-Sep, 2020 percent related to COVID-19 | Number of in-hospital deaths | Apr-Sep, 2020 percent related to COVID-19 |
|---|---|---|---|---|---|
| White Non-Hispanic | Apr-Sep, 2016-2019 | 3,088,700 | - | 60,600 | - |
| Apr-Sep, 2020 | 2,552,000 | 3.5% | 69,800 | 20.3% | |
| Black Non-Hispanic | Apr-Sep, 2016-2019 | 846,000 | - | 14,200 | - |
| Apr-Sep, 2020 | 744,700 | 8.9% | 22,700 | 37.7% | |
| Hispanic | Apr-Sep, 2016-2019 | 216,700 | - | 2,300 | - |
| Apr-Sep, 2020 | 210,800 | 12.3% | 5,400 | 57.3% | |
| Other Non-Hispanic | Apr-Sep, 2016-2019 | 172,900 | - | 2,400 | - |
| Apr-Sep, 2020 | 154,400 | 8.0% | 4,300 | 44.3% | |
| Supplemental Table 4. Number of hospitalizations, in-hospital deaths, and percentage of each related to COVID-19 by primary expected payer in April-September 2020 compared with the average of all hospitalizations in April-September 2016-2019, 13 States, for data presented in Figure 5 | |||||
| Primary expected payer | Time period | Number of hospitalizations | Apr-Sep, 2020 percent related to COVID-19 | Number of in-hospital deaths | Apr-Sep, 2020 percent related to COVID-19 |
|---|---|---|---|---|---|
| Private insurance | Apr-Sep, 2016-2019 | 1,298,200 | - | 15,200 | - |
| Apr-Sep, 2020 | 1,124,600 | 4.8% | 18,700 | 27.7% | |
| Medicare | Apr-Sep, 2016-2019 | 1,888,400 | - | 52,000 | - |
| Apr-Sep, 2020 | 1,536,600 | 6.3% | 66,400 | 28.9% | |
| Medicaid | Apr-Sep, 2016-2019 | 989,100 | - | 8,100 | - |
| Apr-Sep, 2020 | 856,300 | 3.2% | 10,500 | 19.8% | |
| Self-pay/No charge* | Apr-Sep, 2016-2019 | 179,600 | - | 2,700 | - |
| Apr-Sep, 2020 | 181,000 | 6.1% | 4,200 | 23.0% | |
| * Self-pay/No charge: includes self-pay, no charge, charity, and no expected payment. | |||||
| Supplemental Table 5. Number of hospitalizations, in-hospital deaths, and percentage of each related to COVID-19 by community-level income in April-September 2020 compared with the average of all hospitalizations in April-September 2016-2019, 13 States, for data presented in Figure 6 | |||||
| Community-level income | Time period | Number of hospitalizations | Apr-Sep, 2020 percent related to COVID-19 | Number of in-hospital deaths | Apr-Sep, 2020 percent related to COVID-19 |
|---|---|---|---|---|---|
| Lowest (Q1) | Apr-Sep, 2016-2019 | 1,439,200 | - | 27,700 | - |
| Apr-Sep, 2020 | 1,241,600 | 5.9% | 37,300 | 27.9% | |
| Middle (Q2-Q3) | Apr-Sep, 2016-2019 | 2,173,000 | - | 38,600 | - |
| Apr-Sep, 2020 | 1,852,500 | 4.8% | 48,400 | 24.7% | |
| Highest (Q4) | Apr-Sep, 2016-2019 | 840,700 | - | 14,900 | - |
| Apr-Sep, 2020 | 700,000 | 5.3% | 19,500 | 32.1% | |