|
STATISTICAL BRIEF #286
December 2021
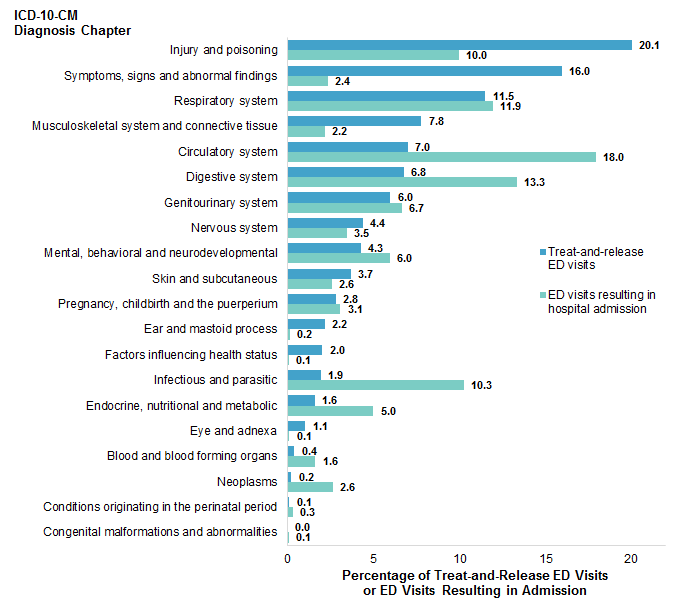
Audrey J. Weiss, Ph.D., and H. Joanna Jiang, Ph.D. Introduction Each year, one in five Americans visits the emergency department (ED) at least once.1,2 Patients with serious conditions are stabilized in the ED and then admitted to the hospital. However, most patients seen in the ED are treated and then discharged without hospital admission.3 Many of these individuals seek ED care for urgent symptoms, but other treat-and-release ED visits are for nonurgent conditions that may reflect problems with community access to and availability of primary and preventive care, lack of a regular healthcare provider, or limited health insurance coverage.4 These types of ED visits, which either are potentially preventable or could be handled in other ambulatory care settings, are concerning because they may result in ED crowding and longer wait times for those who require emergency care.4 ED visits also are more costly than other types of outpatient visits.5 Understanding the specific diagnoses among patients treated in the ED may be useful for ED resource planning and to inform efforts aimed at optimizing the use of ED services and other types of outpatient care. This Healthcare Cost and Utilization Project (HCUP) Statistical Brief presents statistics on the most common reasons for ED visits using weighted estimates from the 2018 Nationwide Emergency Department Sample (NEDS). The most common first-listed or principal diagnoses, organized by body system or condition, are presented for visits that result in discharge from the ED without hospital admission (treat-and-release) and for ED visits that result in admission to the hospital. The most frequent specific first-listed diagnoses among treat-and-release ED visits also are provided overall and by patient sex, age group, and primary expected payer.a Note that these data reflect a time period prior to the COVID-19 pandemic. Findings Most frequent reasons for ED visits, 2018 Figure 1 presents the most common general reasons for ED visits by ED visit type in 2018. In particular, the percentage of treat-and-release ED visits with each first-listed diagnosis is presented out of all treat-and-release ED visits (123.4 million visits), and the percentage of ED visits resulting in hospital admission with each principal diagnosis is presented out of all ED visits resulting in hospital admission (20.1 million visits). Diagnoses are classified by body system or condition using chapters from the International Classification of Diseases, Tenth Revision, Clinical Modification. Statistics in the figure are sorted by the most common diagnoses among treat-and-release ED visits. |
|
Figure 1. Percentage of first-listed or principal diagnoses by body system or condition and ED visit type, 2018
Abbreviations: ED, emergency department; ICD-10-CM, International Classification of Diseases, Tenth Revision, Clinical Modification Bar chart that shows the most common general reasons for ED visits, including the percentage of the first-listed or principal diagnosis by visit type (treat-and-release ED visit vs. ED visit resulting in hospital admission) and by body system in 2018. Data are provided in Supplemental Table 1.
|
|
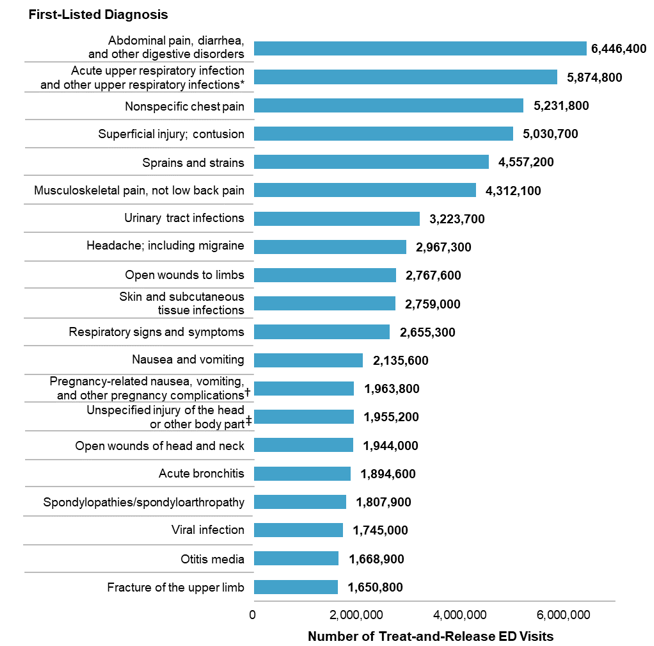
Figure 2. Top 20 first-listed diagnoses with the highest number of treat-and-release ED visits, 2018
Abbreviations: ED, emergency department; ICD-10-CM, International Classification of Diseases, Tenth Revision, Clinical Modification Bar chart that shows the 20 most common specific first-listed diagnoses among treat-and-release ED visits in 2018. Abdominal pain, diarrhea, and other digestive disorders: 6,446,400. Acute upper respiratory infection and other upper respiratory infections (primarily includes acute upper respiratory infection, acute pharyngitis, and streptococcal pharyngitis as well as other select specified upper respiratory infections): 5,874,800. Nonspecific chest pain: 5,231,800. Superficial injury; contusion: 5,030,700. Sprains and strains: 4,557,200. Musculoskeletal pain, not low back pain: 4,312,100. Urinary tract infections: 3,223,700. Headache; including migraine: 2,967,300. Open wounds to limbs: 2,767,600. Skin and subcutaneous tissue infections: 2,759,000. Respiratory signs and symptoms: 2,655,300. Nausea and vomiting: 2,135,600. Pregnancy-related nausea, vomiting, and other pregnancy complications (includes mild hyperemesis gravidarum, vomiting of pregnancy, and other select complications in pregnancy): 1,963,800. Unspecified injury of the head or other body part (primarily includes unspecified injury of the head as well as unspecified injury of other body parts): 1,955,200. Open wounds of head and neck: 1,944,000. Acute bronchitis: 1,894,600. Spondylopathies/spondyloarthropathy: 1,807,900. Viral infection: 1,745,000. Otitis media: 1,668,900. Fracture of the upper limb: 1,650,800.
|
|
Figure 3. Rate per 1,000 population of ED visits by patient characteristics and ED visit type, 2018
Abbreviations: ED, emergency department; metro, metropolitan Bar chart that shows the rate of ED visits per 1,000 population by select patient characteristics and ED visit type (treat-and-release ED visit vs. ED visit resulting in hospital admission) in 2018. Data are provided in Supplemental Table 2.
|
| Table 1. Top 10 first-listed diagnoses among treat-and-release ED visits by patient sex, 2018 | ||||
| First-listed diagnosis | Males | Females | ||
|---|---|---|---|---|
| Number | Rank | Number | Rank | |
| Total treat-and-release ED visits | 54,546,900 | - | 68,838,800 | - |
| Acute upper respiratory infection and other upper respiratory infections* | 2,640,400 | 1 | 3,234,100 | 2 |
| Superficial injury; contusion | 2,383,300 | 2 | 2,647,100 | 5 |
| Nonspecific chest pain | 2,324,500 | 3 | 2,907,200 | 3 |
| Abdominal pain, diarrhea, and other digestive symptoms | 2,271,800 | 4 | 4,174,300 | 1 |
| Sprains and strains | 2,018,100 | 5 | 2,538,900 | 6 |
| Musculoskeletal pain, not low back pain | 1,840,700 | 6 | 2,471,200 | 7 |
| Open wounds to limbs | 1,684,800 | 7 | ||
| Skin and subcutaneous tissue infections | 1,437,500 | 8 | ||
| Respiratory signs and symptoms | 1,247,800 | 9 | 1,407,400 | 10 |
| Open wounds of head and neck | 1,213,600 | 10 | ||
| Urinary tract infections | 2,664,100 | 4 | ||
| Headache; including migraine | 2,103,200 | 8 | ||
| Pregnancy-related nausea, vomiting, and other pregnancy complications† | 1,963,800 | 9 | ||
| Abbreviations: ED, emergency department; ICD-10-CM, International Classification of Diseases, Tenth Revision, Clinical Modification Notes: Diagnoses are grouped using the Clinical Classifications Software Refined (CCSR) for ICD-10-CM Diagnoses (www.hcup-us.ahrq.gov/toolssoftware/ccsr/ccs_refined.jsp). First-listed diagnosis is assigned to a single default CCSR category. Number of ED visits is shown only for the top 10 diagnoses for each sex, and values are rounded to the nearest 100. * This primarily includes acute upper respiratory infection, acute pharyngitis, and streptococcal pharyngitis as well as other select specified upper respiratory infections. † This includes mild hyperemesis gravidarum, vomiting of pregnancy, and other select complications in pregnancy. Source: Agency for Healthcare Research and Quality (AHRQ), Healthcare Cost and Utilization Project (HCUP), Nationwide Emergency Department Sample (NEDS), 2018 | ||||
| Table 2. Top 10 first-listed diagnoses among treat-and-release ED visits by patient age group, 2018 | ||||||
| First-listed diagnosis | 0-17 years | 18-64 years | 65+ years | |||
|---|---|---|---|---|---|---|
| Number | Rank | Number | Rank | Number | Rank | |
| Total treat-and-release ED visits | 27,592,500 | - | 76,154,000 | - | 19,644,500 | - |
| Acute upper respiratory infection and other upper respiratory infections* | 3,491,100 | 1 | 2,188,400 | 7 | ||
| Superficial injury; contusion | 1,402,200 | 2 | 2,706,400 | 5 | 922,000 | 2 |
| Otitis media | 1,320,000 | 3 | ||||
| Abdominal pain, diarrhea, and other digestive symptoms | 1,076,400 | 4 | 4,606,200 | 1 | 763,800 | 5 |
| Viral infection | 972,000 | 5 | ||||
| Fever | 964,300 | 6 | ||||
| Open wounds of head and neck | 877,000 | 7 | ||||
| Sprains and strains | 821,600 | 8 | 3,298,800 | 3 | 436,800 | 7 |
| Influenza | 799,700 | 9 | ||||
| Nausea and vomiting | 777,200 | 10 | ||||
| Nonspecific chest pain | 3,912,600 | 2 | 1,087,000 | 1 | ||
| Musculoskeletal pain, not low back pain | 3,036,500 | 4 | 791,700 | 3 | ||
| Headache; including migraine | 2,348,300 | 6 | ||||
| Urinary tract infections | 2,060,800 | 8 | 764,900 | 4 | ||
| Skin and subcutaneous tissue infections | 1,968,200 | 9 | ||||
| Pregnancy-related nausea, vomiting, and other pregnancy complications† | 1,907,600 | 10 | ||||
| Respiratory signs and symptoms | 635,400 | 6 | ||||
| Open wounds to limbs | 407,400 | 8 | ||||
| Dizziness and hallucinations | 393,800 | 9 | ||||
| Syncope (fainting) | 388,000 | 10 | ||||
| Abbreviations: ED, emergency department; ICD-10-CM, International Classification of Diseases, Tenth Revision, Clinical Modification Notes: Diagnoses are grouped using the Clinical Classifications Software Refined (CCSR) for ICD-10-CM Diagnoses (www.hcup-us.ahrq.gov/toolssoftware/ccsr/ccs_refined.jsp). First-listed diagnosis is assigned to a single default CCSR category. Number of ED visits is shown only for the top 10 diagnoses for each age group, and values are rounded to the nearest 100. * This primarily includes acute upper respiratory infection, acute pharyngitis, and streptococcal pharyngitis as well as other select specified upper respiratory infections. † This includes mild hyperemesis gravidarum, vomiting of pregnancy, and other select complications in pregnancy. Source: Agency for Healthcare Research and Quality (AHRQ), Healthcare Cost and Utilization Project (HCUP), Nationwide Emergency Department Sample (NEDS), 2018 | ||||||
| Table 3. Top 10 first-listed diagnoses among treat-and-release ED visits by primary expected payer, 2018 | ||||||||
| First-listed diagnosis | Medicare | Private insurance | Medicaid | Self-pay/ No charge* | ||||
|---|---|---|---|---|---|---|---|---|
| Number | Rank | Number | Rank | Number | Rank | Number | Rank | |
| Total treat-and-release ED visits | 24,073,000 | - | 35,544,500 | - | 42,701,500 | - | 16,168,800 | - |
| Nonspecific chest pain | 1,371,900 | 1 | 1,841,700 | 2 | 1,228,200 | 6 | 622,500 | 5 |
| Abdominal pain, diarrhea, and other digestive symptoms | 1,081,700 | 2 | 2,137,400 | 1 | 2,219,700 | 2 | 823,300 | 1 |
| Superficial injury; contusion | 1,026,600 | 3 | 1,433,900 | 4 | 1,601,800 | 3 | 629,800 | 4 |
| Musculoskeletal pain, not low back pain | 1,025,800 | 4 | 1,158,300 | 6 | 1,334,200 | 4 | 590,600 | 6 |
| Urinary tract infections | 858,100 | 5 | 794,600 | 9 | 1,025,700 | 9 | 463,300 | 8 |
| Respiratory signs and symptoms | 717,100 | 6 | 683,200 | 10 | ||||
| Sprains and strains | 546,900 | 7 | 1,637,900 | 3 | 1,318,800 | 5 | 671,700 | 3 |
| Skin and subcutaneous tissue infections | 458,100 | 8 | 1,014,100 | 10 | 522,800 | 7 | ||
| Open wounds to limbs | 447,800 | 9 | 901,900 | 8 | 426,000 | 2 | ||
| Chronic obstructive pulmonary disease and bronchiectasis | 442,100 | 10 | ||||||
| Acute upper respiratory infection and other upper respiratory infections† | 1,398,900 | 5 | 3,286,000 | 1 | 737,600 | 2 | ||
| Pregnancy-related nausea, vomiting, and other pregnancy complications‡ | 1,158,200 | 7 | ||||||
| Otitis media | 1,062,700 | 8 | ||||||
| Headache; including migraine | 1,034,900 | 7 | ||||||
| Disorders of teeth and gingiva | 433,200 | 9 | ||||||
| Abbreviations: ED, emergency department; ICD-10-CM, International Classification of Diseases, Tenth Revision, Clinical Modification Notes: Diagnoses are grouped using the Clinical Classifications Software Refined (CCSR) for ICD-10-CM Diagnoses (www.hcup-us.ahrq.gov/toolssoftware/ccsr/ccs_refined.jsp). First-listed diagnosis is assigned to a single default CCSR category. Number of ED visits is shown only for the top 10 diagnoses for each payer, and values are rounded to the nearest 100. * Self-pay/No charge: includes self-pay, no charge, charity, and no expected payment. † This primarily includes acute upper respiratory infection, acute pharyngitis, and streptococcal pharyngitis as well as other select specified upper respiratory infections. ‡ This includes mild hyperemesis gravidarum, vomiting of pregnancy, and other select complications in pregnancy. Source: Agency for Healthcare Research and Quality (AHRQ), Healthcare Cost and Utilization Project (HCUP), Nationwide Emergency Department Sample (NEDS), 2018 | ||||||||
References 1 National Center for Health Statistics. Table 36: Emergency department visits within the past 12 months among children under age 18, by selected characteristics: United States, selected years 1997-2018. Health, United States, 2019. www.cdc.gov/nchs/data/hus/2019/036-508.pdf. Accessed September 14, 2021. 2 National Center for Health Statistics. Table 37: Emergency department visits within the past 12 months among adults aged 18 and over, by selected characteristics: United States, selected years 1997-2018. Health, United States, 2019. www.cdc.gov/nchs/data/hus/2019/037-508.pdf. Accessed September 14, 2021. 3 Sun R, Karaca Z, Wong HS. Trends in Hospital Emergency Department Visits by Age and Payer, 2006-2015. HCUP Statistical Brief #238. March 2018. Agency for Healthcare Research and Quality, Rockville, MD. www.hcup-us.ahrq.gov/reports/statbriefs/sb238-Emergency-Department-Age-Payer-2006-2015.pdf. Accessed September 15, 2021. 4 Office of the Assistant Secretary for Planning and Evaluation. Report to Congress: Trends in the Utilization of Emergency Department Services, 2009-2018. March 2, 2021. www.aspe.hhs.gov/sites/default/files/private/pdf/265086/ED-report-to-Congress.pdf. Accessed September 15, 2021. 5 Ho V, Metcalfe L, Dark C, Vu L, Weber E, Shelton Jr E, et al. Comparing utilization and costs of care in freestanding emergency departments, hospital emergency departments, and urgent care centers. Annals of Emergency Medicine. 2017;70(6):846-57. About Statistical Briefs Healthcare Cost and Utilization Project (HCUP) Statistical Briefs provide basic descriptive statistics on a variety of topics using HCUP administrative healthcare data. Topics include hospital inpatient, ambulatory surgery, and emergency department use and costs, quality of care, access to care, medical conditions, procedures, and patient populations, among other topics. The reports are intended to generate hypotheses that can be further explored in other research; the reports are not designed to answer in-depth research questions using multivariate methods. Data Source The estimates in this Statistical Brief are based upon data from the HCUP 2018 Nationwide Emergency Department Sample (NEDS). Supplemental sources included population denominator data from Claritas, a vendor that produces population estimates and projections based on data from the U.S. Census Bureau.b Definitions Diagnoses, ICD-10-CM, and Clinical Classifications Software Refined (CCSR) for ICD-10-CM Diagnoses For emergency department (ED) visits that are treated and released, the first-listed diagnosis represents the condition, symptom, or problem identified in the medical record to be chiefly responsible for the ED services provided. In cases where the first-listed diagnosis is a symptom or problem, a diagnosis has not been established (confirmed) by the provider. For ED visits that result in an inpatient admission, the first-listed diagnosis is the principal diagnosis, the condition established after study to be chiefly responsible for the patient's admission to the hospital. Secondary diagnoses are conditions that coexist at the time of the ED visit or inpatient admission, that require or affect patient care treatment received or management, or that develop during the inpatient stay. All-listed diagnoses include the first-listed (principal) diagnosis plus the secondary conditions. ICD-10-CM is the International Classification of Diseases, Tenth Revision, Clinical Modification. There are over 70,000 ICD-10-CM diagnosis codes. The CCSR aggregates ICD-10-CM diagnosis codes into a manageable number of clinically meaningful categories.c The CCSR is intended to be used analytically to examine patterns of healthcare in terms of cost, utilization, and outcomes; rank utilization by diagnoses; and risk-adjust by clinical condition. The CCSR capitalizes on the specificity of the ICD-10-CM coding scheme and allows ICD-10-CM codes to be classified in more than one category. Approximately 10 percent of diagnosis codes are associated with more than one CCSR category because the diagnosis code documents either multiple conditions or a condition along with a common symptom or manifestation. For this Statistical Brief, the first-listed diagnosis code is assigned to a single default CCSR based on clinical coding guidelines, etiology and pathology of diseases, and standards set by other Federal agencies. The assignment of the default CCSR for the first-listed diagnosis for outpatient data is available starting with version v2021.1 of the software tool. ICD-10-CM coding definitions for each CCSR category presented in this Statistical Brief can be found in the CCSR reference file, available at www.hcup-us.ahrq.gov/toolssoftware/ccsr/ccs_refined.jsp#download. For this Statistical Brief, v2021.1 of the CCSR was used. A complete list of the frequencies of treat-and-release ED visits and ED visits resulting in hospital admission by first-listed or principal diagnosis and by CCSR category for the first-listed or principal diagnosis is available in the Frequencies by Diagnosis and Procedure Codes, NEDS 2016-2019 file, available at www.hcup-us.ahrq.gov/db/nation/neds/nedsdbdocumentation.jsp. Types of hospitals included in the HCUP Nationwide Emergency Department Sample The Nationwide Emergency Department Sample (NEDS) is based on ED data from community acute care hospitals, which are defined as short-term, non-Federal, general, and other specialty hospitals available to the public. Included among community hospitals are pediatric institutions and hospitals that are part of academic medical centers. Excluded are long-term care facilities such as rehabilitation, psychiatric, and alcoholism and chemical dependency hospitals. Hospitals included in the NEDS have EDs, and no more than 90 percent of their ED visits result in admission. ED visits ED visits include information on all visits to hospital-owned EDs regardless of whether the patient was treated and released from that ED or admitted to the same hospital from the ED. Treat-and-release ED visits Treat-and-release ED visits were defined as those ED visits in which patients were treated and then released from the ED; that is, patients were not admitted to the specific hospital associated with the ED. In 2018, although the vast majority of patients discharged from the ED were discharged home (94.2 percent), a small proportion of patients were transferred to another acute care facility (1.9 percent), were discharged to another type of long-term or intermediate care facility (nursing home or psychiatric treatment facility; 1.7 percent), left against medical advice (1.7 percent), were referred to home healthcare (0.3 percent), died (0.2 percent), or were discharged alive but the destination was unknown (0.1 percent). ED visits resulting in admission to the same hospital ED visits resulting in admission to the same hospital included those ED visits in which patients initially seen in the ED were then admitted to the specific hospital associated with that ED. Unit of analysis The unit of analysis is the ED visit, not a person or patient. This means that a person who is seen in the ED multiple times in 1 year will be counted each time as a separate visit in the ED. Population rates Rates of ED visits per 1,000 population were calculated using 2018 ED visit totals in the numerator and Claritasd estimates of the 2018 U.S. population in the denominator. Individuals seen in the ED multiple times are counted more than once in the numerator. Population rate of ED visits equals the number of ED visits divided by the number of U.S. residents multiplied by 1,000 Location of patients' residence Place of residence is based on the urban-rural classification scheme for U.S. counties developed by the National Center for Health Statistics (NCHS) and based on the Office of Management and Budget (OMB) definition of a metropolitan service area as including a city and a population of at least 50,000 residents:
Community-level income Community-level income is based on the median household income of the patient's ZIP Code of residence. Quartiles are defined so that the total U.S. population is evenly distributed. Cut-offs for the quartiles are determined annually using ZIP Code demographic data obtained from Claritas, a vendor that produces population estimates and projections based on data from the U.S. Census Bureau.e The value ranges for the income quartiles vary by year. The income quartile is missing for patients who are homeless or foreign. Expected payer To make coding uniform across all HCUP data sources, the primary expected payer for the ED visit combines detailed categories into general groups:
For this Statistical Brief, when more than one payer is listed for an ED visit, the first-listed payer is used. About HCUP The Healthcare Cost and Utilization Project (HCUP, pronounced "H-Cup") is a family of healthcare databases and related software tools and products developed through a Federal-State-Industry partnership and sponsored by the Agency for Healthcare Research and Quality (AHRQ). HCUP databases bring together the data collection efforts of State data organizations, hospital associations, and private data organizations (HCUP Partners) and the Federal government to create a national information resource of encounter-level healthcare data. HCUP includes the largest collection of longitudinal hospital care data in the United States, with all-payer, encounter-level information beginning in 1988. These databases enable research on a broad range of health policy issues, including cost and quality of health services, medical practice patterns, access to healthcare programs, and outcomes of treatments at the national, State, and local market levels. HCUP would not be possible without the contributions of the following data collection Partners from across the United States: |
|
Alaska Department of Health and Social Services Alaska State Hospital and Nursing Home Association Arizona Department of Health Services Arkansas Department of Health California Office of Statewide Health Planning and Development Colorado Hospital Association Connecticut Hospital Association Delaware Division of Public Health District of Columbia Hospital Association Florida Agency for Health Care Administration Georgia Hospital Association Hawaii Laulima Data Alliance Hawaii University of Hawai'i at Hilo Illinois Department of Public Health Indiana Hospital Association Iowa Hospital Association Kansas Hospital Association Kentucky Cabinet for Health and Family Services Louisiana Department of Health Maine Health Data Organization Maryland Health Services Cost Review Commission Massachusetts Center for Health Information and Analysis Michigan Health & Hospital Association Minnesota Hospital Association Mississippi State Department of Health Missouri Hospital Industry Data Institute |
Montana Hospital Association Nebraska Hospital Association Nevada Department of Health and Human Services New Hampshire Department of Health & Human Services New Jersey Department of Health New Mexico Department of Health New York State Department of Health North Carolina Department of Health and Human Services North Dakota (data provided by the Minnesota Hospital Association) Ohio Hospital Association Oklahoma State Department of Health Oregon Association of Hospitals and Health Systems Oregon Office of Health Analytics Pennsylvania Health Care Cost Containment Council Rhode Island Department of Health South Carolina Revenue and Fiscal Affairs Office South Dakota Association of Healthcare Organizations Tennessee Hospital Association Texas Department of State Health Services Utah Department of Health Vermont Association of Hospitals and Health Systems Virginia Health Information Washington State Department of Health West Virginia Department of Health and Human Resources, West Virginia Health Care Authority Wisconsin Department of Health Services Wyoming Hospital Association |
|
About the NEDS
The HCUP Nationwide Emergency Department Sample (NEDS) is a unique and powerful database that yields national estimates of emergency department (ED) visits. The NEDS was constructed using records from both the HCUP State Emergency Department Databases (SEDD) and the State Inpatient Databases (SID). The SEDD capture information on ED visits that do not result in an admission (i.e., patients who were treated in the ED and then released from the ED, or patients who were transferred to another hospital); the SID contain information on patients initially seen in the ED and then admitted to the same hospital. The NEDS was created to enable analyses of ED utilization patterns and support public health professionals, administrators, policymakers, and clinicians in their decision making regarding this critical source of care. The NEDS is produced annually beginning in 2006. Over time, the sampling frame for the NEDS has changed; thus, the number of States contributing to the NEDS varies from year to year. The NEDS is intended for national estimates only; no State-level estimates can be produced. The unweighted sample size for the 2018 NEDS is 35,807,950 (weighted, this represents 143,454,430 ED visits). For More Information For other information on emergency department visits, refer to the HCUP Statistical Briefs located at www.hcup-us.ahrq.gov/reports/statbriefs/sb_ed.jsp. For additional HCUP statistics, visit:
For a detailed description of HCUP and more information on the design of the Nationwide Emergency Department Sample (NEDS), please refer to the following database documentation: Agency for Healthcare Research and Quality. Overview of the Nationwide Emergency Department Sample (NEDS). Healthcare Cost and Utilization Project (HCUP). Rockville, MD: Agency for Healthcare Research and Quality. Updated November 2020. www.hcup-us.ahrq.gov/nedsoverview.jsp. Accessed January 22, 2021. Suggested Citation Weiss AJ (IBM Watson Health), Jiang HJ (AHRQ). Most Frequent Reasons for Emergency Department Visits, 2018. HCUP Statistical Brief #286. December 2021. Agency for Healthcare Research and Quality, Rockville, MD. www.hcup-us.ahrq.gov/reports/statbriefs/sb286-ED-Frequent-Conditions-2018.pdf. Acknowledgments The authors would like to acknowledge the contributions of Minya Sheng of IBM Watson Health. *** AHRQ welcomes questions and comments from readers of this publication who are interested in obtaining more information about access, cost, use, financing, and quality of healthcare in the United States. We also invite you to tell us how you are using this Statistical Brief and other HCUP data and tools, and to share suggestions on how HCUP products might be enhanced to further meet your needs. Please email us at hcup@ahrq.gov or send a letter to the address below:Joel W. Cohen, Ph.D., Director Center for Financing, Access and Cost Trends Agency for Healthcare Research and Quality 5600 Fishers Lane Rockville, MD 20857 This Statistical Brief was posted online on December 15, 2021. a For ED visits that are treated and released, the first-listed diagnosis represents the condition, symptom, or problem identified in the medical record to be chiefly responsible for the ED services provided. In cases where the first-listed diagnosis is a symptom or problem, a diagnosis has not been established (confirmed) by the provider. Information on the most common diagnoses in 2018 among hospital inpatient stays, which include those that originated in the ED, is provided in HCUP Statistical Brief #277 (www.hcup-us.ahrq.gov/reports/statbriefs/sb277-Top-Reasons-Hospital-Stays-2018.pdf). b Claritas. Claritas Demographic Profile by ZIP Code. https://claritas360.claritas.com/mybestsegments/. c Agency for Healthcare Research and Quality. HCUP Clinical Classifications Software Refined (CCSR) for ICD-10-CM Diagnoses. Healthcare Cost and Utilization Project (HCUP). Agency for Healthcare Research and Quality. Updated March 2021. www.hcup-us.ahrq.gov/toolssoftware/ccsr/dxccsr.jsp. Accessed June 14, 2021. d Claritas. Claritas Demographic Profile by ZIP Code. https://claritas360.claritas.com/mybestsegments/. e Claritas. Claritas Demographic Profile by ZIP Code. https://claritas360.claritas.com/mybestsegments/. |
| Supplemental Table 1. Percentage of first-listed or principal diagnoses by body system or condition and ED visit type, 2018, for data presented in Figure 1 | |||||||
| ICD-10-CM diagnosis chapter | Percentage of treat-and-release ED visits | Percentage of ED visits resulting in admission | |||||
|---|---|---|---|---|---|---|---|
| Injury and poisoning | 20.1 | 10.0 | |||||
| Symptoms, signs and abnormal findings | 16.0 | 2.4 | |||||
| Respiratory system | 11.5 | 11.9 | |||||
| Musculoskeletal system and connective tissue | 7.8 | 2.2 | |||||
| Circulatory system | 7.0 | 18.0 | |||||
| Digestive system | 6.8 | 13.3 | |||||
| Genitourinary system | 6.0 | 6.7 | |||||
| Nervous system | 4.4 | 3.5 | |||||
| Mental, behavioral and neurodevelopmental | 4.3 | 6.0 | |||||
| Skin and subcutaneous | 3.7 | 2.6 | |||||
| Pregnancy, childbirth and the puerperium | 2.8 | 3.1 | |||||
| Ear and mastoid process | 2.2 | 0.2 | |||||
| Factors influencing health status | 2.0 | 0.1 | |||||
| Infectious and parasitic | 1.9 | 10.3 | |||||
| Endocrine, nutritional and metabolic | 1.6 | 5.0 | |||||
| Eye and adnexa | 1.1 | 0.1 | |||||
| Blood and blood forming organs | 0.4 | 1.6 | |||||
| Neoplasms | 0.2 | 2.6 | |||||
| Conditions originating in the perinatal period | 0.1 | 0.3 | |||||
| Congenital malformations and abnormalities | 0.0 | 0.1 | |||||
| Supplemental Table 2. Rate per 1,000 population of ED visits by patient characteristics and ED visit type, 2018, for data presented in Figure 3 | |||||
| Characteristic | Rate per 1,000 population for ED visits resulting in hospital admission | Rate per 1,000 population for treat-and-release ED visits | Rate per 1,000 population for total ED visits | Percentage of ED visits resulting in admission | |
|---|---|---|---|---|---|
| All 2018 ED visits | 61 | 378 | 439 | 14.0 | |
| Patient sex | |||||
| Female | 63 | 415 | 478 | 13.2 | |
| Male | 60 | 339 | 399 | 15.0 | |
| Patient age group | |||||
| < 18 years | 14 | 374 | 388 | 3.6 | |
| 18-44 years | 33 | 414 | 447 | 7.4 | |
| 45-64 years | 68 | 330 | 398 | 17.2 | |
| 65+ years | 182 | 379 | 561 | 32.4 | |
| Community-level income | |||||
| Quartile 1 (lowest) | 81 | 559 | 641 | 12.7 | |
| Quartile 2 | 62 | 404 | 466 | 13.3 | |
| Quartile 3 | 52 | 294 | 346 | 15.0 | |
| Quartile 4 (highest) | 47 | 234 | 281 | 16.6 | |
| Patient residence | |||||
| Large metro | 59 | 343 | 403 | 14.8 | |
| Medium and small metro | 64 | 391 | 455 | 14.1 | |
| Rural | 60 | 474 | 534 | 11.2 | |
| Hospital region | |||||
| Northeast | 77 | 385 | 461 | 16.6 | |
| Midwest | 61 | 417 | 478 | 12.8 | |
| South | 65 | 403 | 468 | 13.9 | |
| West | 45 | 298 | 343 | 13.1 | |