|
STATISTICAL BRIEF #289
February 2022
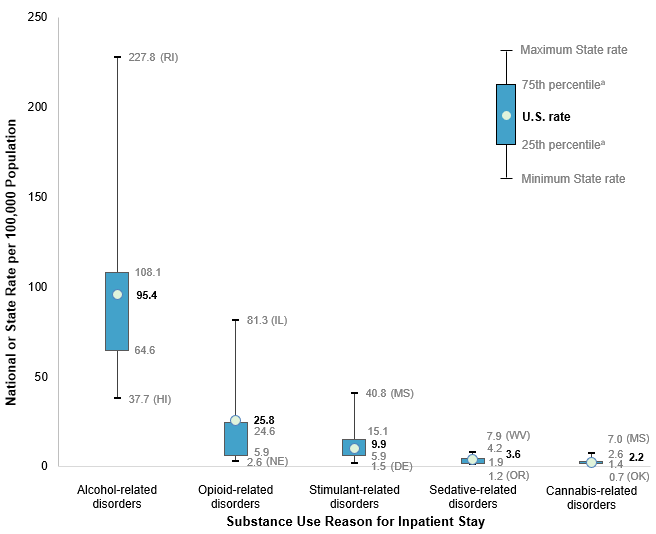
Kathryn R. Fingar, Ph.D., M.P.H., and Marc Roemer, M.S. Introduction In 2019 in the United States, 7 percent of individuals aged 12 years or older reported having a substance use disorder (SUD) in the past year, and 21 percent of them received substance use treatment.1 SUDs are a common reason for hospitalization in the United States.2 Alcohol- and opioid-related disorders rank in the top 100 principal diagnoses for inpatient stays.2 Rates of inpatient stays for SUDs reflect many factors, including the prevalence of SUDs in the community and access to treatment. Hospitalizations for SUDs are especially important to track at the substate level to inform community prevention efforts, as well as inpatient and outpatient resource allocation based on the needs of the community. Statistics from 2016-2018 establish a baseline from which to examine changes in inpatient utilization for SUDs that have occurred since the beginning of the COVID-19 pandemic in 2020.3,4 This Healthcare Cost and Utilization Project (HCUP) Statistical Brief presents 3-year aggregate statistics on national, State, and substate regional variation in inpatient stays for SUDs among patients of all ages at community hospitals (excluding rehabilitation and long-term care hospitals) using the 2016-2018 National Inpatient Sample (NIS) and the 2016-2018 State Inpatient Databases (SID). Geographic areas are based on the patient ZIP Code of residence. This Statistical Brief focuses on the five leading SUD principal diagnoses for inpatient stays in the United States: alcohol-related disorders, opioid-related disorders, stimulant-related disorders, sedative-related disorders, and cannabis-related disorders. Statistics are presented for 38 States that, at the time this Statistical Brief was written, had released aggregate 2016-2018 data through the Community-Level Statistics path of HCUPnet, an online query tool for county- and substate region-level statistics.2 These States represented 80 percent of the U.S. population in 2018. Because of the large sample size of the NIS and SID data, small differences can be statistically significant but not clinically important. Thus, only differences greater than or equal to 10 percent are discussed in the text. Findings State variation in leading reasons for inpatient stays for substance use disorders, 2016-2018 Figure 1 displays the distribution (i.e., minimum and maximum values as well as the 25th and 75th percentiles) of population rates of the five leading SUD reasons (i.e., principal diagnosis) for inpatient stays across the 38 States included in this Statistical Brief. The national rate also is presented. |
|
Figure 1. Variation in State rate (per 100,000 population) of leading substance use disorder principal diagnoses for inpatient stays, 2016-2018
a The 25th and 75th percentiles are based on the
distribution of rates across the 38 States that participate in the HCUPnet
Community-Level Statistics path. The U.S. rate is a national weighted estimate from
the Healthcare Cost and Utilization Project (HCUP) National Inpatient Sample (NIS).
Box and whisker plot showing the distribution (i.e., minimum and maximum values as well
as the 25th and 75th percentiles) of population rates of the five leading substance use
disorder reasons for inpatient stays across 38 States as well as the national rate.
Alcohol-related disorders: minimum State rate, 37.7 (HI); 25th percentile, 64.6; U.S.
rate, 95.4; 75th percentile, 108.1; maximum State rate, 227.8 (RI). Opioid-related
disorders: minimum State rate, 2.6 (NE); 25th percentile, 5.9; U.S. rate, 25.8; 75th
percentile, 24.6; maximum State rate, 81.3 (IL). Stimulant-related disorders: minimum
State rate, 1.5 (DE); 25th percentile, 5.9; U.S. rate, 9.9; 75th percentile, 15.1; maximum
State rate, 40.8 (MS). Sedative-related disorders: minimum State rate, 1.2 (OR); 25th
percentile, 1.9; U.S. rate, 3.6; 75th percentile, 4.2; maximum State rate, 7.9 (WV).
Cannabis-related disorders: minimum State rate, 0.7 (OK); 25th percentile, 1.4; U.S.
rate, 2.2; 75th percentile, 2.6; maximum State rate, 7.0 (MS).
|
| Table 1. Rate of inpatient stays per 100,000 population of the top five substance use disorder principal diagnoses and State rank, 2016-2018 | ||||||||||
| State | Alcohol-related disorders | Opioid-related disorders | Stimulant-related disorders | Sedative-related disorders | Cannabis-related disorders | |||||
|---|---|---|---|---|---|---|---|---|---|---|
| Rate | State rank | Rate | State rank | Rate | State rank | Rate | State rank | Rate | State rank | |
| United States | 95.4 | — | 25.8 | — | 9.9 | — | 3.6 | — | 2.2 | — |
| Alaska | 111.0 | 8 | 5.6 | 31 | 7.1 | 23 | —a | —a | 1.5 | 22 |
| Arizona | 58.9 | 35 | 7.5 | 26 | 5.1 | 33 | 1.2 | 33 | 0.9 | 35 |
| Arkansas | 63.1 | 31 | 23.1 | 11 | 19.9 | 6 | 3.7 | 15 | 1.6 | 21 |
| California | 62.9 | 32 | 8.4 | 25 | 7.4 | 21 | 2.0 | 25 | 1.4 | 28 |
| Colorado | 109.1 | 10 | 10.2 | 22 | 6.7 | 25 | 2.3 | 23 | 3.2 | 5 |
| Delaware | 86.0 | 20 | 5.6 | 30 | 1.5 | 38 | 2.3 | 22 | —a | —a |
| Florida | 94.5 | 14 | 13.9 | 20 | 12.3 | 11 | 3.8 | 13 | 3.1 | 6 |
| Georgia | 54.8 | 36 | 5.1 | 34 | 7.3 | 22 | 2.9 | 18 | 1.3 | 31 |
| Hawaii | 37.7 | 38 | 5.1 | 35 | 27.7 | 2 | 1.9 | 26 | 2.6 | 10 |
| Illinois | 116.3 | 7 | 81.3 | 1 | 6.3 | 27 | 2.7 | 20 | 1.8 | 18 |
| Indiana | 98.4 | 13 | 23.1 | 12 | 10.5 | 13 | 3.0 | 17 | 1.8 | 17 |
| Iowa | 104.8 | 11 | 5.5 | 32 | 22.8 | 5 | 1.5 | 30 | 2.7 | 8 |
| Kentucky | 85.5 | 21 | 42.0 | 4 | 17.6 | 9 | 6.8 | 2 | 1.8 | 16 |
| Louisiana | 60.4 | 34 | 26.8 | 9 | 25.6 | 4 | 4.2 | 8 | 4.1 | 2 |
| Maryland | 109.6 | 9 | 27.9 | 8 | 2.6 | 37 | 5.5 | 4 | 1.4 | 25 |
| Massachusetts | 177.4 | 2 | 25.1 | 10 | 4.7 | 35 | 4.0 | 12 | 2.6 | 9 |
| Michigan | 89.0 | 18 | 9.9 | 23 | 2.8 | 36 | 2.5 | 21 | 1.1 | 34 |
| Minnesota | 139.5 | 5 | 22.0 | 13 | 19.5 | 7 | 3.2 | 16 | 3.2 | 4 |
| Mississippi | 67.2 | 27 | 28.3 | 7 | 40.8 | 1 | 5.1 | 5 | 7.0 | 1 |
| Montana | 91.9 | 16 | 5.8 | 29 | 18.2 | 8 | —a | —a | 1.4 | 27 |
| Nebraska | 81.4 | 22 | 2.6 | 38 | 8.0 | 20 | 1.4 | 31 | 1.4 | 30 |
| Nevada | 77.6 | 24 | 8.6 | 24 | 6.5 | 26 | 1.4 | 32 | 1.4 | 26 |
| New Jersey | 103.2 | 12 | 47.9 | 2 | 5.7 | 30 | 4.5 | 7 | 2.1 | 12 |
| New Mexico | 88.2 | 19 | 5.2 | 33 | 10.8 | 12 | 1.8 | 27 | 3.0 | 7 |
| North Carolina | 77.6 | 23 | 17.5 | 17 | 10.5 | 14 | 4.9 | 6 | 1.9 | 15 |
| North Dakota | 152.1 | 3 | 5.9 | 28 | 25.6 | 3 | —a | —a | 3.5 | 3 |
| Oklahoma | 64.4 | 30 | 16.6 | 19 | 9.3 | 16 | 2.9 | 19 | 0.7 | 37 |
| Oregon | 64.5 | 29 | 7.2 | 27 | 5.8 | 29 | 1.2 | 34 | 1.7 | 19 |
| Pennsylvania | 92.4 | 15 | 20.8 | 14 | 5.2 | 32 | 4.2 | 9 | 1.5 | 24 |
| Rhode Island | 227.8 | 1 | 39.6 | 5 | 6.9 | 24 | 6.7 | 3 | 2.4 | 11 |
| South Carolina | 64.7 | 28 | 10.6 | 21 | 9.5 | 15 | 4.2 | 11 | 2.0 | 14 |
| Tennessee | 60.6 | 33 | 18.9 | 15 | 5.7 | 31 | 4.2 | 10 | 1.2 | 33 |
| Texas | 43.4 | 37 | 4.7 | 37 | 6.1 | 28 | 1.6 | 29 | 1.5 | 23 |
| Utah | 76.5 | 25 | 28.4 | 6 | 8.3 | 19 | 3.7 | 14 | 0.8 | 36 |
| Washington | 70.9 | 26 | 17.0 | 18 | 4.9 | 34 | 1.7 | 28 | 1.2 | 32 |
| West Virginia | 90.5 | 17 | 44.0 | 3 | 16.0 | 10 | 7.9 | 1 | 1.6 | 20 |
| Wisconsin | 150.0 | 4 | 17.6 | 16 | 9.0 | 18 | 2.1 | 24 | 1.4 | 29 |
| Wyoming | 127.0 | 6 | 4.9 | 36 | 9.2 | 17 | —a | —a | 2.0 | 13 |
|
Notes: Rates are per 100,000 population. The U.S. rate is a national
weighted estimate from the Healthcare Cost and Utilization Project
(HCUP) National Inpatient Sample (NIS).
a Suppressed because of small cell size. Source: Agency for Healthcare Research and Quality (AHRQ), Healthcare Cost and Utilization Project (HCUP), 2016-2018 National Inpatient Sample (NIS) and 2016-2018 State Inpatient Databases (SID) for 38 States that, at the time this Statistical Brief was written, had released aggregate 2016-2018 data through the Community-Level Statistics path on HCUPnet, an online query tool |
||||||||||
|
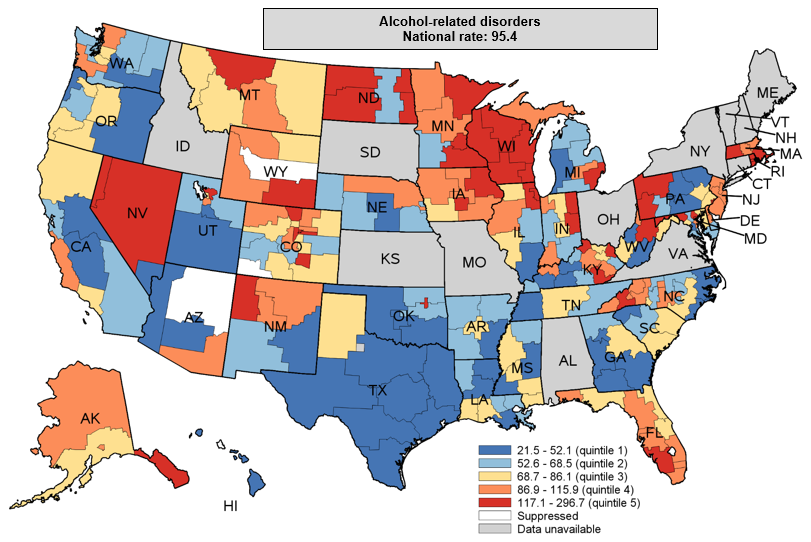
Figure 2. Rate of inpatient stays with a principal diagnosis of alcohol-related disorders per 100,000 population, by substate region, 2016-2018
Note: Data for Hawaii and Delaware are at the county level, not the substate region level. The quintiles are based on the distribution of unsuppressed rates across the 38 States that participate in the HCUPnet Community-Level Statistics path. The U.S. rate is a national weighted estimate from the Healthcare Cost and Utilization Project (HCUP) National Inpatient Sample (NIS).
Color-coded map of the United States that shows substate region-level rates per 100,000
population for inpatient stays with a principal diagnosis of alcohol-related disorders
in 2016 to 2018 for 38 States, by rate quintile (quintile 1: 21.5-52.1; quintile 2:
52.6-68.5; quintile 3: 68.7-86.1; quintile 4: 86.9-115.9; quintile 5: 117.1-296.7). National rate: 95.4.
|
|
|
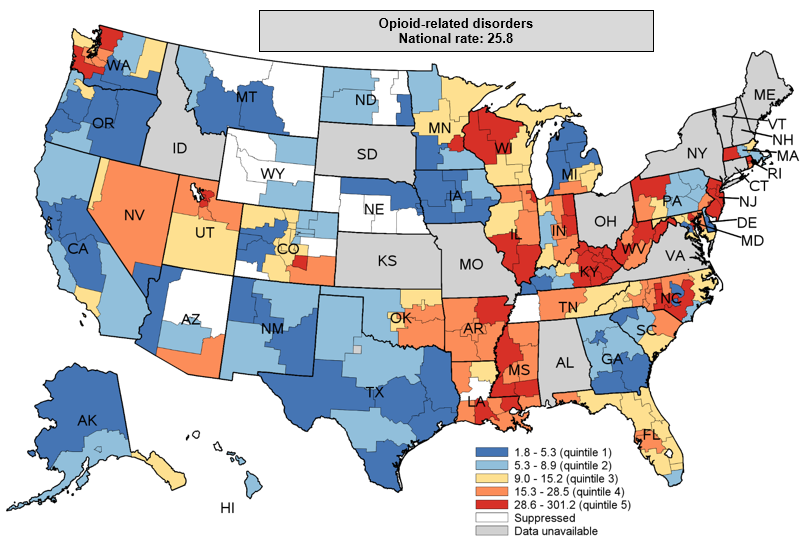
Figure 3. Rate of inpatient stays with a principal diagnosis of opioid-related disorders per 100,000 population, by substate region, 2016-2018
Note: Data for Hawaii and Delaware are at the county level, not the substate region level. The quintiles are based on the distribution of unsuppressed rates across the 38 States that participate in the HCUPnet Community-Level Statistics path. The U.S. rate is a national weighted estimate from the Healthcare Cost and Utilization Project (HCUP) National Inpatient Sample (NIS).
Color-coded map of the United States that shows substate region-level rates per 100,000 population for inpatient stays with a principal diagnosis of opioid-related disorders in 2016 to 2018 for 38 States, by rate quintile (quintile 1: 1.8-5.3; quintile 2: 5.3-8.9; quintile 3: 9.0-15.2; quintile 4: 15.3-28.5; quintile 5: 28.6-301.2). National rate: 25.8.
|
|
|
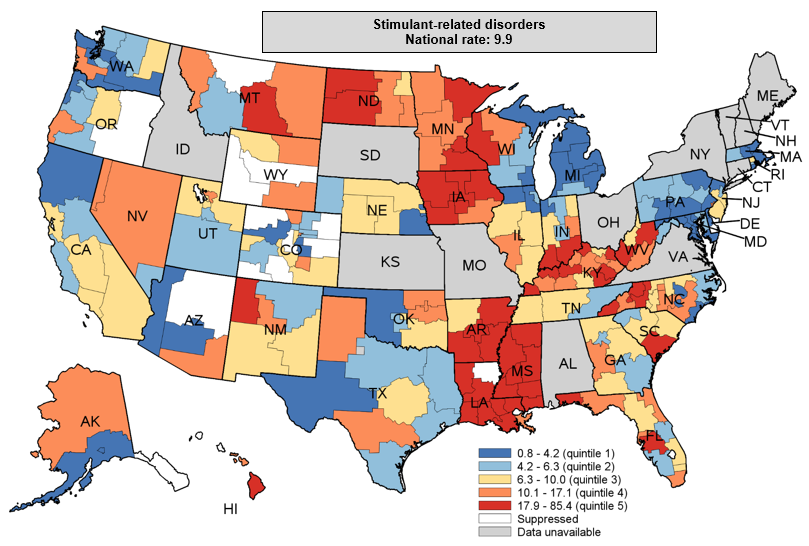
Figure 4. Rate of inpatient stays with a principal diagnosis of stimulant-related disorders per 100,000 population, by substate region, 2016-2018
Note: Data for Hawaii and Delaware are at the county level, not the substate region level. The quintiles are based on the distribution of unsuppressed rates across the 38 States that participate in the HCUPnet Community-Level Statistics path. The U.S. rate is a national weighted estimate from the Healthcare Cost and Utilization Project (HCUP)
National Inpatient Sample (NIS).
Color-coded map of the United States that shows substate region-level rates per 100,000 population for inpatient stays with a principal diagnosis of stimulant-related disorders in 2016 to 2018 for 38 States, by rate quintile (quintile 1: 0.8-4.2; quintile 2: 4.2-6.3; quintile 3: 6.3-10.0; quintile 4: 10.1-17.1; quintile 5: 17.9-85.4). National rate: 9.9.
|
|
|
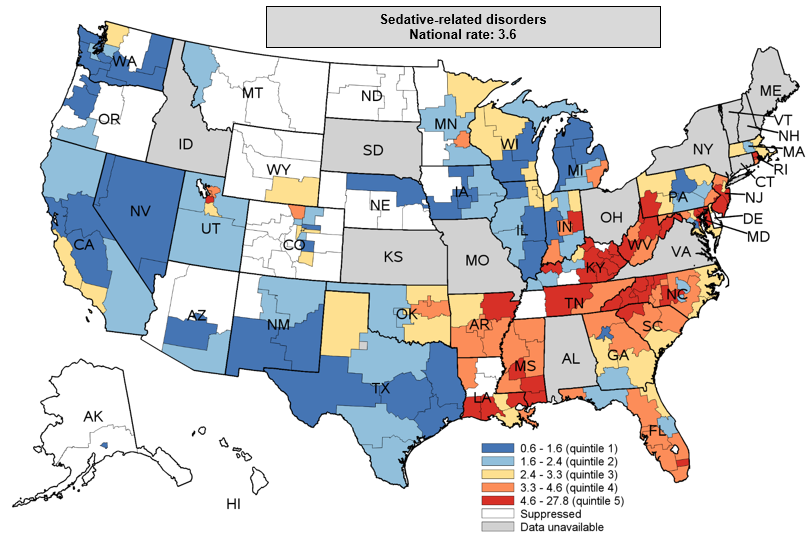
Figure 5. Rate of inpatient stays with a principal diagnosis of sedative-related disorders per 100,000 population, by substate region, 2016-2018
Note: Data for Hawaii and Delaware are at the county level, not the substate region level. The quintiles are based on the distribution of unsuppressed rates across the 38 States that participate in the HCUPnet Community-Level Statistics path. The U.S. rate is a national weighted estimate from the Healthcare Cost and Utilization Project (HCUP) National Inpatient Sample (NIS).
Color-coded map of the United States that shows substate region-level rates per 100,000 population for inpatient stays with a principal diagnosis of sedative-related disorders in 2016 to 2018 for 38 States, by rate quintile (quintile 1: 0.6-1.6; quintile 2: 1.6-2.4; quintile 3: 2.4-3.3; quintile 4: 3.3-4.6; quintile 5: 4.6-27.8). National rate: 3.6.
|
|
|
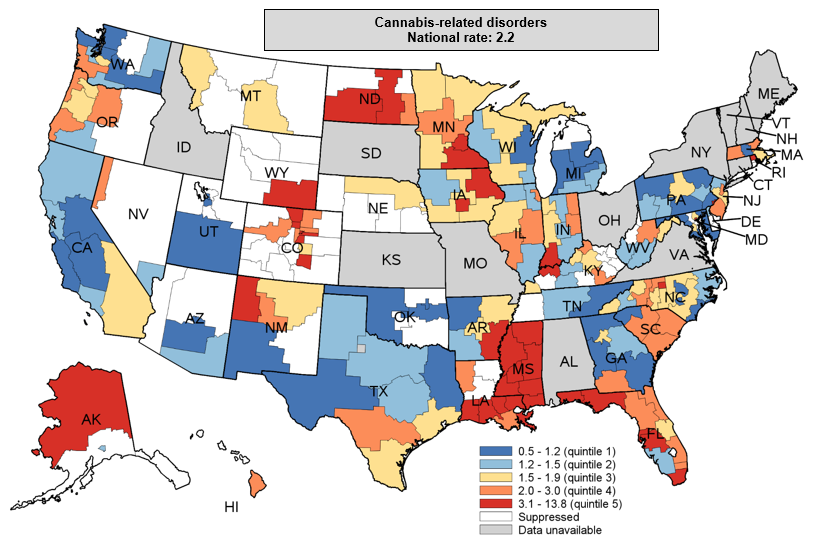
Figure 6. Rate of inpatient stays with a principal diagnosis of cannabis-related disorders per 100,000 population, by substate region, 2016-2018
Note: Data for Hawaii and Delaware are at the county level, not the substate region level. The quintiles are based on the distribution of unsuppressed rates across the 38 States that participate in the HCUPnet Community-Level Statistics path. The U.S. rate is a national weighted estimate from the Healthcare Cost and Utilization Project (HCUP) National Inpatient Sample (NIS).
Color-coded map of the United States that shows substate region-level rates per 100,000 population for inpatient stays with a principal diagnosis of cannabis-related disorders in 2016 to 2018 for 38 States, by rate quintile (quintile 1: 0.5-1.2; quintile 2: 1.2-1.5; quintile 3: 1.5-1.9; quintile 4: 2.0-3.0; quintile 5: 3.1-13.8). National rate: 2.2.
|
|
|
References
1 Substance Abuse and Mental Health Services Administration, Center for Behavioral Health Statistics and Quality. Key Substance Use and Mental Health Indicators in the United States: Results from the 2019 National Survey on Drug Use and Health. HHS Publication No. PEP20-07-01-001, NSDUH Series H-55. 2020. www.store.samhsa.gov/sites/default/files/SAMHSA_Digital_Download/PEP20-07-01-001-PDF.pdf. Accessed October 11, 2021. 2 Agency for Healthcare Research and Quality. HCUPnet website. datatools.ahrq.gov/hcupnet. Accessed October 11, 2021. 3 Grossman ER, Benjamin-Neelon SE, Sonnenschein S. Alcohol consumption during the COVID-19 pandemic: a cross-sectional survey of US adults. International Journal of Environmental Research and Public Health. 2020;17(24):9189. 4 Centers for Disease Control and Prevention. Overdose Deaths Accelerating During COVID-19. Page last reviewed December 18, 2020. www.cdc.gov/media/releases/2020/p1218-overdose-deaths-covid-19.html. Accessed October 11, 2021. About Statistical Briefs Healthcare Cost and Utilization Project (HCUP) Statistical Briefs provide basic descriptive statistics on a variety of topics using HCUP administrative healthcare data. Topics include hospital inpatient, ambulatory surgery, and emergency department use and costs, quality of care, access to care, medical conditions, procedures, and patient populations, among other topics. The reports are intended to generate hypotheses that can be further explored in other research; the reports are not designed to answer in-depth research questions using multivariate methods. Data Source The State and substate estimates in this Statistical Brief are based upon data from the HCUP 2016-2018 State Inpatient Databases (SID) for 38 States that, at the time this Statistical Brief was written, had released aggregate 2016-2018 data through the Community-Level Statistics (CLS) path of HCUPnet, an online query tool. National estimates come from the HCUP 2016-2018 National Inpatient Sample (NIS). The States included in this Statistical Brief were Alaska, Arizona, Arkansas, California, Colorado, Delaware, Florida, Georgia, Hawaii, Illinois, Indiana, Iowa, Kentucky, Louisiana, Maryland, Massachusetts, Michigan, Minnesota, Mississippi, Montana, Nebraska, Nevada, New Jersey, New Mexico, North Carolina, North Dakota, Oklahoma, Oregon, Pennsylvania, Rhode Island, South Carolina, Tennessee, Texas, Utah, Washington, West Virginia, Wisconsin, and Wyoming. Substate regions were created from definitions provided by the HCUP Partner, if available, or by a regionalization scheme developed by the Substance Abuse and Mental Health Services Administration.b Delaware and Hawaii do not release region-level data, so statistics for these States are presented at the county level. In CLS, statistics are suppressed if the reporting cell draws from fewer than two hospitals or contains fewer than 11 discharges or because the county was missing 2 percent or more of total discharges in the HCUP SID when compared with the Medicare Hospital Service Area File. Supplemental sources included population denominator data for use with HCUP databases, derived from information available from Claritas, a vendor that produces population estimates and projections based on data from the U.S. Census Bureau.c Definitions Diagnoses, ICD-10-CM, and Clinical Classifications Software Refined (CCSR) for ICD-10-CM Diagnoses The principal diagnosis is that condition established after study to be chiefly responsible for the patient's admission to the hospital. Secondary diagnoses are conditions that coexist at the time of admission that require or affect patient care treatment received or management, or that develop during the inpatient stay. ICD-10-CM is the International Classification of Diseases, Tenth Revision, Clinical Modification. There are over 70,000 ICD-10-CM diagnosis codes. The CCSR aggregates ICD-10-CM diagnosis codes into a manageable number of clinically meaningful categories.d The CCSR is intended to be used analytically to examine patterns of healthcare in terms of cost, utilization, and outcomes; rank utilization by diagnoses; and risk-adjust by clinical condition. The CCSR capitalizes on the specificity of the ICD-10-CM coding scheme and allows ICD-10-CM codes to be classified in more than one category. Approximately 10 percent of diagnosis codes are associated with more than one CCSR category because the diagnosis code documents either multiple conditions or a condition along with a common symptom or manifestation. For this Statistical Brief, the principal diagnosis code is assigned to a single default CCSR based on clinical coding guidelines, etiology and pathology of diseases, and standards set by other Federal agencies. The assignment of the default CCSR for the principal diagnosis is available starting with version v2020.2 of the software tool. ICD-10-CM coding definitions for each CCSR category presented in this Statistical Brief can be found in the CCSR reference file, available at www.hcup-us.ahrq.gov/toolssoftware/ccsr/ccs_refined.jsp#download. For this Statistical Brief, v2021.1 of the CCSR was used for 2016 data and v2021.2 was used for 2017 and 2018 data. Case definition The CCSR categories defining substance use disorders for this Statistical Brief are based on the principal diagnosis and include:
The National (Nationwide) Inpatient Sample (NIS) is based on data from community hospitals, which are defined as short-term, non-Federal, general, and other hospitals, excluding hospital units of other institutions (e.g., prisons). The NIS includes obstetrics and gynecology, otolaryngology, orthopedic, cancer, pediatric, public, and academic medical center hospitals. Excluded are long-term care facilities such as rehabilitation, psychiatric, and alcoholism and chemical dependency hospitals. Beginning in 2012, long-term acute care hospitals are also excluded. However, if a patient received long-term care, rehabilitation, or treatment for a psychiatric or chemical dependency condition in a community hospital, the discharge record for that stay will be included in the NIS. Types of hospitals included in HCUP State Inpatient Databases This analysis used State Inpatient Databases (SID) limited to data from community hospitals, which are defined as short-term, non-Federal, general, and other hospitals, excluding hospital units of other institutions (e.g., prisons). Community hospitals include obstetrics and gynecology, otolaryngology, orthopedic, cancer, pediatric, public, and academic medical center hospitals. Excluded for this analysis are long-term care facilities such as rehabilitation, psychiatric, and alcoholism and chemical dependency hospitals. However, if a patient received long-term care, rehabilitation, or treatment for a psychiatric or chemical dependency condition in a community hospital, the discharge record for that stay was included in the analysis. Unit of analysis The unit of analysis is the hospital discharge (i.e., the hospital stay), not a person or patient. This means that a person who is admitted to the hospital multiple times in 1 year will be counted each time as a separate discharge from the hospital. This includes discharges from any HCUP hospital of a patient who resides in the geographic area of interest. Population rates Rates of stays per 100,000 population were calculated using 2016-2018 hospital discharge totals in the numerator and Claritase estimates of the 2016-2018 U.S. population in the denominator. Individuals hospitalized multiple times are counted more than once in the numerator. State- and substate region-level rates are based on the ZIP Code of the patient's residence. For the national and State-level information presented in Figure 1 and Table 1, the rate of inpatient stays was calculated annually at the national level and for each State, as the number of stays divided by the population estimate for that year multiplied by 100,000. Then, to obtain the weighted 3-year average, the annual rates were summed, weighted by the ratio of the population total in each year to the 3-year aggregate population. These National and State-level rates include information from all regions, including those suppressed in the other figures.
Figures 2 through 6 are derived from region-level rates of inpatient stays. The 3-year region-level estimates were calculated as follows:
The Healthcare Cost and Utilization Project (HCUP, pronounced "H-Cup") is a family of healthcare databases and related software tools and products developed through a Federal-State-Industry partnership and sponsored by the Agency for Healthcare Research and Quality (AHRQ). HCUP databases bring together the data collection efforts of State data organizations, hospital associations, and private data organizations (HCUP Partners) and the Federal government to create a national information resource of encounter-level healthcare data. HCUP includes the largest collection of longitudinal hospital care data in the United States, with all-payer, encounter-level information beginning in 1988. These databases enable research on a broad range of health policy issues, including cost and quality of health services, medical practice patterns, access to healthcare programs, and outcomes of treatments at the national, State, and local market levels. HCUP would not be possible without the contributions of the following data collection Partners from across the United States: |
|
Alaska Department of Health and Social Services Alaska State Hospital and Nursing Home Association Arizona Department of Health Services Arkansas Department of Health California Office of Statewide Health Planning and Development Colorado Hospital Association Connecticut Hospital Association Delaware Division of Public Health District of Columbia Hospital Association Florida Agency for Health Care Administration Georgia Hospital Association Hawaii Laulima Data Alliance Hawaii University of Hawai'i at Hilo Illinois Department of Public Health Indiana Hospital Association Iowa Hospital Association Kansas Hospital Association Kentucky Cabinet for Health and Family Services Louisiana Department of Health Maine Health Data Organization Maryland Health Services Cost Review Commission Massachusetts Center for Health Information and Analysis Michigan Health & Hospital Association Minnesota Hospital Association Mississippi State Department of Health Missouri Hospital Industry Data Institute |
Montana Hospital Association Nebraska Hospital Association Nevada Department of Health and Human Services New Hampshire Department of Health & Human Services New Jersey Department of Health New Mexico Department of Health New York State Department of Health North Carolina Department of Health and Human Services North Dakota (data provided by the Minnesota Hospital Association) Ohio Hospital Association Oklahoma State Department of Health Oregon Association of Hospitals and Health Systems Oregon Office of Health Analytics Pennsylvania Health Care Cost Containment Council Rhode Island Department of Health South Carolina Revenue and Fiscal Affairs Office South Dakota Association of Healthcare Organizations Tennessee Hospital Association Texas Department of State Health Services Utah Department of Health Vermont Association of Hospitals and Health Systems Virginia Health Information Washington State Department of Health West Virginia Department of Health and Human Resources, West Virginia Health Care Authority Wisconsin Department of Health Services Wyoming Hospital Association |
|
About the NIS
The HCUP National (Nationwide) Inpatient Sample (NIS) is a nationwide database of hospital inpatient stays. The NIS is nationally representative of all community hospitals (i.e., short-term, non-Federal, nonrehabilitation hospitals). The NIS includes all payers. It is drawn from a sampling frame that contains hospitals comprising more than 96 percent of all discharges in the United States. The vast size of the NIS allows the study of topics at the national and regional levels for specific subgroups of patients. In addition, NIS data are standardized across years to facilitate ease of use. Over time, the sampling frame for the NIS has changed; thus, the number of States contributing to the NIS varies from year to year. The NIS is intended for national estimates only; no State-level estimates can be produced. The unweighted sample size for the 2018 NIS is 7,105,498 (weighted, this represents 35,527,481 inpatient stays). The unweighted sample size for the 2016 NIS is 7,135,090 (weighted, this represents 35,675,421 inpatient stays). About the SID The HCUP State Inpatient Databases (SID) are hospital inpatient databases from data organizations participating in HCUP. The SID contain the universe of the inpatient discharge abstracts in the participating HCUP States, translated into a uniform format to facilitate multistate comparisons and analyses. Together, the SID encompass more than 95 percent of all U.S. community hospital discharges. The SID can be used to investigate questions unique to one State, to compare data from two or more States, to conduct market-area variation analyses, and to identify State-specific trends in inpatient care utilization, access, charges, and outcomes. About HCUPnet HCUPnet ( datatools.ahrq.gov/hcupnet ) is an online query system that offers instant access to the largest set of all-payer healthcare databases that are publicly available. HCUPnet has an easy step-by-step query system that creates tables and graphs of national and regional statistics as well as data trends for community hospitals in the United States. HCUPnet generates statistics using data from HCUP's National (Nationwide) Inpatient Sample (NIS), the Kids' Inpatient Database (KID), the Nationwide Emergency Department Sample (NEDS), the Nationwide Readmissions Database (NRD), the State Inpatient Databases (SID), and the State Emergency Department Databases (SEDD). For More Information For other information on hospitalizations related to substance use, refer to the HCUP Statistical Briefs located at www.hcup-us.ahrq.gov/reports/statbriefs/sb_mhsa.jsp. For additional HCUP statistics, visit:
For a detailed description of HCUP and more information on the design of the National Inpatient Sample (NIS) and State Inpatient Databases (SID), please refer to the following database documentation: Agency for Healthcare Research and Quality. Overview of the National (Nationwide) Inpatient Sample (NIS). Healthcare Cost and Utilization Project (HCUP). Rockville, MD: Agency for Healthcare Research and Quality. Updated December 2020. www.hcup-us.ahrq.gov/nisoverview.jsp. Accessed January 22, 2021. Agency for Healthcare Research and Quality. Overview of the State Inpatient Databases (SID). Healthcare Cost and Utilization Project (HCUP). Rockville, MD: Agency for Healthcare Research and Quality. Updated October 2020. www.hcup-us.ahrq.gov/sidoverview.jsp. Accessed January 22, 2021. Suggested Citation Fingar KR (IBM), Roemer M (AHRQ). Geographic Variation in Inpatient Stays for Five Leading Substance Use Disorders, 2016-2018. HCUP Statistical Brief #289. February 2022. Agency for Healthcare Research and Quality, Rockville, MD. www.hcup-us.ahrq.gov/reports/statbriefs/sb289-Substance-Use-Disorder-Hospitalizations-by-Region-2016-2018.pdf. Acknowledgments The authors would like to acknowledge the contributions of Manjie Fu, Veronica Hernandez, Mimi Mauskopf, Jillian McCarty, and Minya Sheng of IBM. *** AHRQ welcomes questions and comments from readers of this publication who are interested in obtaining more information about access, cost, use, financing, and quality of healthcare in the United States. We also invite you to tell us how you are using this Statistical Brief and other HCUP data and tools, and to share suggestions on how HCUP products might be enhanced to further meet your needs. Please email us at hcup@ahrq.gov or send a letter to the address below:Joel W. Cohen, Ph.D., Director Center for Financing, Access and Cost Trends Agency for Healthcare Research and Quality 5600 Fishers Lane Rockville, MD 20857 This Statistical Brief was posted online on February 15, 2022. a Note that Appalachia is an area of the United States that includes parts of the Ohio River Valley and spans 13 States, including parts of northern Alabama, Georgia, Mississippi, and South Carolina; eastern parts of Kentucky, Ohio, and Tennessee; western parts of Maryland, North Carolina, and Virginia; southern parts of New York; most of Pennsylvania; and all of West Virginia. Appalachian Regional Commission. About the Appalachian Region. www.arc.gov/about-the-appalachian-region/. b Substance Abuse and Mental Health Services Administration. 2010-2012 National Survey on Drug Use and Health Substate Region Definitions. www.samhsa.gov/data/sites/default/files/substate2k12-RegionDefs/NSDUHsubstateRegionDefs2012.htm. Accessed October 11, 2021. c Claritas. Claritas Demographic Profile by ZIP Code. claritas360.claritas.com/mybestsegments/. d Agency for Healthcare Research and Quality. HCUP Clinical Classifications Software Refined (CCSR) for ICD-10-CM Diagnoses. Healthcare Cost and Utilization Project (HCUP). Agency for Healthcare Research and Quality. Updated March 2021. www.hcup-us.ahrq.gov/toolssoftware/ccsr/dxccsr.jsp. Accessed June 14, 2021. e Claritas. Claritas Demographic Profile by ZIP Code. https://claritas360.claritas.com/mybestsegments/. |