STATISTICAL BRIEF #30
|
|
May 2007
Mirjana Milenkovic, M.A., C. Allison Russo, M.P.H., and Anne Elixhauser, Ph.D.
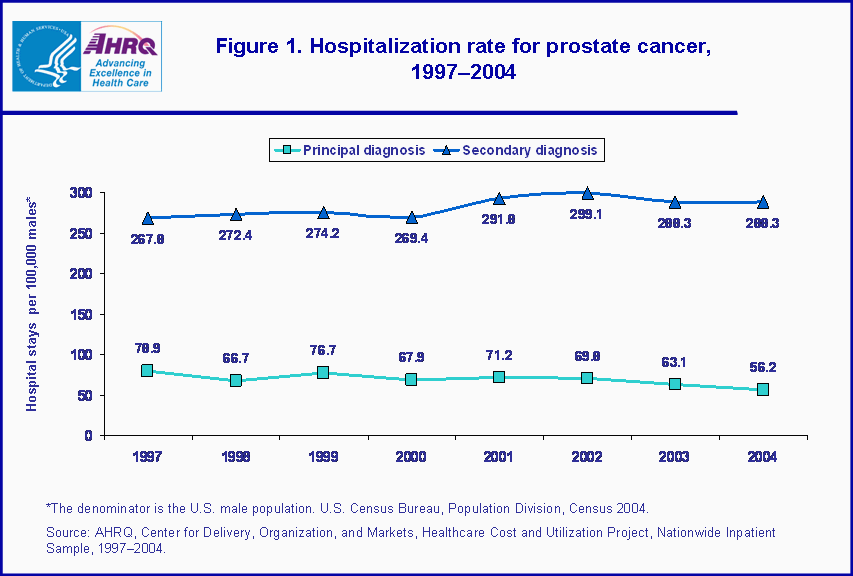
Introduction In the United States, prostate cancer is a leading cause of cancer-related deaths in men, second only to lung cancer.1 After basal cell carcinoma,2 prostate cancer is the most common cancer diagnosis for men. Nearly one in six men will be diagnosed with prostate cancer during his lifetime. Currently, about two million men are living with prostate cancer in the U.S.3 Although most treatment of prostate cancer occurs in the outpatient setting,4 a significant portion of care is provided in the hospital, especially for surgical treatment. This Statistical Brief presents data from the Healthcare Cost and Utilization Project (HCUP) on the treatment of prostate cancer in U.S. hospitals in 2004. The utilization and cost of hospital stays for prostate cancer are compared with all hospital stays for males. Age and payer differences among these hospital stays are also presented. Finally, commonly performed procedures used to treat prostate cancer and inpatient use of these procedures are examined. All differences between estimates noted in the text are statistically significant at the 0.05 level or better. Findings In 2004, nearly half a million hospital stays in the U.S. involved a diagnosis of prostate cancer. Prostate cancer was principally responsible for about 81,300 hospital stays among males, and it was listed as a secondary diagnosis in about 416,700 hospitalizations. As shown in figure 1, there were 56.2 hospitalizations per 100,000 males in the U.S. principally for prostate cancer in 2004—a nearly 30 percent decrease from 1997, when there were 78.9 hospital stays per 100,000 males. However, hospital stays where prostate cancer was listed as a secondary diagnosis increased about 8 percent over this time period, from 267.8 to 288.3 stays per 100,000 males. This suggests that more men are living with prostate cancer and are being hospitalized for other conditions. In 2004, hospital costs for the treatment of prostate cancer totaled about $657 million. General characteristics of hospital stays for prostate cancer Table 1 presents utilization and cost information for the treatment of prostate cancer in U.S. community hospitals compared with all hospital stays among males. On average, hospital stays principally for prostate cancer were about 1.6 days shorter than the average hospitalization for males (3.4 days versus 5.0 days). The average cost for a prostate cancer hospitalization was $8,100—about $700 less than the mean cost for all hospitalizations among males. However, because the average hospital stay for prostate cancer was significantly shorter, these stays resulted in a mean hospital cost per day that was about 33 percent higher than the mean cost per day for all male stays ($2,400 versus $1,800), indicating more intensive treatment. With an average age of 65 years, males hospitalized principally for prostate cancer were nearly 18 years older than men hospitalized for all conditions (47.5 years). Although hospital stays for prostate cancer had significantly lower emergency admission rates (7.6 percent versus 48.4 percent), these stays were just as likely to result in an in-hospital death. |
|
Differences in hospital stays for prostate cancer, by age and payer
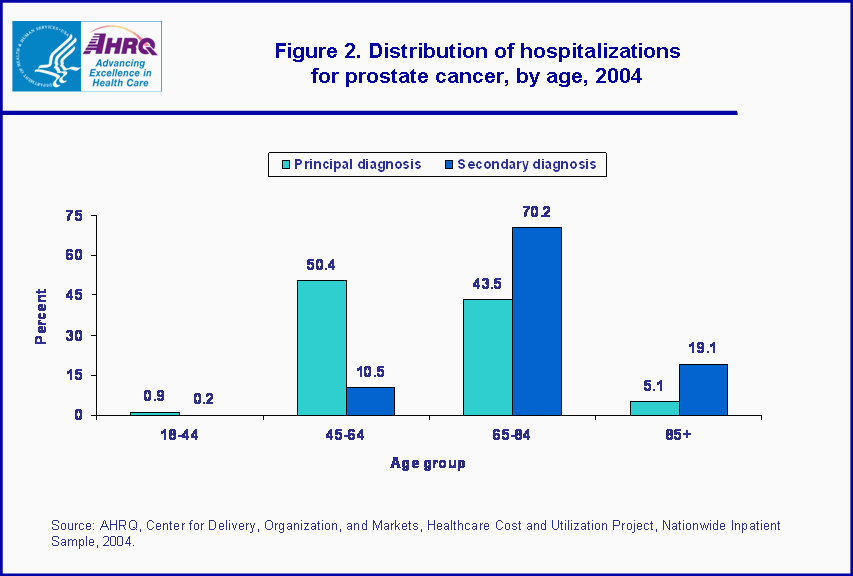
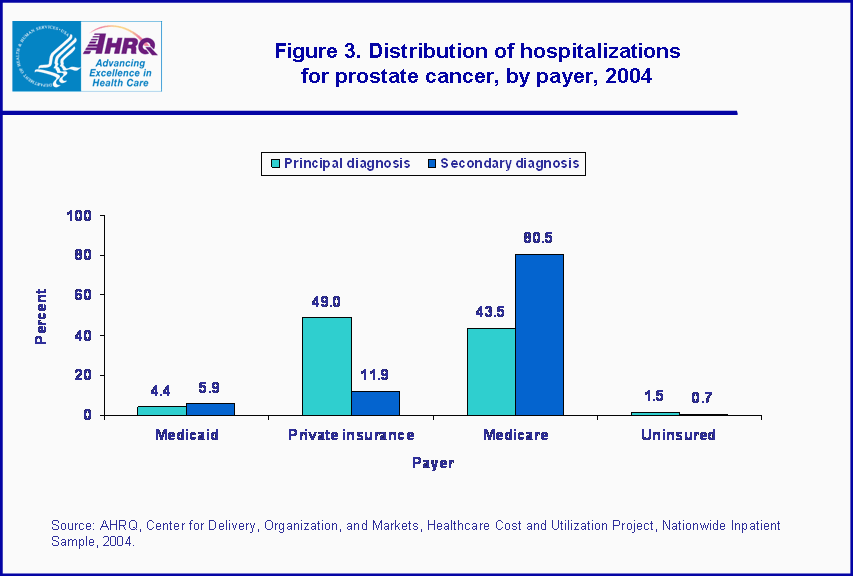
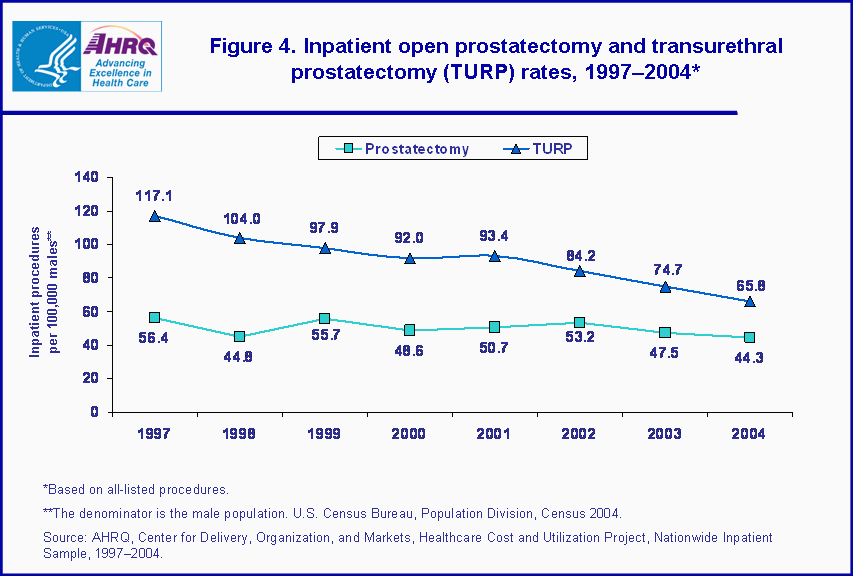
Figure 2 illustrates that approximately half (50.4 percent) of the hospital stays principally for prostate cancer occurred among men age 45 to 64, followed closely by men age 65 to 84 (43.5 percent). Together, the 45 to 84 age groups accounted for nearly all hospital admissions for prostate cancer. On the other hand, when examining hospitalizations during which prostate cancer was listed as a secondary diagnosis, the age distribution was older. Men older than 65 years comprised almost 90 percent of hospitalizations where prostate cancer was a secondary diagnosis. Figure 3 shows that private insurance and Medicare were the most common sources of payment for charges related to prostate cancer hospitalizations. Private insurance was billed for nearly half (49.0 percent) of charges for admissions principally for prostate cancer, and Medicare was billed for 43.5 percent of these hospital charges. This finding coincides with the age distribution, reflecting the most common sources of payment for men age 45 to 64 and those age 65 to 84. Also reflecting the age distribution noted above, hospital stays with a secondary diagnosis of prostate cancer were predominantly covered by Medicare. Procedures performed during hospital stays for prostate cancer Table 2 lists the procedures commonly associated with hospital stays that were principally for prostate cancer. The two most frequent procedures were open prostatectomy and transurethral prostatectomy (TURP). An open prostatectomy is the surgical removal of all or part of the prostate, and is the most common surgical treatment for prostate cancer. TURP—a procedure involving no incision—is most commonly used to treat benign tumors of the prostate, but is also performed on men with prostate cancer when a prostatectomy cannot be performed due to other health factors. Open prostatectomies were performed during 72.2 percent of all hospital stays for prostate cancer, while TURPs were performed during 12.9 percent of these stays. Other common procedures associated with hospitalizations for prostate cancer included blood transfusions (12.9 percent), endoscopy of the urinary tract (6.8 percent), and laproscopy of the gastrointestinal system (4.1 percent). Although the hospitalization rate for prostate cancer decreased by nearly 30 percent between 1997 and 2004, the use of an open prostatectomy during inpatient hospitalization remained relatively stable (figure 4). However, the rate of inpatient TURPs performed during this period declined by about 44 percent, decreasing from 117.1 inpatient procedures per 100,000 males in 1997 to 65.8 inpatient procedures per 100,000 males in 2004. This decrease was especially marked between 2001 and 2004, during which time a decrease of about 30 percent was noted. The reduction in the number of TURPs performed in the inpatient hospital setting can be attributed in part to advances in new surgical technologies and favorable payment policies, which allow the use of outpatient facilities for TURPs. Previously published reports indicate that in 2003, approximately 20 percent of TURPs were performed in the outpatient hospital setting, while only about 4 percent of open prostatectomies were outpatient procedures.5 Most common principal reasons for the hospitalization of men with prostate cancer In 2004, nearly 498,000 hospitalizations occurred among men with prostate cancer; however, the vast majority of these stays were for the principal treatment of other conditions. Table 3 illustrates that about one in six hospital admissions among men with prostate cancer was for the principal treatment of prostate cancer. Approximately 15 percent of all stays among men with prostate cancer were principally for the treatment of five circulatory disorders: coronary atherosclerosis (narrowing of the arteries of the heart)), congestive heart failure, cardiac dysrhythmias, acute myocardial infarction (heart attack), and acute cerebrovascular disease (stroke). Pneumonia and osteoarthritis were also common reasons for hospitalization among men with prostate cancer. Just over 3 percent of patients with prostate cancer were hospitalized with a principal diagnosis of secondary malignancies, or metastatic cancer. Data Source The estimates in this Statistical Brief are based on data from the Healthcare Cost and Utilization Project (HCUP) 2004 Nationwide Inpatient Sample (NIS). Historical data were drawn from the 1997–2004 NIS. Supplemental sources included data on age group population estimates from Table 2: Annual Estimates of the Population by Selected Age Groups and Sex for the United States: April 1, 2000 to July 1, 2005 (NST-EST2005-02) and the archives from the Population Division, U.S. Census Bureau (http://www.census.gov/popest/). Definitions Types of hospitals included in HCUP HCUP is based on data from community hospitals, defined as short-term, non-Federal, general and other hospitals, excluding hospital units of other institutions (e.g., prisons). HCUP data include OB-GYN, ENT, orthopedic, cancer, pediatric, public, and academic medical hospitals. They exclude long-term care, rehabilitation, psychiatric, and alcoholism and chemical dependency hospitals, but these types of discharges are included if they are from community hospitals. Unit of analysis The unit of analysis is the hospital discharge (i.e., the hospital stay), not a person or patient. This means that a person who is admitted to the hospital multiple times in one year will be counted each time as a separate "discharge" from the hospital. Costs and charges Total hospital charges were converted to costs using HCUP cost-to-charge ratios based on hospital accounting reports from the Centers for Medicare and Medicaid Services (CMS).6 Costs will tend to reflect the actual costs of production, while charges represent what the hospital billed for the case. For each hospital, a hospital-wide cost-to-charge ratio is used because detailed charges are not available across all HCUP States. Hospital charges reflect the amount the hospital charged for the entire hospital stay and does not include professional (physician) fees. For the purposes of this Statistical Brief, costs are reported to the nearest hundreds. Payer Up to two payers can be coded for a hospital stay in HCUP data. When this occurs, the following hierarchy is used: – If either payer is listed as Medicaid, the payer is "Medicaid." – For non-Medicaid stays, if either payer is listed as Medicare, the payer is "Medicare." – For stays that are neither Medicaid nor Medicare, if either payer is listed as private insurance, the payer is "private insurance." – For stays that are not Medicaid, Medicare or private insurance, if either payer is some other third-party payer, the payer is "other," which consists of Worker�s Compensation, TRICARE/CHAMPUS, CHAMPVA, Title V, and other government programs. – For stays that have no third-party payer and the payer is listed as "self-pay" or "no charge," the payer is "uninsured." Diagnoses, ICD-9-CM, and Clinical Classifications Software (CCS), and Diagnosis-Related Groups (DRGs) The principal diagnosis is that condition established after study to be chiefly responsible for the patient’s admission to the hospital. Secondary diagnoses are concomitant conditions that coexist at the time of admission or that develop during the stay. All-listed diagnoses include the principal diagnosis plus these additional secondary conditions. ICD-9-CM is the International Classification of Diseases, Ninth Revision, Clinical Modification, which assigns numeric codes to diagnoses. There are about 12,000 ICD-9-CM diagnosis codes. CCS categorizes ICD-9-CM diagnoses into 260 clinically meaningful categories.7 This "clinical grouper" makes it easier to quickly understand patterns of diagnoses and procedures. The following ICD-9-CM diagnosis codes are included in CCS category 29, Prostate Cancer: – 185 Malignant neoplasm of prostate – 233.4 Carcinoma in situ of prostate – V10.46 Personal history of malignant neoplasm—prostate Procedures and Clinical Classifications Software (CCS) The principal procedure is the procedure that was performed for definitive treatment rather than one performed for diagnostic or exploratory purposes (i.e., the procedure that was necessary to take care of a complication). If two procedures appear to meet this definition, the procedure most related to the principal diagnosis was selected as the principal procedure. All-listed procedures include the principal procedure plus any additional secondary procedures. CCS categorizes procedure codes into clinically meaningful categories. This "clinical grouper"" makes it easier to quickly understand patterns of procedure use. The following ICD-9-CM procedure codes are included in the CCS procedure category 113, Transurethral prostatectomy (TURP): – 60.2 Transurethral prostatectomy – 60.21 Transurethral (ultrasound) laser guided induced prostatectomy (TULIP) – 60.29 Other transurethral prostatectomy – 60.96 Transurethral destruction of prostate tissue by microwave thermotherapy – 60.97 Other transurethral destruction of prostate tissue by other thermotherapy The following ICD-9-CM procedure codes are included in the CCS procedure category 114, Open prostatectomy: – 60.3 Suprapubic prostatectomy – 60.4 Retropubic prostatectomy – 60.5 Radical prostatectomy – 60.61 Local excision of lesion of prostate – 60.62 Perineal prostatectomy – 60.69 Other About the NIS The HCUP Nationwide Inpatient Sample (NIS) is a nationwide database of hospital inpatient stays. The NIS is nationally representative of all community hospitals (i.e., short-term, non-Federal, non-rehabilitation hospitals). The NIS is a sample of hospitals and includes all patients from each hospital, regardless of payer. It is drawn from a sampling frame that contains hospitals comprising 90 percent of all discharges in the United States. The vast size of the NIS allows the study of topics at both the national and regional levels for specific subgroups of patients. In addition, NIS data are standardized across years to facilitate ease of use. About HCUP HCUP is a family of powerful health care databases, software tools, and products for advancing research. Sponsored by the Agency for Healthcare Research and Quality (AHRQ), HCUP includes the largest all- payer encounter-level collection of longitudinal health care data (inpatient, ambulatory surgery, and emergency department) in the United States, beginning in 1988. HCUP is a Federal-State-Industry Partnership that brings together the data collection efforts of many organizations—such as State data organizations, hospital associations, private data organizations, and the Federal government—to create a national information resource. For more information about HCUP, visit http://www.hcup-us.ahrq.gov. HCUP would not be possible without the contributions of the following data collection Partners from across the United States: Arizona Department of Health Services Arkansas Department of Health & Human Services California Office of Statewide Health Planning & Development Colorado Health & Hospital Association Connecticut Integrated Health Information (Chime, Inc.) Florida Agency for Health Care Administration Georgia GHA: An Association of Hospitals & Health Systems Hawaii Health Information Corporation Illinois Health Care Cost Containment Council and Department of Public Health Indiana Hospital&Health Association Iowa Hospital Association Kansas Hospital Association Kentucky Cabinet for Health and Family Services Maryland Health Services Cost Review Commission Massachusetts Division of Health Care Finance and Policy Michigan Health & Hospital Association Minnesota Hospital Association Missouri Hospital Industry Data Institute Nebraska Hospital Association Nevada Division of Health Care Financing and Policy, Department of Human Resources New Hampshire Department of Health & Human Services New Jersey Department of Health and Senior Services New York State Department of Health North Carolina Department of Health and Human Services Ohio Hospital Association Oregon Office for Oregon Health Policy and Research and Oregon Association of Hospitals and Health Systems Rhode Island Department of Health South Carolina State Budget & Control Board South Dakota Association of Healthcare Organizations Tennessee Hospital Association Texas Department of State Health Services Utah Department of Health Vermont Association of Hospitals and Health Systems Virginia Health Information Washington State Department of Health West Virginia Health Care Authority Wisconsin Department of Health and Family Services For additional HCUP statistics, visit HCUPnet, our interactive query system at https://datatools.ahrq.gov/hcupnet. For More Information For a detailed description of HCUP and more information on the design of the NIS and methods to calculate estimates, please refer to the following publications: Steiner, C., Elixhauser, A., Schnaier, J. The Healthcare Cost and Utilization Project: An Overview. Effective Clinical Practice 5(3):143–51, 2002. Design of the HCUP Nationwide Inpatient Sample, 2004. Online. August 8, 2006. U.S. Agency for Healthcare Research and Quality. http://www.hcup-us.ahrq.gov/db/nation/nis/reports/NIS_2004_Design_Report.pdf Houchens, R., Elixhauser, A. Final Report on Calculating Nationwide Inpatient Sample (NIS) Variances, 2001. HCUP Methods Series Report #2003-2. Online. June 2005 (revised June 6, 2005). U.S. Agency for Healthcare Research and Quality. http://www.hcup-us.ahrq.gov/reports/methods/2003_02.pdf Houchens R. L., Elixhauser, A. Using the HCUP Nationwide Inpatient Sample to Estimate Trends. (Updated for 1988–2004). HCUP Methods Series Report #2006-05 Online. August 18, 2006. U.S. Agency for Healthcare Research and Quality. http://www.hcup-us.ahrq.gov/reports/methods/2006_05_NISTrendsReport_1988-2004.pdf Suggested Citation Milenkovic, M. (Thomson Medstat), Russo, C. A. (Thomson Medstat), and Elixhauser, A. (AHRQ). Hospital Stays for Prostate Cancer, 2004. HCUP Statistical Brief #30. May 2007 Agency for Healthcare Research and Quality, Rockville, MD. http://www.hcup-us.ahrq.gov/reports/statbriefs/sb30.pdf *** AHRQ welcomes questions and comments from readers of this publication who are interested in obtaining more information about access, cost, use, financing, and quality of health care in the United States. We also invite you to tell us how you are using this Statistical Brief and other HCUP data and tools, and to share suggestions on how HCUP products might be enhanced to further meet your needs. Please e-mail us at hcup@ahrq.gov or send a letter to the address below:Irene Fraser, Ph.D., Director Center for Delivery, Organization, and Markets Agency for Healthcare Research and Quality 540 Gaither Road Rockville, MD 20850 1National Cancer Institute. A Snapshot of Prostate Cancer. September 2006. Web link has been changed. Information updated November 2014:http://www.cancer.gov/research/progress/snapshots/prostate (accessed September 24, 2015). 2Basal cell carcinoma is the most common cancer in men and women. It is a slow-growing skin cancer that is generally noninvasive and easy to treat. 3Ries LAG, Harkins D, Krapcho M, Mariotto A, Miller BA, Feuer EJ, Clegg L, Eisner MP, Horner MJ, Howlader N, Hayat M, Hankey BF, Edwards BK (eds). SEER Cancer Statistics Review, 1975–2003, National Cancer Institute. Bethesda, MD. http://seer.cancer.gov/csr/1975_2003/ (Accessed March 19, 2007). 4Wilson LS, Tesoro R, Elkin EP, et al. Cumulative cost pattern comparison of prostate cancer treatments. Cancer 2007; 109:518–527. 5Russo CA, Owens P, Steiner C, Josephsen J. Ambulatory Surgery in U.S. Hospitals, 2003. Agency for Healthcare Research and Quality, 2007. HCUP Fact Book No. 9. AHRQ Publication No. 07-0007. ISBN 1-58763-228-4. 6HCUP Cost-to-Charge Ratio Files (CCR). Healthcare Cost and Utilization Project (HCUP). 2001–2003. U.S. Agency for Healthcare Research and Quality, Rockville, MD. http://www.hcup-us.ahrq.gov/db/state/costtocharge.jsp. 7HCUP CCS. Healthcare Cost and Utilization Project (HCUP). August 2006. U.S. Agency for Healthcare Research and Quality, Rockville, MD. http://www.hcup-us.ahrq.gov/toolssoftware/ccs/ccs.jsp. |
| Table 1. Hospital stays for prostate cancer* compared to hospital stays for all conditions among men, 2004 | ||||
| Hospital stays for prostate cancer | All male hospital stays | |||
|---|---|---|---|---|
| Total number of discharges | 81,300 | 15,773,400 | ||
| Mean length of stay, days | 3.4 | 1255.0 | ||
| Mean cost per hospitalization | $8,100 | $8,800 | ||
| Mean cost per day | $2,400 | $1,800 | ||
| Aggregate costs | $656,992,300 | $137,995,269,600 | ||
| Mean age | 65.0 | 47.5 | ||
| Percentage admitted through emergency department | 7.6% | 48.4% | ||
| In-hospital deaths | 2.1% | 2.6% | ||
| *Based on principal diagnoses. Source: AHRQ, Center for Delivery, Organization, and Markets, Healthcare Cost and Utilization Project, Nationwide Inpatient Sample, 2004. | ||||
| Table 2. Procedures commonly associated with hospital stays for prostate cancer,* 2004 | ||||
| All-listed procedure | Number of hospital stays with this procedure | Percentage of prostate cancer stays with this procedure | ||
|---|---|---|---|---|
| Open prostatectomy | 58,700 | 72.2% | ||
| Transurethral prostatectomy (TURP) | 10,500 | 12.9% | ||
| Blood transfusion | 10,500 | 12.9% | ||
| Endoscopy and endoscopic biopsy of the urinary tract | 5,500 | 6.8% | ||
| Laparoscopy (gastrointestinal only) | 3,300 | 4.1% | ||
| Therapeutic radiology for cancer treatment | 2,000 | 2.5% | ||
| Transurethral excision; drainage; or removal urinary obstruction | 2,000 | 2.5% | ||
| Diagnostic procedures; male genital | 1,700 | 2.1% | ||
| Insertion of catheter or spinal stimulator and injection into spinal canal | 1,600 | 2.0% | ||
| Inguinal and femoral hernia repair | 1,400 | 1.7% | ||
| *Based on principal diagnoses. Source: AHRQ, Center for Delivery, Organization, and Markets, Healthcare Cost and Utilization Project, Nationwide Inpatient Sample, 2004. | ||||
| Table 3. Top 10 most common principal reasons for hospitalization among patients with prostate cancer,* 2004 | |||||
| Rank | Principal diagnosis | Number of hospital stays among patients with prostate cancer | Percentage of all hospital stays among patients with prostate cancer | ||
|---|---|---|---|---|---|
| 1 | Prostate cancer | 81,300 | 16.3% | ||
| 2 | Coronary atherosclerosis (narrowing of the arteries of the heart) | 21,500 | 4.3% | ||
| 3 | Pneumonia | 21,400 | 16.3% | ||
| 4 | Congestive heart failure; nonhypertensive | 18,300 | 3.7% | ||
| 5 | Secondary malignancies | 15,300 | 3.1% | ||
| 6 | Cardiac dysrhythmias | 14,700 | 3.0% | ||
| 7 | Osteoarthritis | 12,700 | 2.5% | ||
| 8 | Acute myocardial infarction (heart attack) | 11,800 | 2.4% | ||
| 9 | Urinary tract infections | 11,000 | 2.2% | ||
| 10 | Acute cerebrovascular disease (stroke) | 10,600 | 2.1% | ||
| *Based on all-listed diagnoses. Source: AHRQ, Center for Delivery, Organization, and Markets, Healthcare Cost and Utilization Project, Nationwide Inpatient Sample, 2004. | |||||
|
|